Chilingarian G.V. et al. Surface Operations in Petroleum Production, II
Подождите немного. Документ загружается.

45
differential would be averaged from the chart by sight. The static pressure for the
equivalent period of time would then be averaged visually from the chart, and these
two values multiplied together. These values would be accumulated for the entire
chart, and then multiplied by the coefficient to get the actual volume of gas
measured. This, however, is a very slow process.
Where fairly good regulation can be maintained
so
that a constant static pressure
is achieved, then
an
ordinary planimeter can be used to compute the differential
value from the chart. This value multiplied by the static pressure and the coefficient
will give the measured volume. Special planimeters (Fig.
2.1-12)
were developed
whch were somewhat easier to use because they were designed for use with the
circular chart.
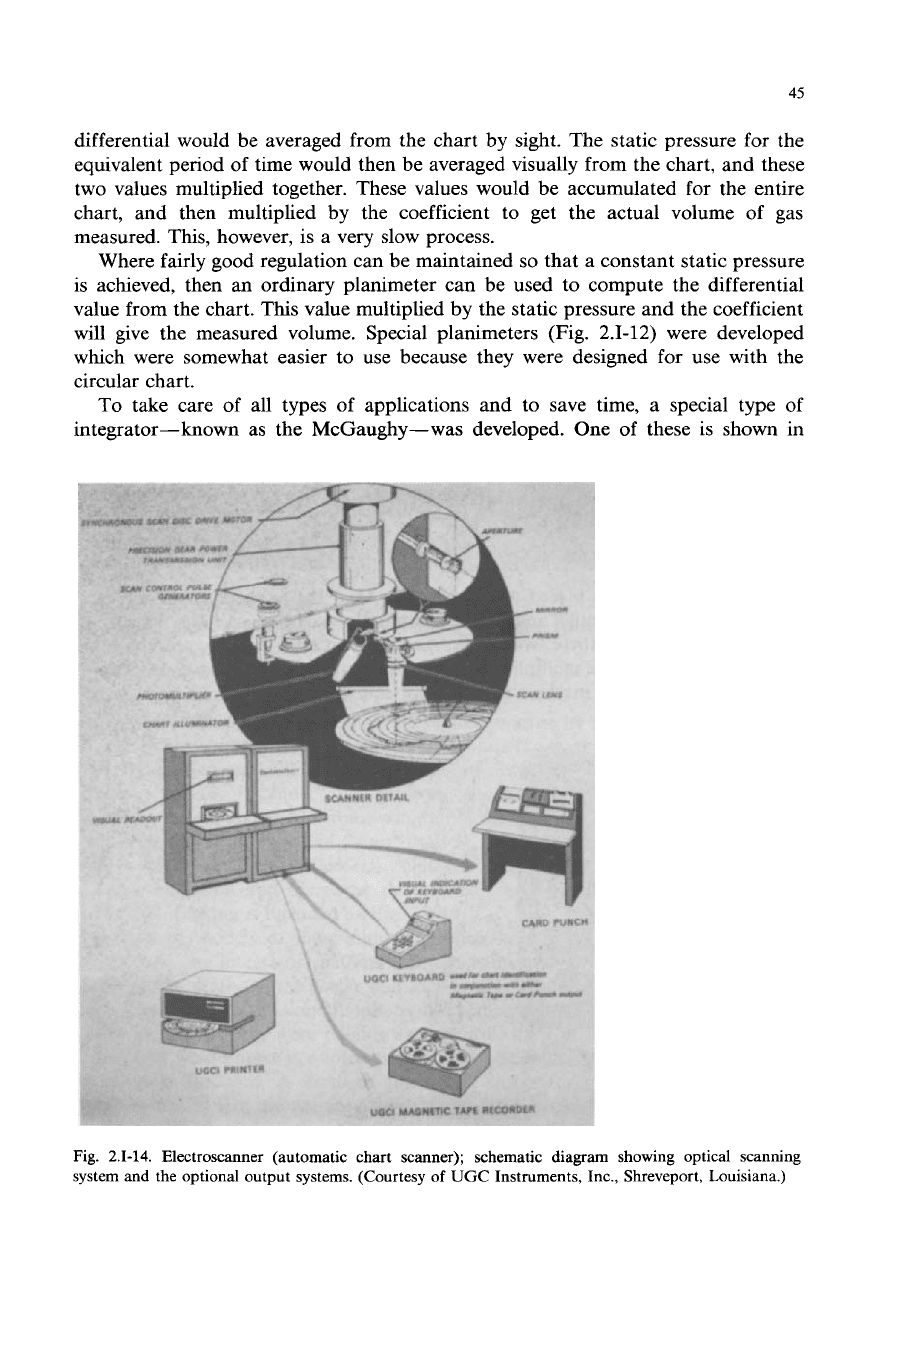
To take care of all types of applications and to save time, a special type of
integrator-known as the McGaughy-was developed. One of these is shown in
Fig.
2.1-14.
Electroscanner (automatic chart scanner); schematic diagram showing optical scanning
system and the optional output systems. (Courtesy
of
UGC
Instruments, Inc., Shreveport, Louisiana.)
46
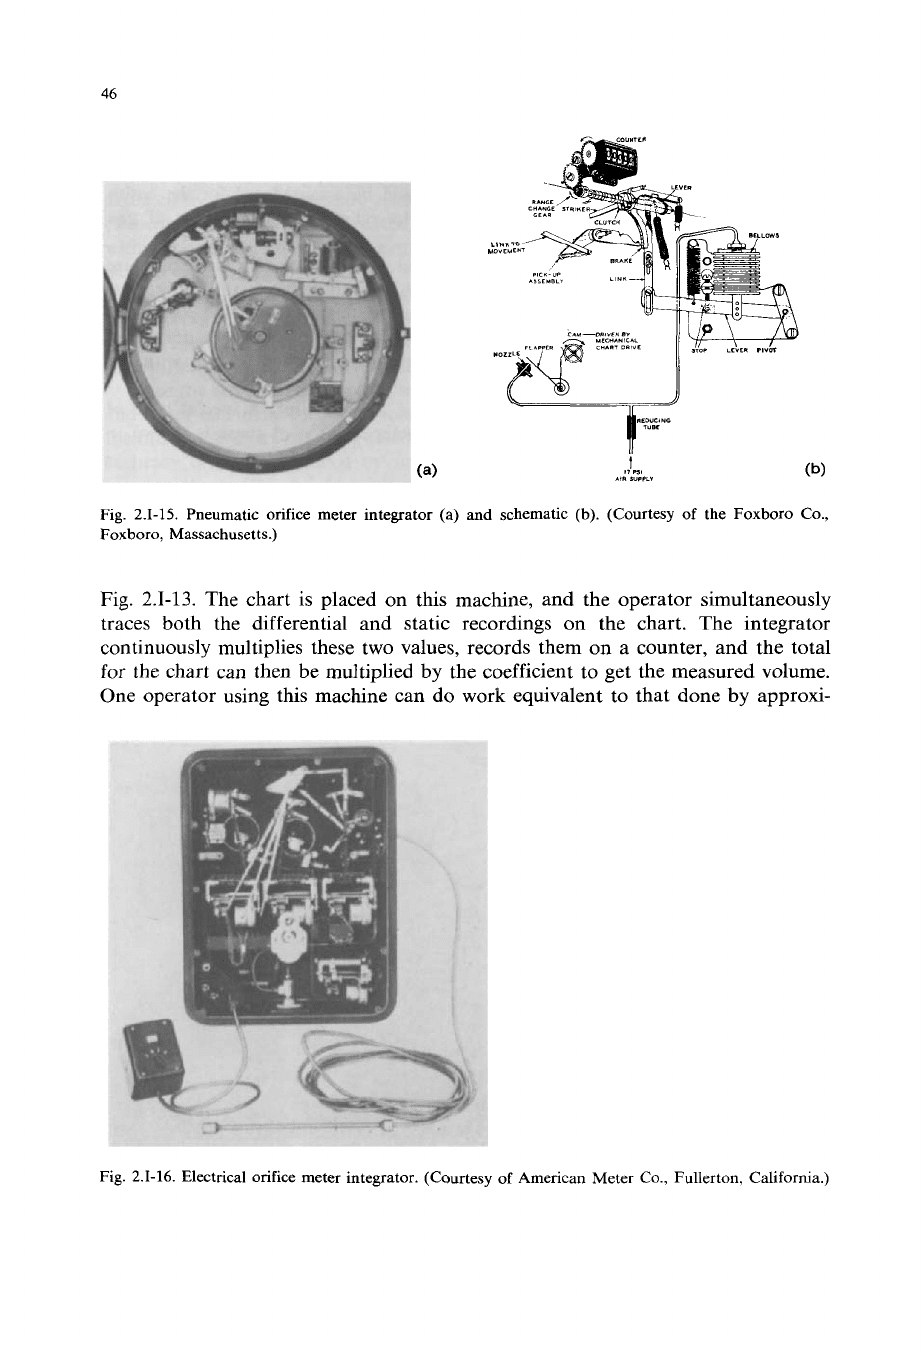
Fig.
2.1-15.
Pneumatic orifice
Foxboro, Massachusetts.)
meter
(a)
integrator (a)
ITn"C4NT
(b)
n
I"=
t
,I
,a 1,R
IYIIL"
and
schematic (b). (Courtesy
of
the Foxboro Co.,
Fig.
2.1-13.
The chart is placed on ths machine, and the operator simultaneously
traces both the differential and static recordings on the chart. The integrator
continuously multiplies these two values, records them on a counter, and the total
for the chart can then be multiplied by the coefficient to get the measured volume.
One operator using this machine can do work equivalent to that done by approxi-
Fig.
2.1-16.
Electrical orifice meter integrator. (Courtesy
of
American Meter
Co.,
Fullerton, California.)
47
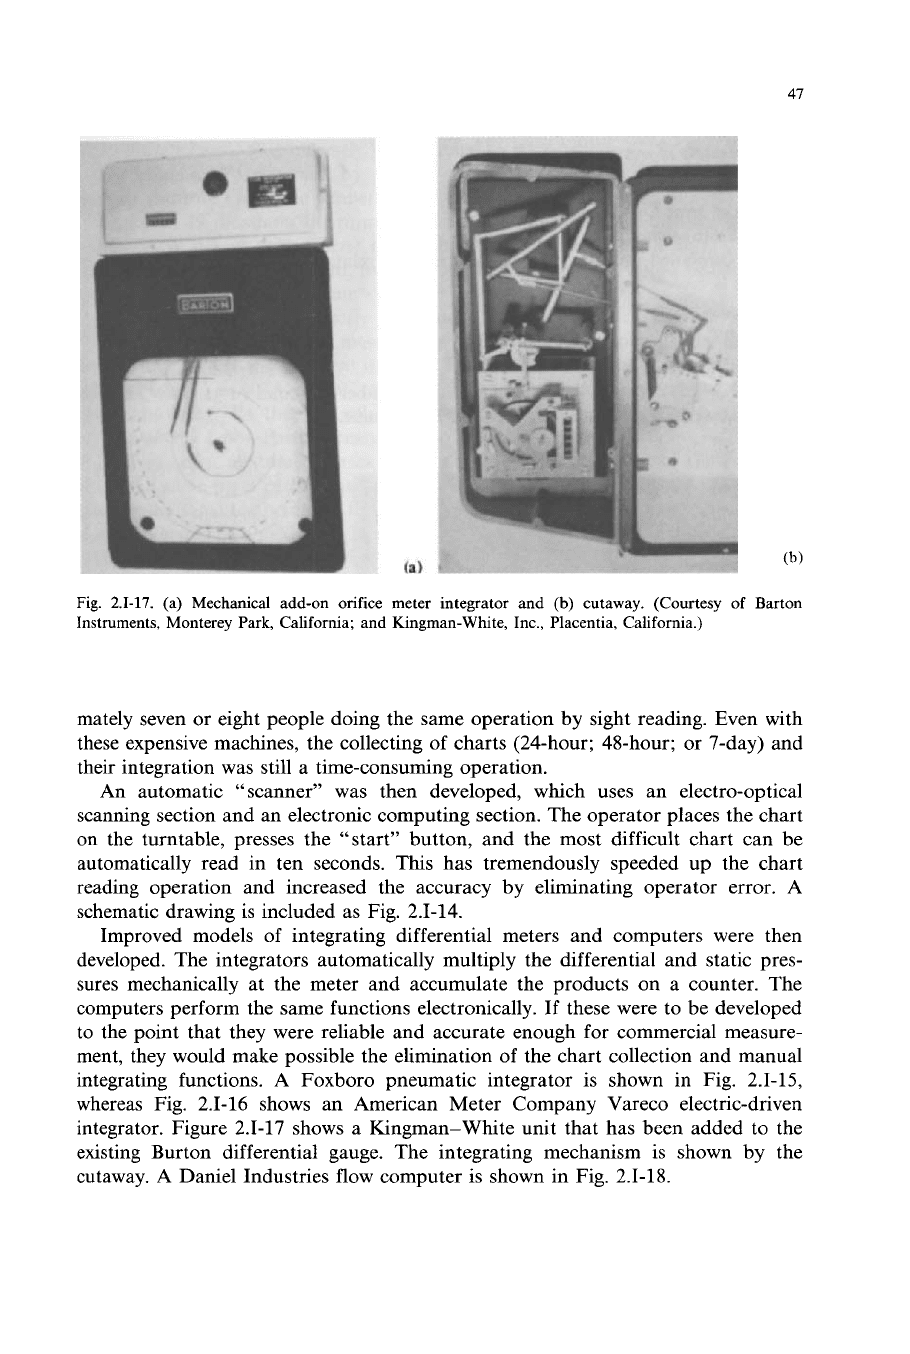
Fig.
2.1-17.
(a) Mechanical add-on orifice meter integrator and
(b)
cutaway. (Courtesy of Barton
Instruments, Monterey Park, California; and Kingman-White, Inc., Placentia, California.)
mately seven or eight people doing the same operation by sight reading. Even with
these expensive machines, the collecting of charts (24-hour; 48-hour; or 7-day) and
their integration was still a time-consuming operation.
An automatic “scanner” was then developed, which uses an electro-optical
scanning section and an electronic computing section. The operator places the chart
on the turntable, presses the “start” button, and the most difficult chart can be
automatically read in ten seconds. This has tremendously speeded up the chart
reading operation and increased the accuracy by eliminating operator error. A
schematic drawing
is
included as Fig. 2.1-14.
Improved models of integrating differential meters and computers were then
developed. The integrators automatically multiply the differential and static pres-
sures mechanically at the meter and accumulate the products on a counter. The
computers perform the same functions electronically. If these were to be developed
to the point that they were reliable and accurate enough for commercial measure-
ment, they would make possible the elimination of the chart collection and manual
integrating functions. A Foxboro pneumatic integrator is shown in Fig. 2.1-15,
whereas Fig. 2.1-16 shows an American Meter Company Vareco electric-driven
integrator. Figure 2.1-17 shows a Kingman-White unit that has been added to the
existing Burton differential gauge. The integrating mechanism is shown by the
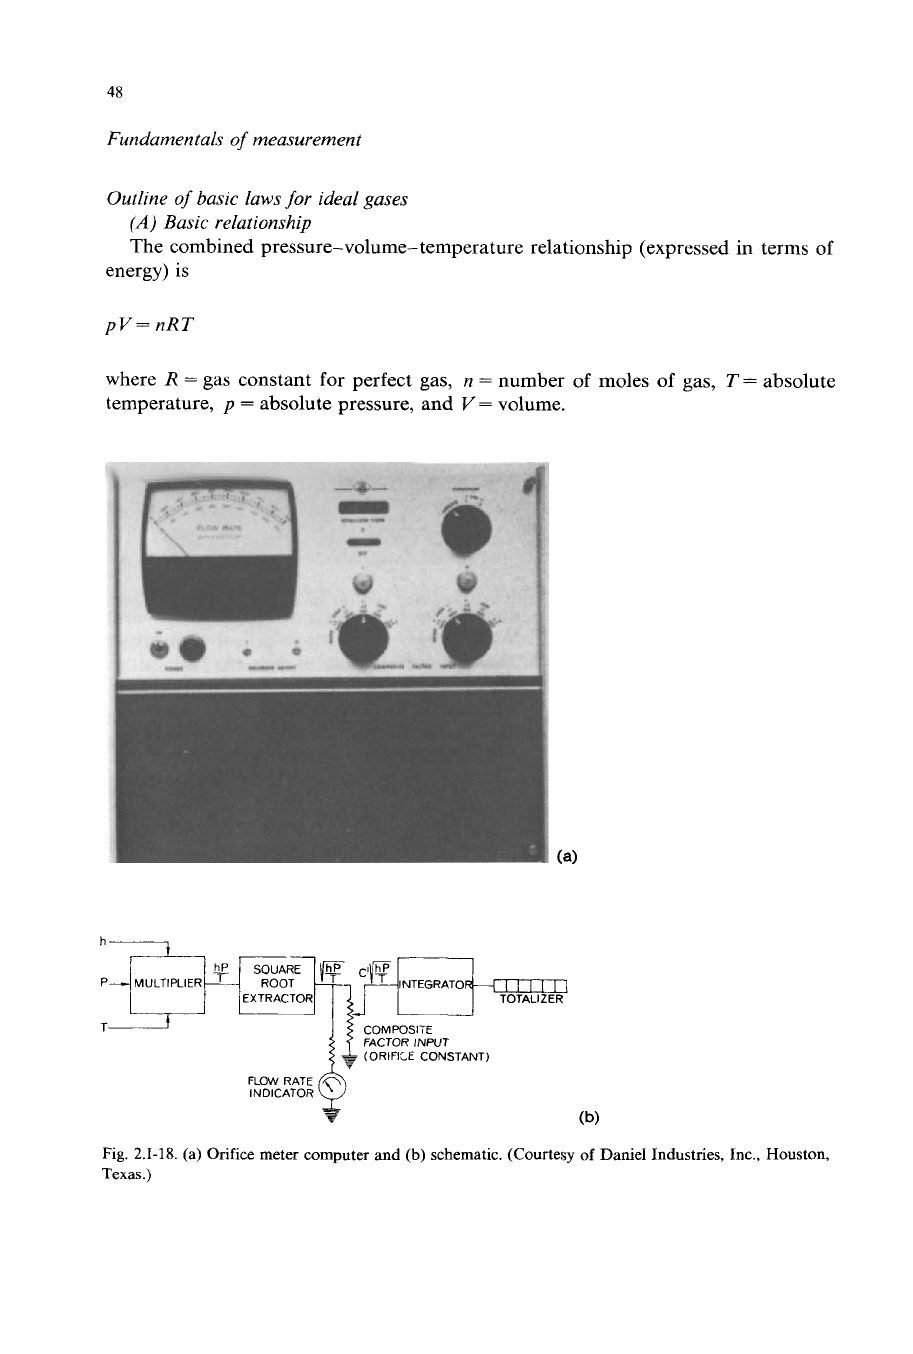
cutaway. A Daniel Industries flow computer is shown in Fig.
2.1-18.
48
Fundamentals
of
measurement
Outline
of
basic laws
for
ideal gases
(A)
Basic relationship
The combined pressure-volume- temperature relationship (expressed in terms
of
energy)
is
pV=nRT
where
R
=
gas constant
for
perfect gas,
n
=
number
of
moles
of
gas,
T
=
absolute
temperature,
p
=
absolute pressure, and
V
=
volume.
EXTRACTOR
T
FLOW RATE
INDICATOR
Fig.
2.1-18. (a) Orifice meter computer
and
(b)
schematic.
(Courtesy
of
Daniel Industries, Inc., Houston,
Texas.)
49
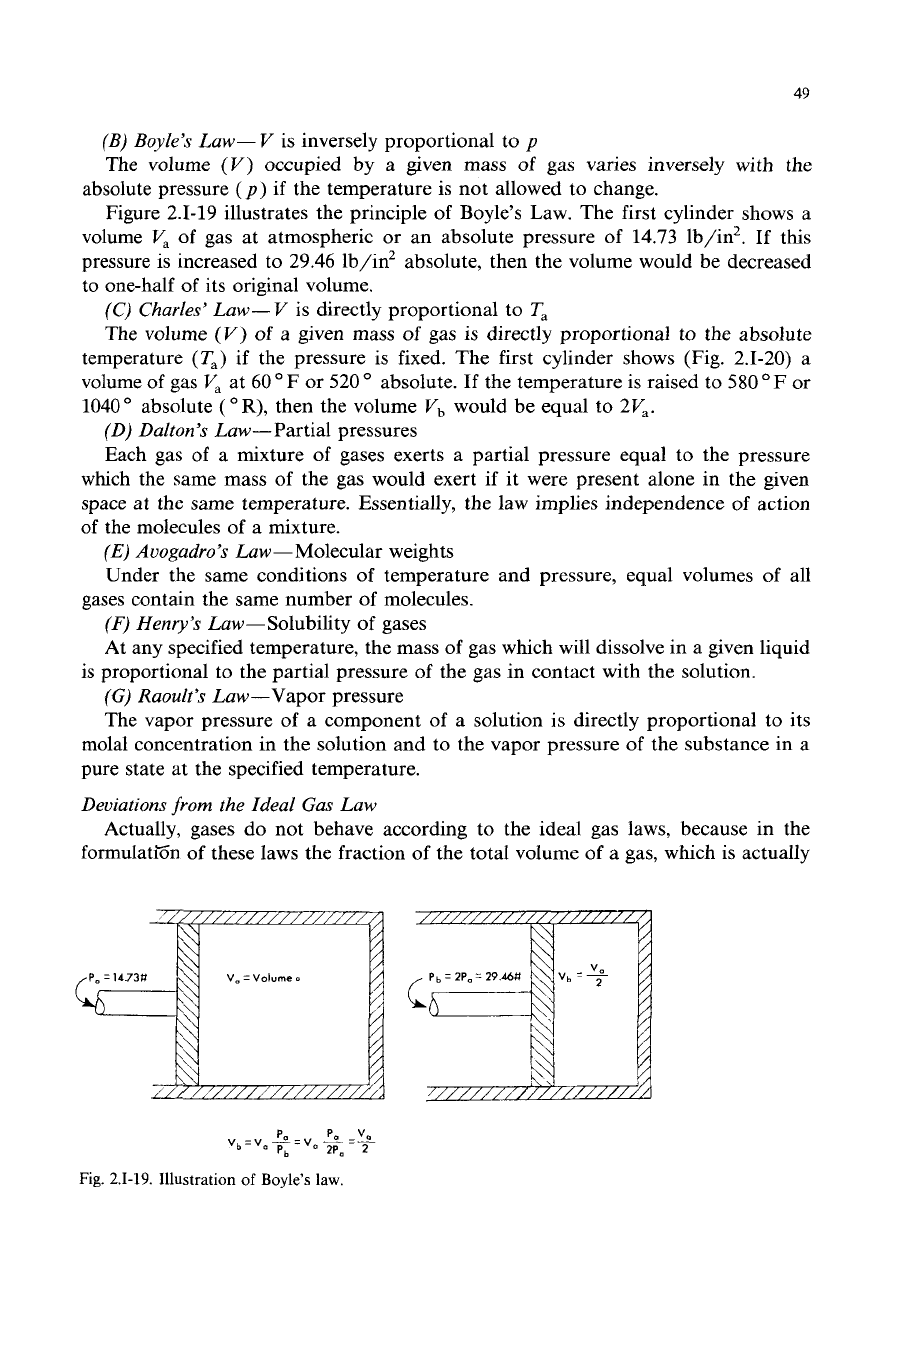
(B) Boyle’s Law-
V
is inversely proportional to
p
The volume
(V)
occupied by a given mass
of
gas varies inversely with the
absolute pressure
(p)
if
the temperature is not allowed
to
change.
Figure 2.1-19 illustrates the principle of Boyle’s Law. The first cylinder shows a
volume
V,
of gas at atmospheric or an absolute pressure of 14.73 lb/in2. If this
pressure is increased to 29.46 lb/in2 absolute, then the volume would be decreased
to one-half of its original volume.
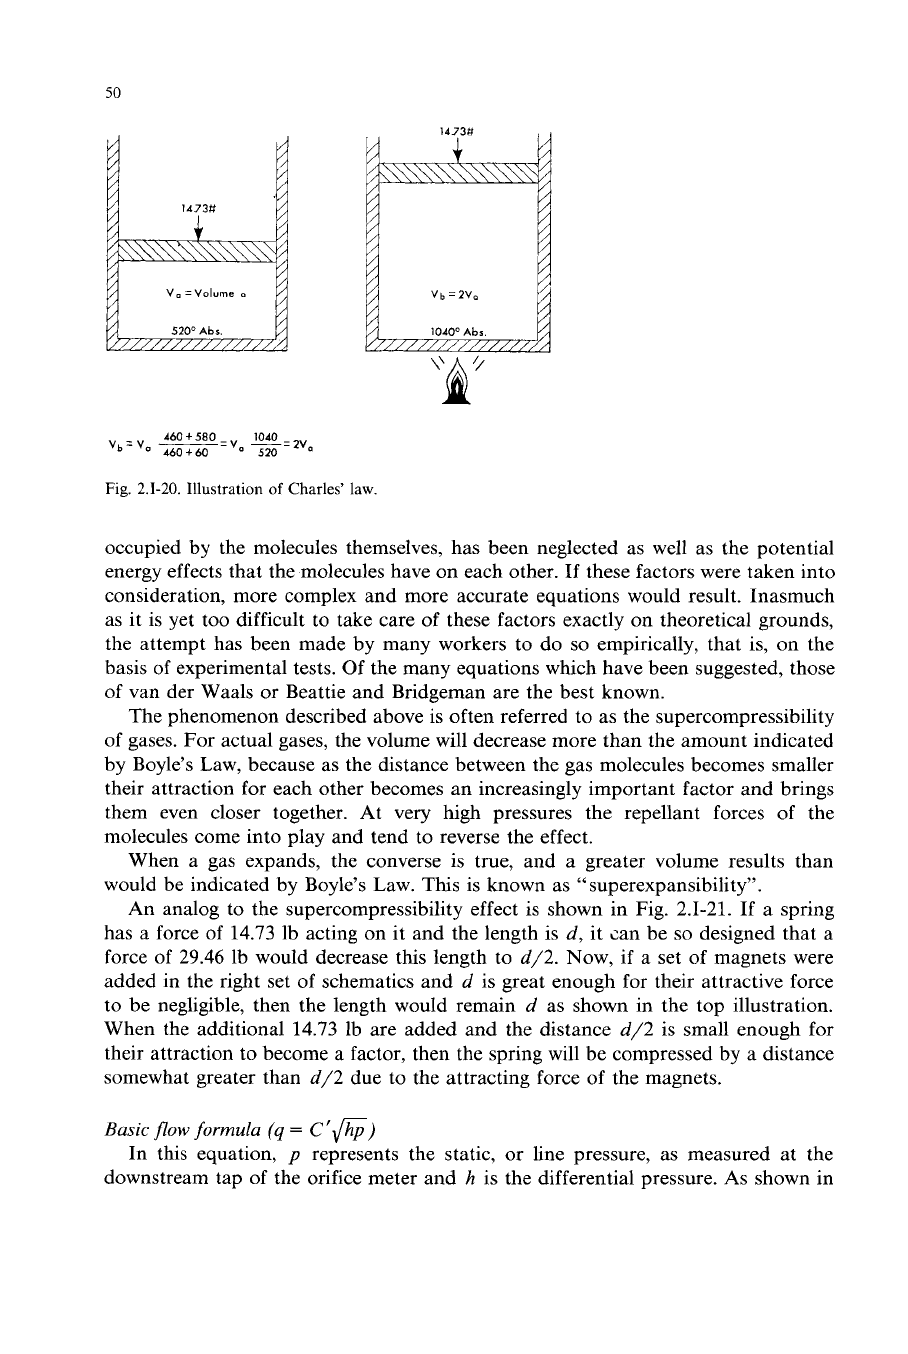
(C)
Charles’ Law-
V
is
directly proportional to
T,
The volume
(V)
of
a given mass
of
gas is directly proportional
to
the absolute
temperature
(T,)
if the pressure is fixed. The first cylinder shows (Fig.
2.1-20)
a
volume
of
gas
V,
at
60
O
F
or 520
O
absolute. If the temperature is raised to
580
OF
or
1040
O
absolute
(
OR),
then the volume
Vb
would be equal
to
2Va.
(0) Dalton’s Law-Partial pressures
Each gas
of
a mixture of gases exerts a partial pressure equal to the pressure
which the same mass of the gas would exert if it were present alone in the given
space at the same temperature. Essentially, the law implies independence
of
action
of the molecules of a mixture.
(E)
Auogudro’s Law-Molecular weights
Under the same conditions
of
temperature and pressure, equal volumes
of
all
gases contain the same number of molecules.
(F)
Henly’s
Law- Solubility
of
gases
At any specified temperature, the mass of gas which will dissolve in a given liquid
(G)
Raoult’s Law-Vapor pressure
The vapor pressure of a component of a solution
is
directly proportional to its
molal concentration in the solution and to the vapor pressure of the substance in a
pure state at the specified temperature.
Deviations
from
the Ideal
Gas
Law
Actually, gases do not behave according to the ideal gas laws, because in the
formulatih of these
laws
the fraction of the total volume of a gas, which
is
actually
is proportional
to
the partial pressure
of
the gas in contact with the solution.
Fig.
2.1-19.
Illustration
of
Boyle’s
law.
50
460
t
580
-
1040
520
460+60
v,
-=2v
vb=v,
~-
Fig.
2.1-20.
Illustration
of
Charles’
law.
occupied by the molecules themselves, has been neglected as well as the potential
energy effects that the molecules have on each other. If these factors were taken into
consideration, more complex and more accurate equations would result. Inasmuch
as it is yet too difficult to take care of these factors exactly
on
theoretical grounds,
the attempt has been made by many workers to do
so
empirically, that
is,
on the
basis of experimental tests. Of the many equations which have been suggested, those
of van der Waals or Beattie and Bridgeman are the best known.
The phenomenon described above is often referred to as the supercompressibility
of gases. For actual gases, the volume will decrease more than the amount indicated
by Boyle’s Law, because as the distance between the gas molecules becomes smaller
their attraction for each other becomes an increasingly important factor and brings
them even closer together. At very high pressures the repellant forces of the
molecules come into play and tend to reverse the effect.
When a gas expands, the converse is true, and a greater volume results than
would be indicated by Boyle’s Law.
This
is known as
“
superexpansibility”.
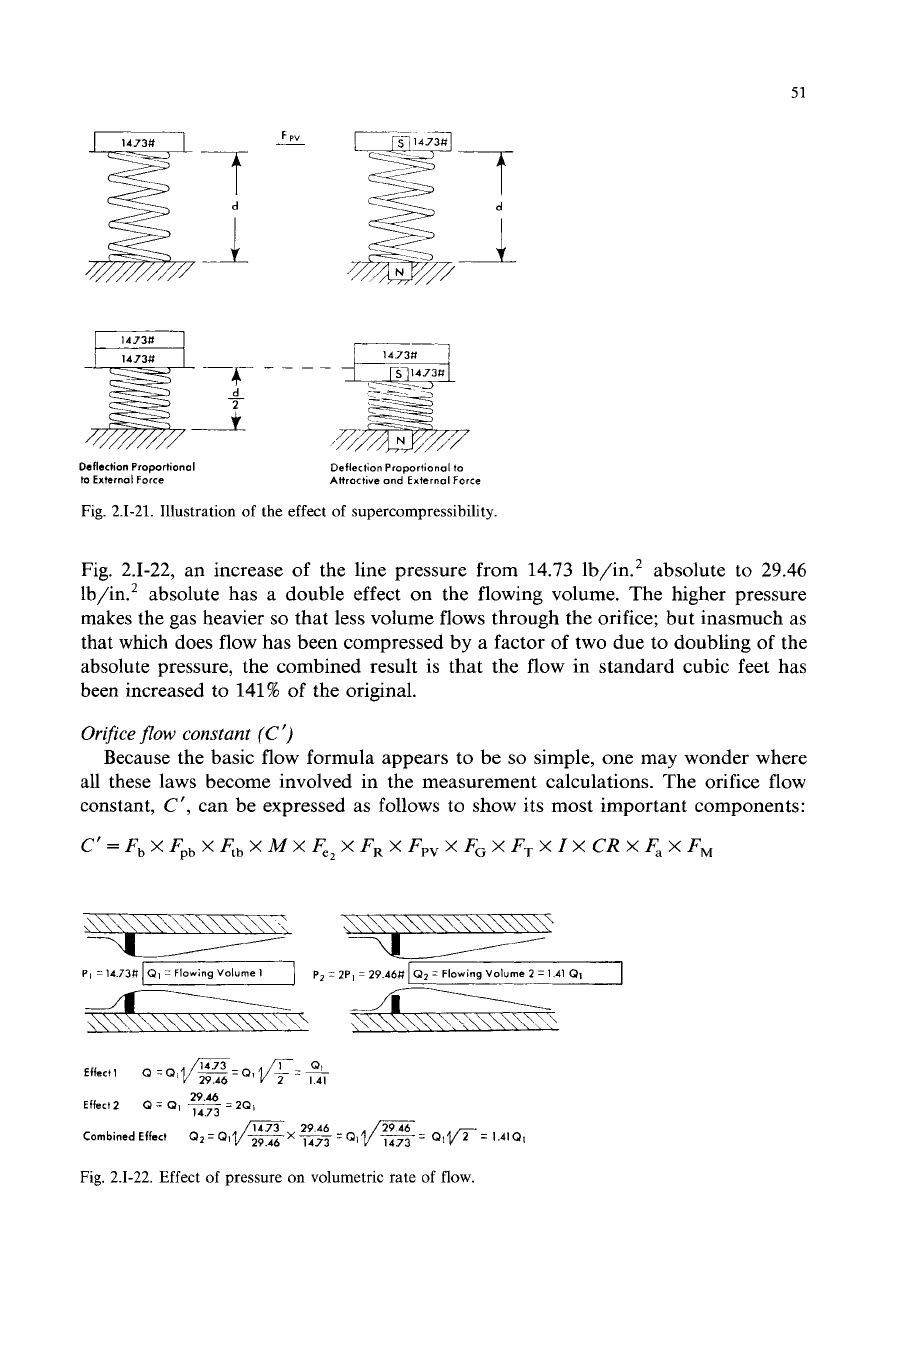
An analog to the supercompressibility effect is shown in Fig.
2.1-21.
If a spring
has a force of
14.73
Ib acting
on
it and the length is
d,
it can be
so
designed that a
force of
29.46
Ib would decrease this length to
d/2.
Now, if a set
of
magnets were
added in the right set of schematics and
d
is great enough for their attractive force
to be negligible, then the length would remain
d
as shown in the top illustration.
When the additional
14.73
lb are added and the distance
d/2
is small enough for
their attraction to become a factor, then the spring will be compressed by a distance
somewhat greater than
d/2
due to the attracting force of the magnets.
Basic
flow
formula
(q
=
C
Jhp)
In this equation,
p
represents the static,
or
line pressure, as measured at the
downstream tap of the orifice meter and
h
is the differential pressure.
As
shown in
51
Deflection Proportional
to External
Force
Deflection Proportional
to
Attrmtive
and
External
Force
Fig.
2.1-21.
Illustration of the effect of supercompressibility.
Fig. 2.1-22, an increase of the line pressure from 14.73 1b/im2 absolute
to
29.46
1b/h2 absolute has a double effect
on
the flowing volume. The higher pressure
makes the gas heavier
so
that less volume flows through the orifice; but inasmuch as
that which does flow has been compressed by a factor
of
two due to doubling of the
absolute pressure, the combined result is that the flow in standard cubic feet has
been increased to 141%
of
the original.
Orifice
flow
constant
(C')
Because the basic flow formula appears to be
so
simple, one may wonder where
all these laws become involved in the measurement calculations. The orifice flow
constant,
C',
can be expressed as follows to show its most important components:
C'=
Fb
X
Fpb
X
F&
X
MX
&,
X
FR
X
Fpv
X
FG
X
FT
XI
X
CR
X
4
X
FM
A\\\\\\\\\\\\\\\\\\\\?
pi
=
14.7~
I
QI
=
Flowing
Volume
1
I
p7
=
2p,
=
29.46#
I
Q2
=
Flowing Volume
2
=
1.41
QI
I
Fig.
2.1-22.
Effect of pressure
on
volumetric rate of
flow.
52
G=l
The derivation of some of these factors is very complex. Actually, several factors
can be determined only by very extensive tests and experimentation, from which
tables of data have been accumulated
so
that a value may be obtained. The
definition of the factors in the above equation are as follows:
Fb
is the basic orificeflow factor.
This is dependent upon the location of the taps,
the internal diameter of the run, and the size of the orifice.
Fpb
is the pressure base factor.
Most locales use 14.73 lb/in.2 as a standard base.
This is the pressure base adopted by the American Gas Association for its standard,
which represents atmospheric pressure at sea level. This factor is a direct application
of Boyle's Law in the correction for this difference in base.
Cb
is the temperature base factor.
Temperature of
60
F
is almost universally used
as the base temperature in calculating gas measured by orifice meters.
If
it was
desired to calculate the measurement, however, on some other contract temperature
base, ths factor would be used in a direct application of Charles' Law to correct for
this change.
M
is the
M
factor.
This is the correction applied because
of
the use
of
a square
root chart.
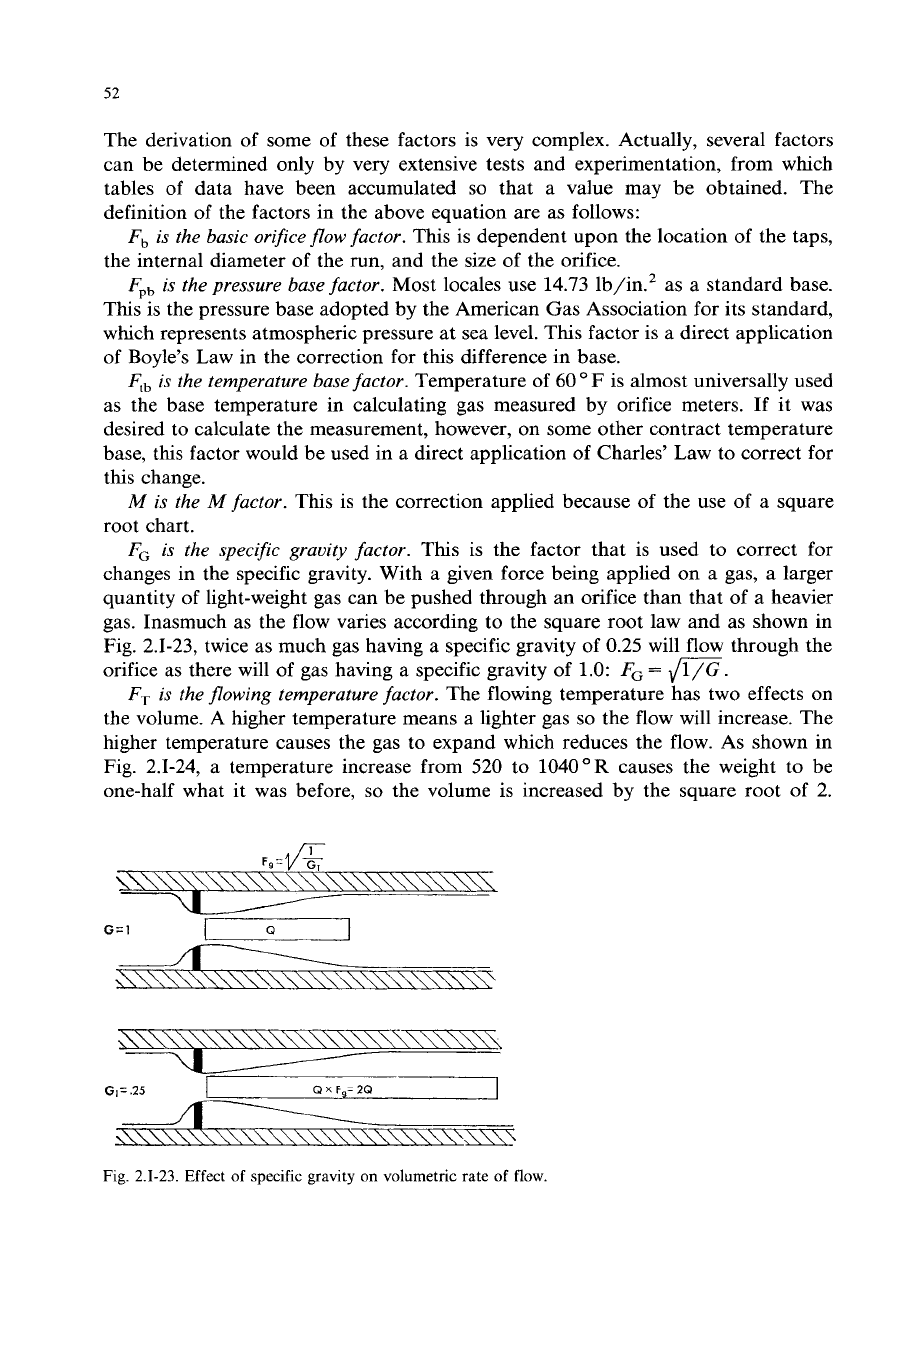
F,
is the specific gravity factor.
This is the factor that is used to correct for
changes in the specific gravity. With a given force being applied on a gas, a larger
quantity of light-weight gas can be pushed through an orifice than that
of
a
heavier
gas. Inasmuch as the flow varies according to the square root law and as shown in
Fig. 2.1-23, twice as much gas having a specific gravity
of
0.25 will flow through the
orifice as there will of gas having a specific gravity of 1.0:
FG
=
p.
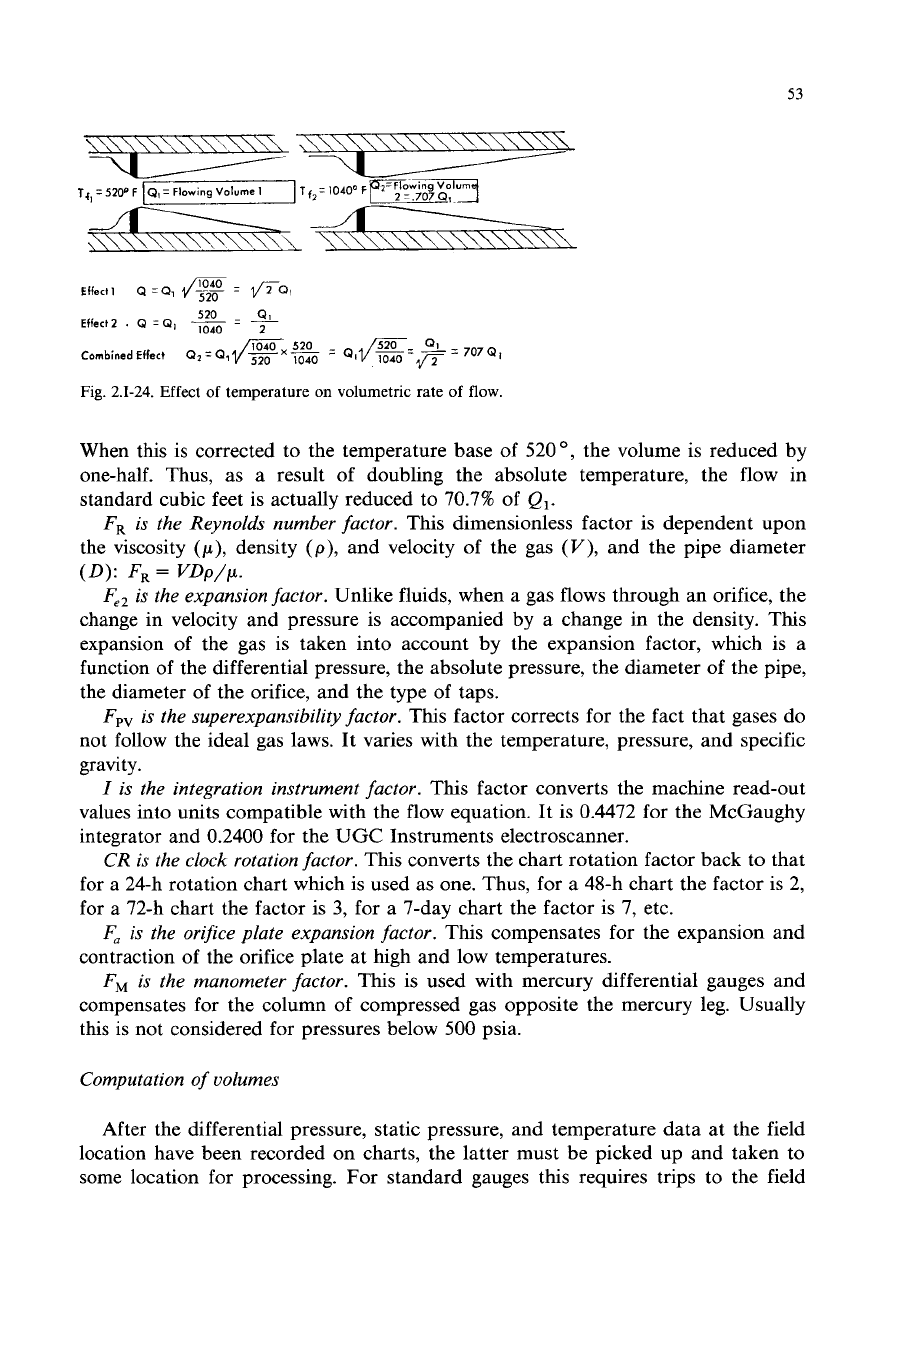
FT
is the flowing temperature factor.
The flowing temperature has two effects on
the volume.
A
higher temperature means a lighter gas
so
the flow will increase. The
higher temperature causes the gas to expand which reduces the flow. As shown in
Fig. 2.1-24, a temperature increase from 520 to 1040"R causes the weight to be
one-half what it was before,
so
the volume is increased by the square root of 2.
Q
1
F.=G
\\\\\\\\\\\\\\\\\\\\\\\\\\\\\
G1z.25
Q
X
F,=
2Q
A\\\\\\\\\\\\\\\\\\\\\\\\\\\
-dY
Fig.
2.1-23.
Effect of specific
gravity
on volumetric rate
of
flow.
53
Fig. 2.1-24. Effect of temperature
on
volumetric rate
of
flow.
When this
is
corrected to the temperature base of 520
O,
the volume
is
reduced by
one-half. Thus, as a result of doubling the absolute temperature, the flow in
standard cubic feet is actually reduced to 70.7% of
Q,.
FR
is the Reynolds number factor.
This dimensionless factor is dependent upon
the viscosity
(p),
density
(p),
and velocity of the gas
(V),
and the pipe diameter
(D):
FR
=
VDp/p.
Fe2
is the expansion factor.
Unlike fluids, when a gas flows through an orifice, the
change in velocity and pressure is accompanied by a change in the density. This
expansion of the gas is taken into account by the expansion factor, which is a
function of the differential pressure, the absolute pressure, the diameter of the pipe,
the diameter of the orifice, and the type of taps.
Fpv
is the superexpansibility factor.
This factor corrects for the fact that gases do
not follow the ideal gas laws. It varies with the temperature, pressure, and specific
gravity.
I
is the integration instrument factor.
This factor converts the machine read-out
values into units compatible with the flow equation.
It
is 0.4472 for the McGaughy
integrator and 0.2400 for the UGC Instruments electroscanner.
CR
is the
clock
rotation factor.
This converts the chart rotation factor back to that
for a 24-h rotation chart which is used as one. Thus, for a 48-h chart the factor is 2,
for a 72-h chart the factor is
3,
for a 7-day chart the factor is 7, etc.
Fa
is the orifice plate expansion factor.
This compensates for the expansion and
contraction
of
the orifice plate at high and low temperatures.
FM
is the manometer factor.
This
is
used with mercury differential gauges and
compensates for the column of compressed gas opposite the mercury leg. Usually
this is not considered for pressures below
500
psia.
Computation of volumes
After the differential pressure, static pressure, and temperature data at the field
location have been recorded on charts, the latter must be picked up and taken to
some location for processing.
For
standard gauges this requires trips to the field
54
location once a day, every other day, every third day, or once a week, depending on
the chart rotation.
With the advent of automatic chart changers this is no longer necessary. Charts
for several days may be loaded at one time. At the completion of recording, the
chart automatically changes and several fully recorded charts may be picked up at
one time. Ths saves much chart changing time and allows more accurate chart
recording because faster rotating charts are economically feasible.
At the central chart processing locations, the charts are integrated or scanned to
obtain chart units per period of operation (usually 24
h).
These chart units must
then be converted to volume by use of the proper basic orifice coefficient and all the
related factors. The most proficient manner
of
doing this is by programming the
rather complex calculations on a computer. The California Natural Gasoline Associ-
ation has outlined (CNGA, 1963) formulas and procedures which may be used to
facilitate this operation.
For those who do not have enough charts to make this economical or because of
the unavailability of a computer, a manual calculation of the coefficient [utilizing
table values for the various factors obtained from references such as AGA (1955)
and CNGA (1947, 1956)] must be made. The purpose of this section is to review the
various factors that are used in the manual calculation of an orifice meter gas
coefficient and
to
show how these factors, when used in a standard sequence, allow
an efficient procedure of coefficient calculation. The procedures are developed to
require a minimum of recalculation when changes in temperature, specific gravity,
and supercompressibility occur.
It should be noted that the factor tables in the bulletins (see references) are in the
same order as the factor arrangement in the coefficient formula. To expedite
coefficient calculation it is advantageous to use a coefficient record form which is
designed to be used in the same order.
In order to show how the factor tables are used in the manual computation of a
gas coefficient, the appropriate factors from the tables in TS-561 (CNGA, 1956)
have been posted
on
a typical coefficient record card, as shown by Table 2.1-1, in the
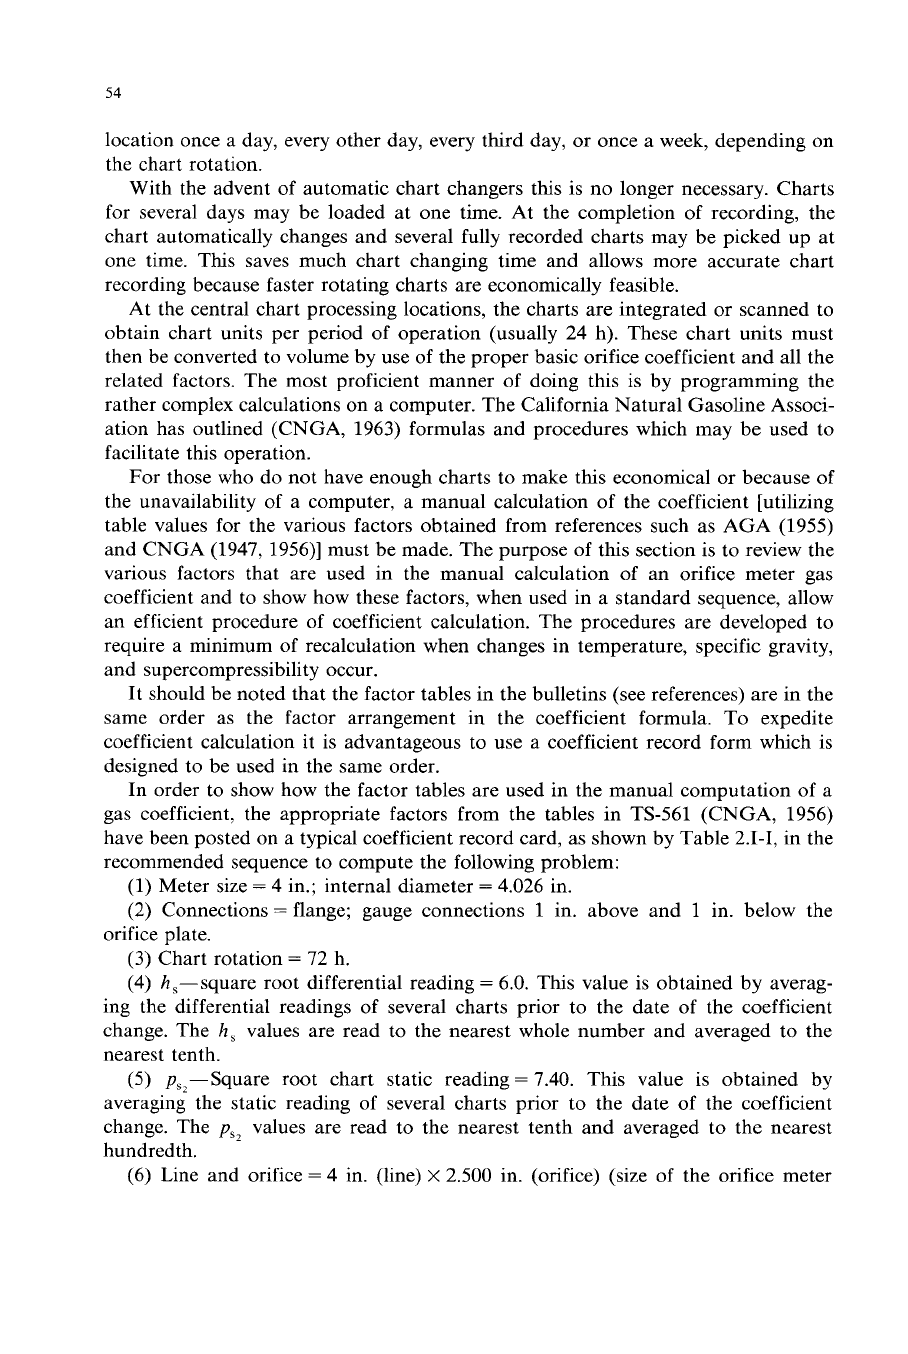
recommended sequence to compute the following problem:
(1) Meter size
=
4 in.; internal diameter
=
4.026 in.
(2)
Connections=flange; gauge connections
1
in. above and
1
in. below the
(3) Chart rotation
=
72 h.
(4) h,-square root differential reading
=
6.0. This value is obtained by averag-
ing the differential readings of several charts prior to the date
of
the coefficient
change. The
h,
values are read to the nearest whole number and averaged to the
nearest tenth.
(5) pSz-Square root chart static reading= 7.40. This value is obtained by
averaging the static reading of several charts prior to the date of the coefficient
change. The
ps,
values are read to the nearest tenth and averaged to the nearest
hundredth.
(6) Line and orifice
=
4 in. (line)
x
2.500 in. (orifice) (size of the orifice meter
orifice plate.