Chilingarian G.V. et al. Surface Operations in Petroleum Production, II
Подождите немного. Документ загружается.

35
Concentric
Eccenlric
Segrnentol
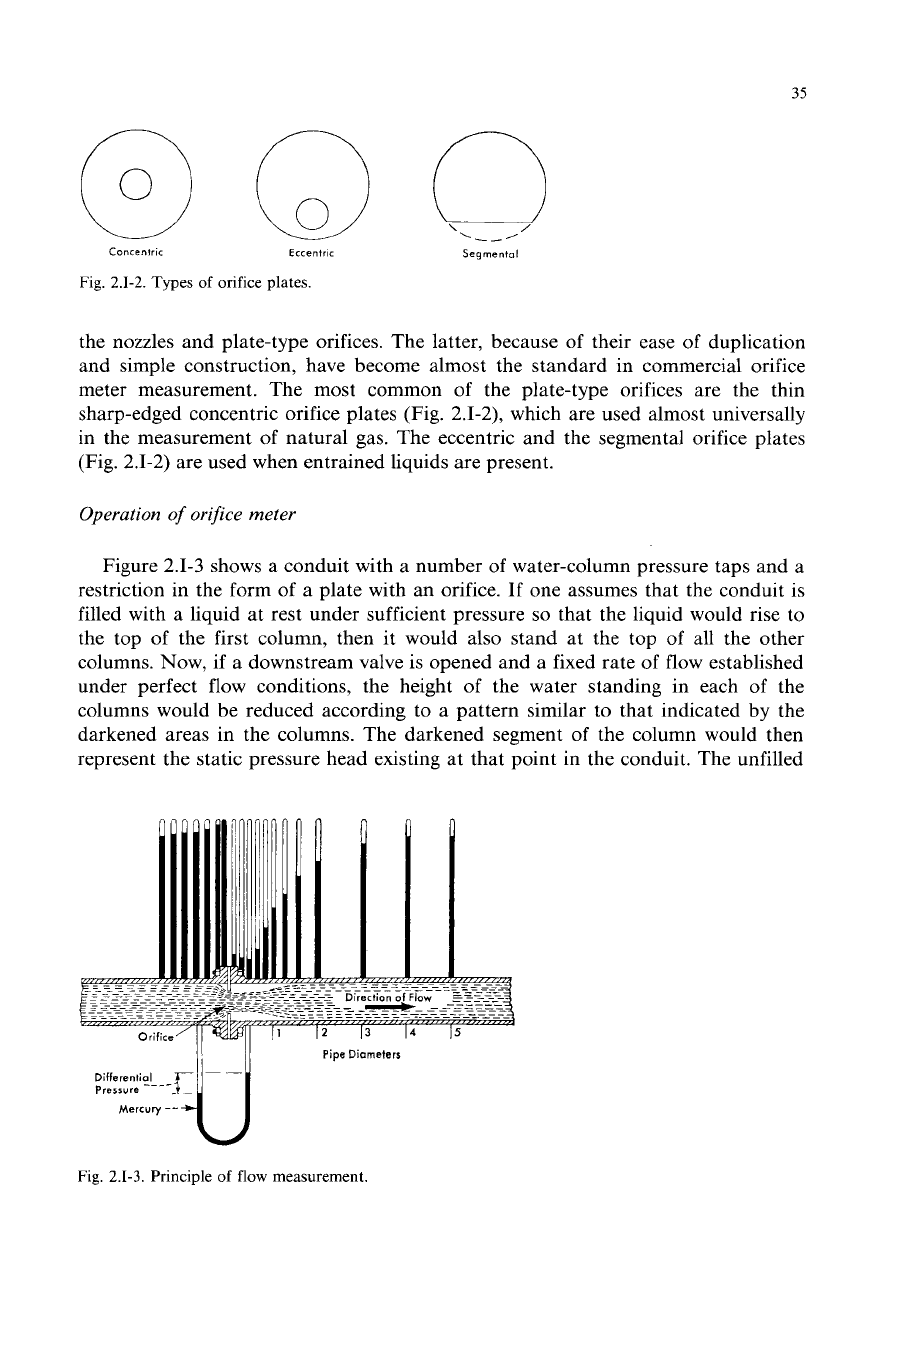
Fig.
2.1-2.
Types
of
orifice plates
the nozzles and plate-type orifices. The latter, because of their ease of duplication
and simple construction, have become almost the standard in commercial orifice
meter measurement. The most common of the plate-type orifices are the thin
sharp-edged concentric orifice plates (Fig. 2.1-2), which are used almost universally
in the measurement of natural gas. The eccentric and the segmental orifice plates
(Fig. 2.1-2) are used when entrained liquids are present.
Operation
of
orifice meter
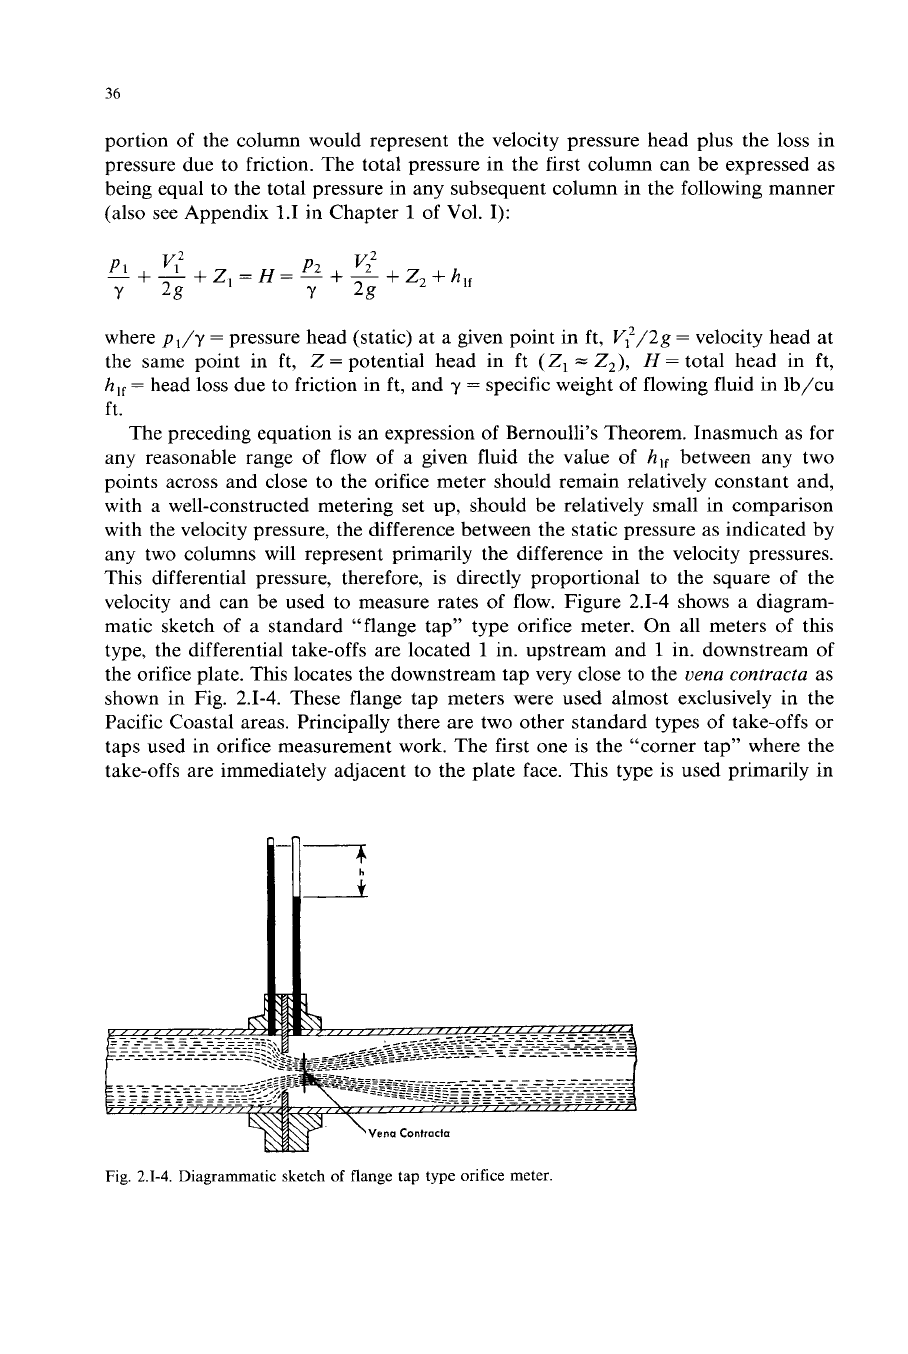
Figure 2.1-3 shows a conduit with a number of water-column pressure taps and a
restriction in the form of a plate with an orifice. If one assumes that the conduit is
filled with a liquid at rest under sufficient pressure
so
that the liquid would rise to
the top of the first column, then it would also stand at the top of all the other
columns. Now, if a downstream valve is opened and a fixed rate of flow established
under perfect flow conditions, the height of the water standing in each of the
columns would be reduced according to a pattern similar to that indicated by the
darkened areas in the columns. The darkened segment of the column would then
represent the static pressure head existing at that point in the conduit. The unfilled
Pipe
Diameters
Mercury
--
Differential
Fig.
2.1-3.
Principle
of
flow
measurement.
5
36
portion of the column would represent the velocity pressure head plus the loss in
pressure due to friction. The total pressure in the first column can be expressed as
being equal to the total pressure in any subsequent column in the following manner
(also see Appendix 1.1 in Chapter
1
of Vol.
I):
where
pl/y
=
pressure head (static) at a given point in ft, V,’/2g
=
velocity head at
the same point in ft,
Z
=
potential head in ft
(Z,
=
Z,),
H
=
total head in ft,
h,,
=
head loss due to friction in ft, and
y
=
specific weight of flowing fluid in lb/cu
ft.
The preceding equation is an expression of Bernoulli’s Theorem. Inasmuch as for
any reasonable range
of
flow of a given fluid the value of
hlf
between any two
points across and close to the orifice meter should remain relatively constant and,
with a well-constructed metering set up, should be relatively small in comparison
with the velocity pressure, the difference between the static pressure as indicated by
any two columns will represent primarily the difference in the velocity pressures.
This differential pressure, therefore, is directly proportional to the square of the
velocity and can be used to measure rates
of
flow. Figure 2.1-4 shows a diagram-
matic sketch of a standard “flange tap” type orifice meter. On all meters of this
type, the differential take-offs are located
1
in. upstream and
1
in. downstream of
the orifice plate. This locates the downstream tap very close to the
uena
contracta
as
shown in Fig. 2.1-4. These flange tap meters were used almost exclusively in the
Pacific Coastal areas. Principally there are two other standard types of take-offs or
taps used in orifice measurement work. The first one is the “corner tap” where the
take-offs are immediately adjacent to the plate face. This type is used primarily in
Fig.
2.1-4.
Diagrammatic sketch of flange tap type orifice meter.
37
Europe. The second is the “pipe tap” wherein the take-offs are located 2; diameters
upstream and
8
diameters downstream. Pipe tap meters were used primarily in the
central and eastern portions
of
the United States.
Figure 2.1-3 shows that there is a considerable difference in the indicated
differential velocity heads for a given flow rate with the different types of taps. The
corner and flange taps give a considerably greater differential than do the pipe taps
for the same rate
of
flow. For this reason, it is extremely important that the data
used for calculation of the orifice meter coefficient be selected on the basis
of
the
differential taps being used.
Description
of
orifice
meter
The basic principle of the orifice meter is
to
produce as near-ideal conditions of
concentric turbulent flow as possible. The meter consists
of
an upstream tube and a
downstream tube connected by an orifice plate fitting. Originally, these tubes were
made extremely long in order to produce the best possible concentric flow condi-
tion. This sometimes resulted in meters being as much as
35-40
ft in length. Later,
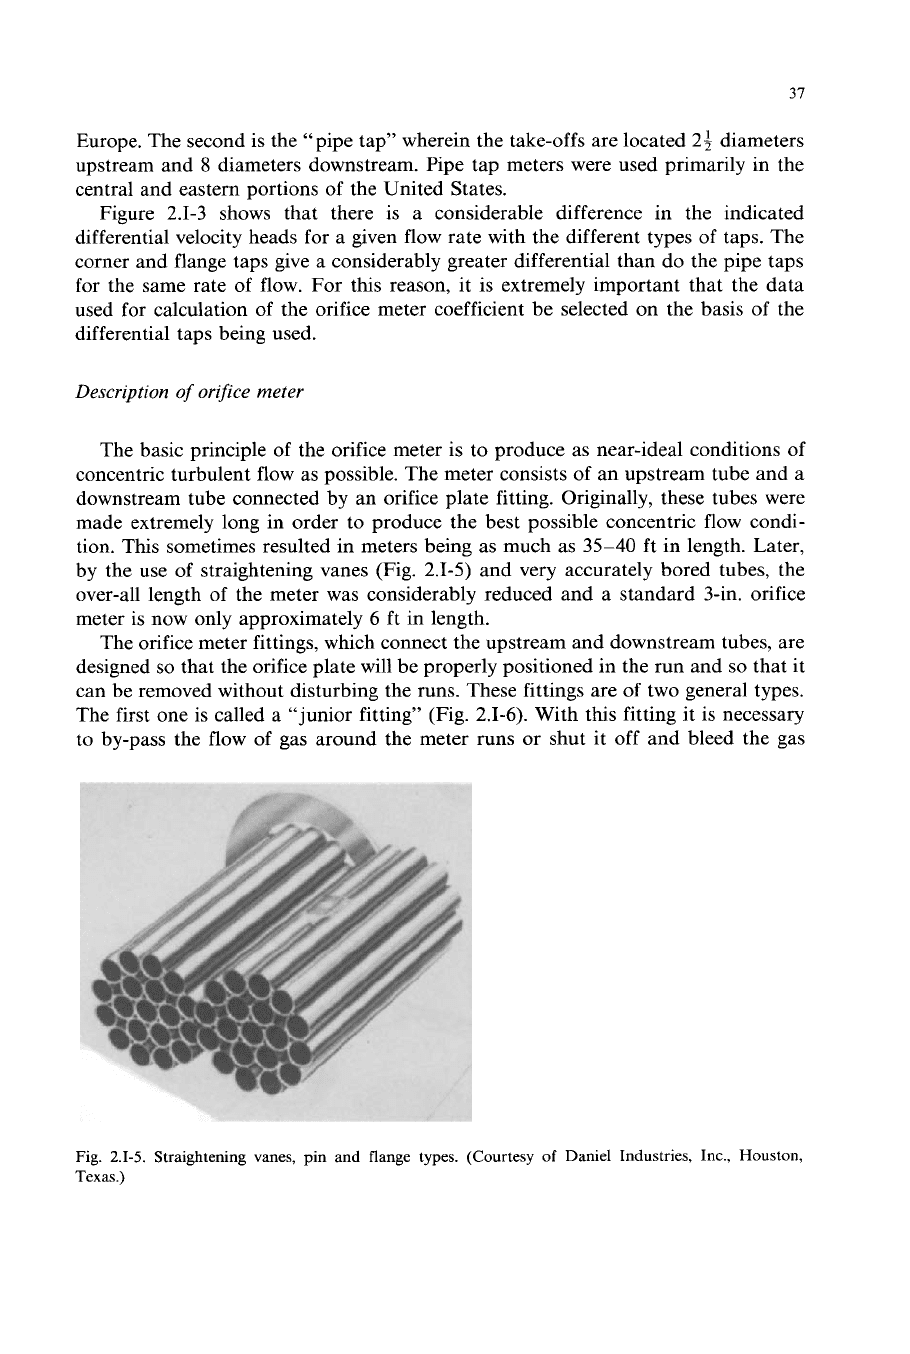
by the use of straightening vanes (Fig.
2.1-5)
and very accurately bored tubes, the
over-all length of the meter was considerably reduced and a standard 3-in. orifice
meter is now only approximately
6
ft in length.
The orifice meter fittings, which connect the upstream and downstream tubes, are
designed
so
that the orifice plate will be properly positioned in the run and
so
that it
can be removed without disturbing the runs. These fittings are of two general types.
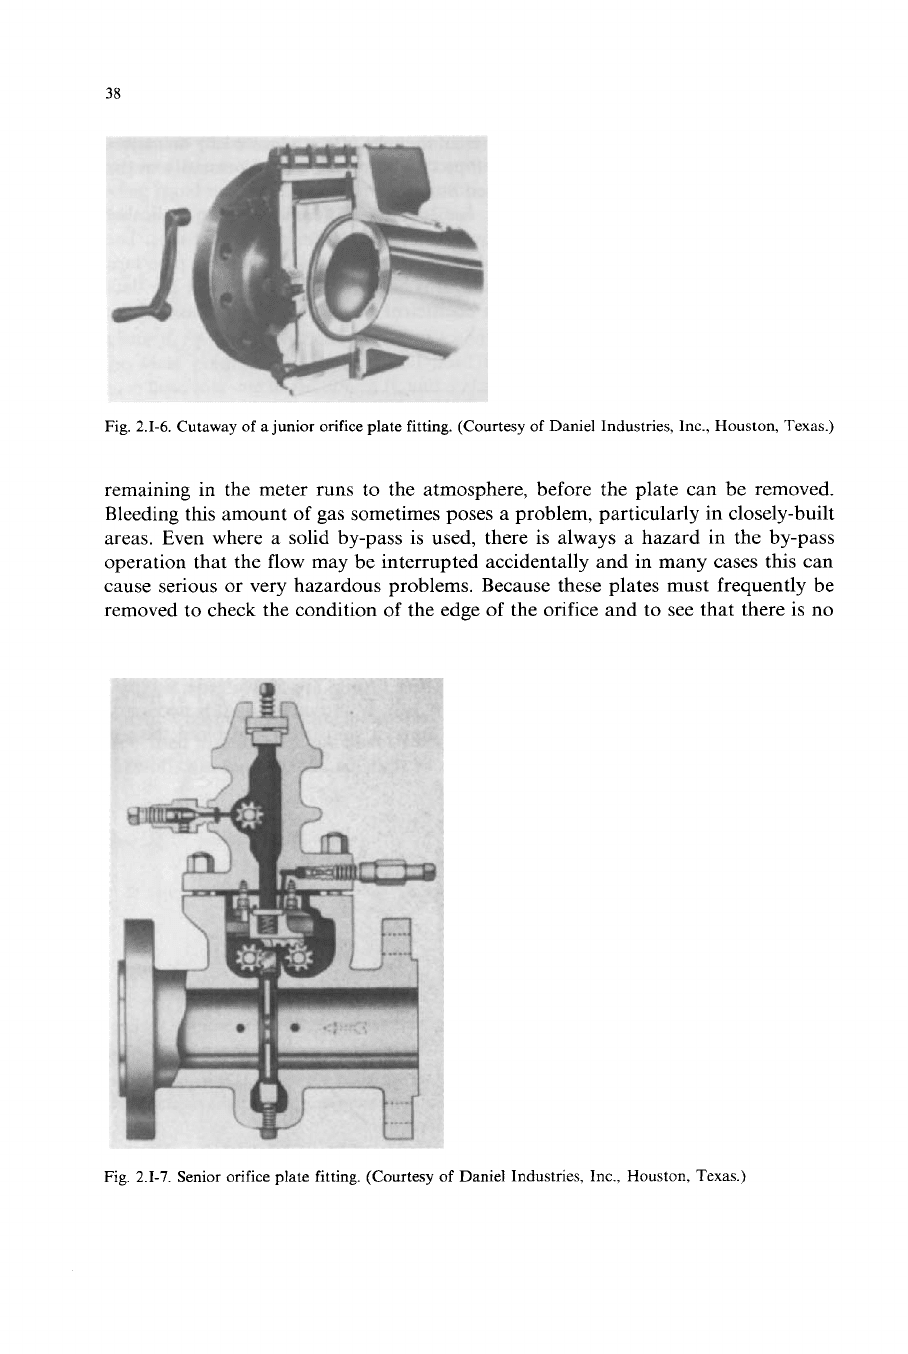
The first one is called a “junior fitting” (Fig. 2.1-6). With ths fitting it is necessary
to by-pass the flow
of
gas around the meter runs or shut it off and bleed the gas
Fig.
2.1-5.
Straightening
vanes,
pin and flange types. (Courtesy
of
Daniel Industries,
Inc.,
Houston,
Texas.)
38
Fig.
2.1-6.
Cutaway
of
a junior orifice plate fitting. (Courtesy of Daniel Industries, lnc., Houston, Texas.)
remaining in the meter runs to the atmosphere, before the plate can be removed.
Bleeding this amount of gas sometimes poses a problem, particularly in closely-built
areas. Even where a solid by-pass is used, there is always a hazard in the by-pass
operation that the flow may be interrupted accidentally and in many cases this can
cause serious or very hazardous problems. Because these plates must frequently be
removed to check the condition
of
the edge
of
the orifice and to see that there
is
no
Fig.
2.1-7.
Senior orifice plate fitting. (Courtesy
of
Daniel Industries, Inc., Houston, Texas.)
39
dirt buildup on the plate, a better method was desirable.
As
a result, the “senior
orifice fitting” (Fig.
2.1-7)
was developed. With this type, the plate can be cranked
into the upper chamber, which is outside and sealed from the meter run by a sliding
valve. The small amount of gas in the upper chamber is then bled to the atmosphere
and the plate removed. It is not necessary to interrupt, nor is it possible to
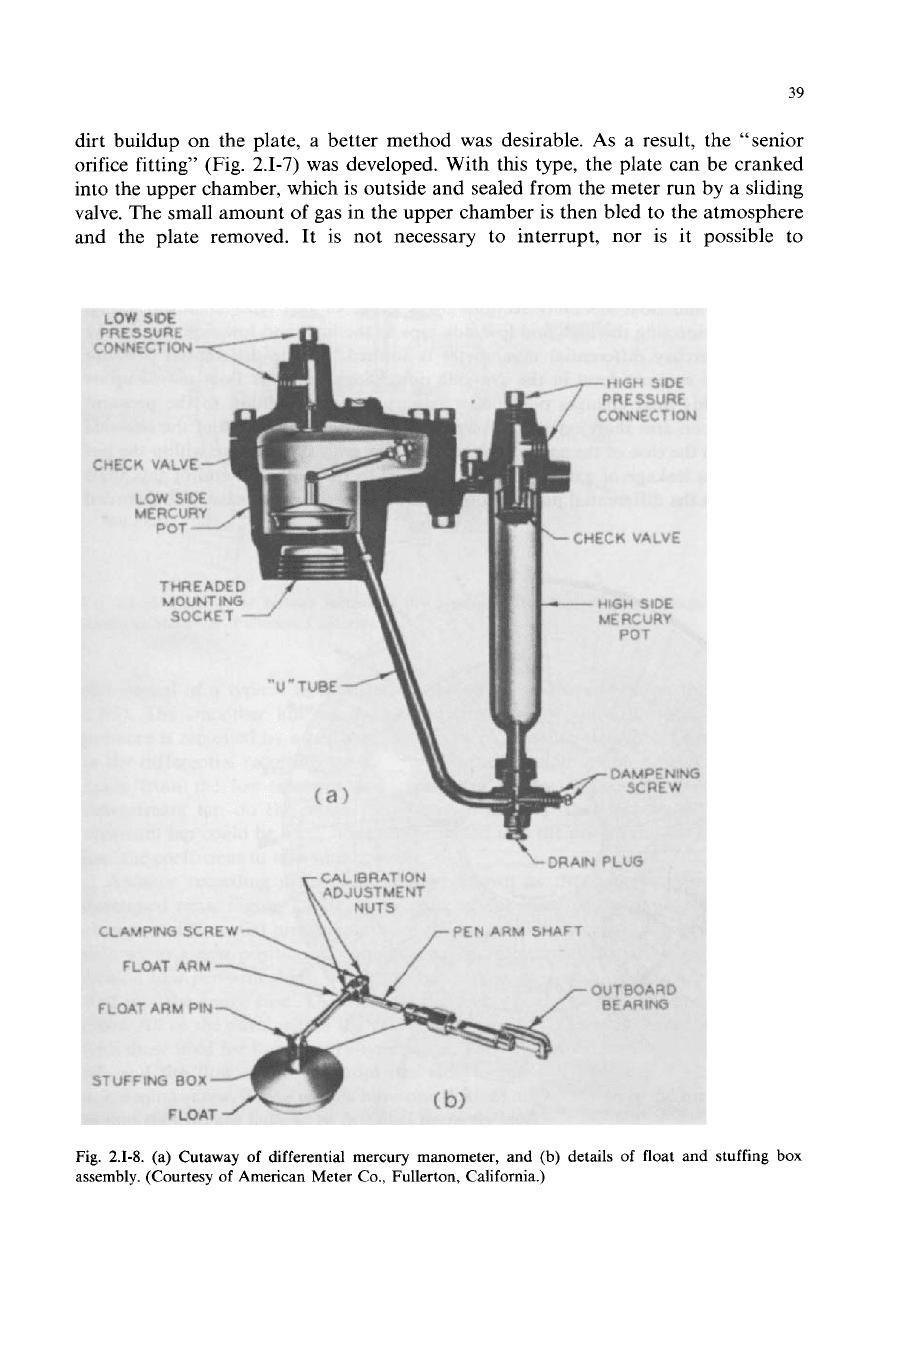
Fig.
2.1-8.
(a) Cutaway of differential mercury manometer, and (b) details
of
float and stuffing box
assembly. (Courtesy
of
American Meter
Co.,
Fullerton, California.)
40
accidentally interrupt, the flow.
A
solid by-pass is not required and usually
considerable time is saved
on
each inspection.
So
far, the two variables which are necessary for determining measurement have
only been shown
as
instantaneous readings
on
a water column. For the purposes of
measurement, it is necessary that these be recorded
so
that the calculated volumes
may be computed. The first method of doing this was the development of the
mercury manometer into a recording differential gauge.
A
cutaway view of the
manometer and float assembly sections for a gauge of this type
is
shown in Fig.
2.1-8.
By
connecting the high and low side taps to the high and low side pots in the
gauge, a mercury differential manometer is formed.
As
the differential pressure
changes, the mercury level in the low-side pot changes and the float moves up or
down.
As
this float changes position, it imparts a rotary motion to the pen-arm
shaft. This pen-arm shaft extends through a stuffing box in the wall of the low-side
pot and into the case of the gauge. The stuffing box seals the pressure within the pot
and prevents leakage of gas.
A
pen arm fastened to the outboard end of this shaft
then records the differential pressure
on
a chart within the gauge case. The recorded
I
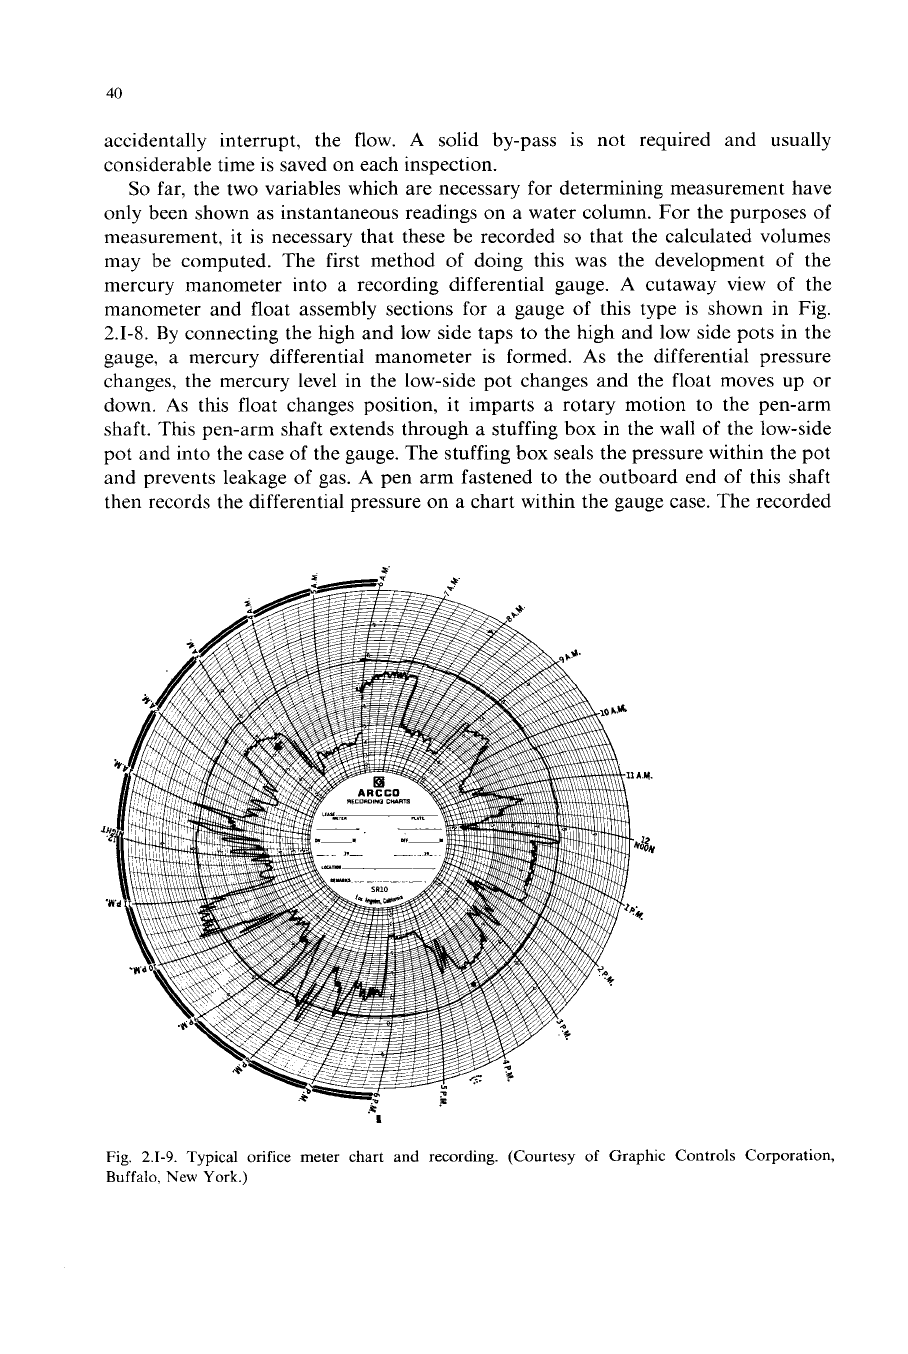
Fig.
2.1-9.
Typical orifice meter chart and recording. (Courtesy of Graphic Controls Corporation,
Buffalo.
New
York.)
41
CENTER
ROD
LEVER
__
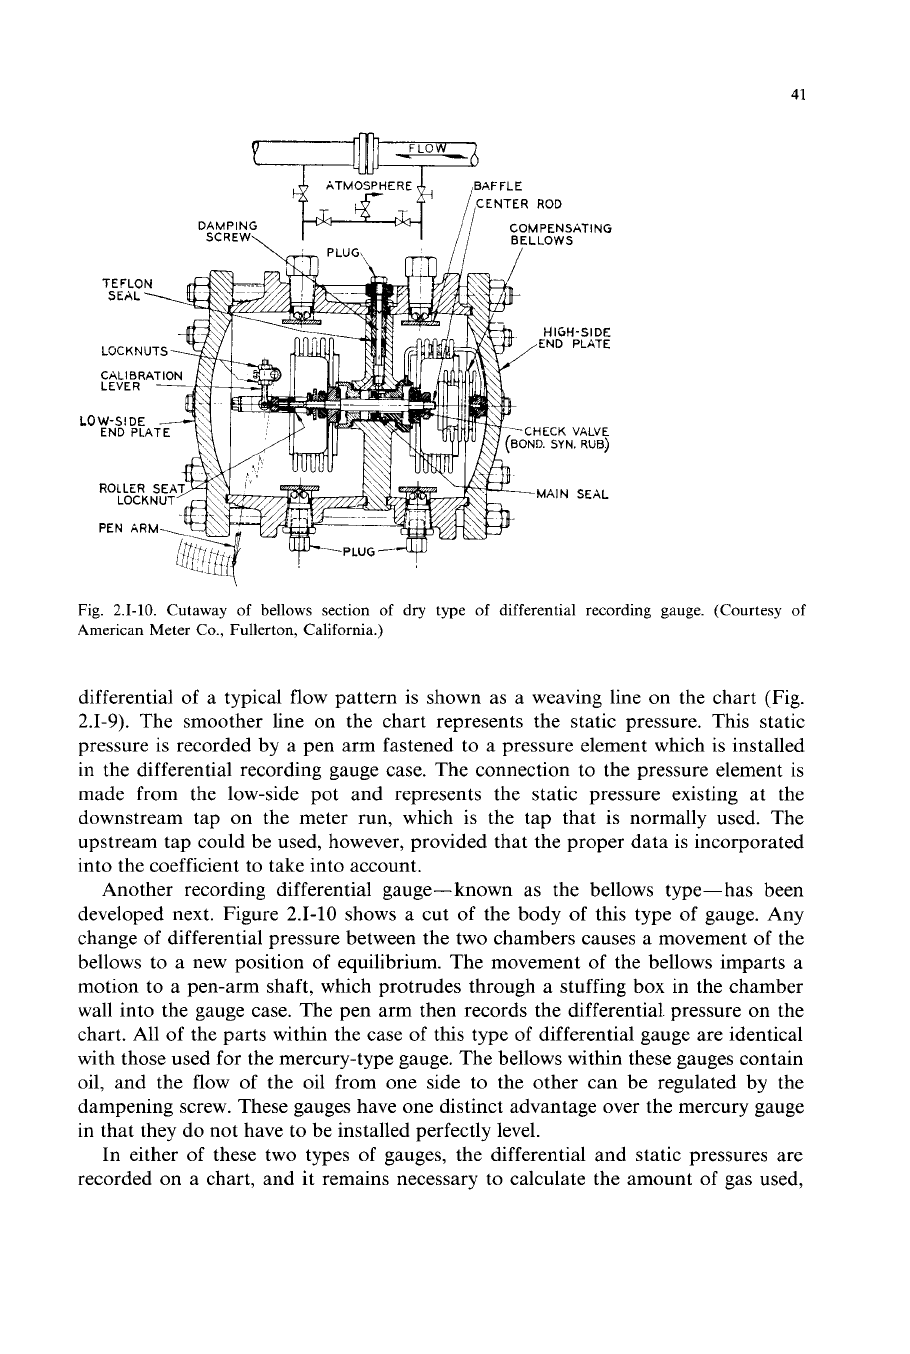
Fig.
2.1-10.
Cutaway of bellows section of dry type of differential recording gauge. (Courtesy of
American Meter Co., Fullerton, California.)
differential of a typical flow pattern is shown as a weaving line on the chart (Fig.
2.1-9).
The smoother line on the chart represents the static pressure. This static
pressure is recorded by a pen arm fastened to a pressure element which is installed
in the differential recording gauge case. The connection to the pressure element is
made from the low-side pot and represents the static pressure existing at the
downstream tap on the meter run, which
is
the tap that is normally used. The
upstream tap could be used, however, provided that the proper data is incorporated
into the coefficient to take into account.
Another recording differential gauge-known as the bellows type- has been
developed next. Figure 2.1-10 shows a cut of the body of this type of gauge. Any
change of differential pressure between the two chambers causes a movement of the
bellows to a new position of equilibrium. The movement of the bellows imparts a
motion to a pen-arm shaft, which protrudes through a stuffing box in the chamber
wall into the gauge case. The pen arm then records the differential pressure on the
chart. All of the parts within the case of this type of differential gauge are identical
with those used for the mercury-type gauge. The bellows within these gauges contain
oil, and the flow of the oil from one side to the other can be regulated by the
dampening screw. These gauges have one distinct advantage over the mercury gauge
in that they do not have to be installed perfectly level.
In either of these two types of gauges, the differential and static pressures are
recorded
on
a chart, and it remains necessary to calculate the amount of gas used,
42
from the chart. The chart (Fig.
2.1-9)
is
divided by a scale that runs from
“0”
at the
center to
“lo”
at the outer edge, and
it
is a square-root scale. Therefore, a flow
change of one chart unit is equal to about in. of pen travel
on
the chart between
2
and
3,
and the same rate of flow change is equal to almost an inch of pen travel on
the chart between
9
and
10.
One can readily see that the accuracy of recording and
calculation from the chart is greatly reduced at the very low ranges. For meters
where the flow drops below
3
on the chart for any appreciable amount
of
time, a
second recording differential gauge can be set in parallel with the standard (whch is
probably a 50-in. or 100-in. gauge), where the differential at
10
on the chart is equal
to
50
in. or 100 in. of water.
Ths
second gauge, known as a 10-in. because the
differential at
10
on the chart
is
equal to 10 in.
of
water, actually enlarges the
portion of the 50-in. or 100-in. chart between
“0”
and approximately
“4”
to the full
scale.
This is done by using a different set of mercury pots,
or a different
arrangement with the linkage,
so
that a given displacement of mercury, or a given
linkage movement, causes a much greater movement of the recording pen. Where
square-root charts are used, the charts would be identical on both gauges, but
different coefficients would be used, which would take into consideration the
difference in the manner in which the flow is indicated
on
the charts.
If
the rate of flow for a given meter increases to where the differential pen travels
off the upper limit
of
the chart, a large orifice plate would then be installed in the
meter
so
that the reading would again be recorded on the chart. The coefficient
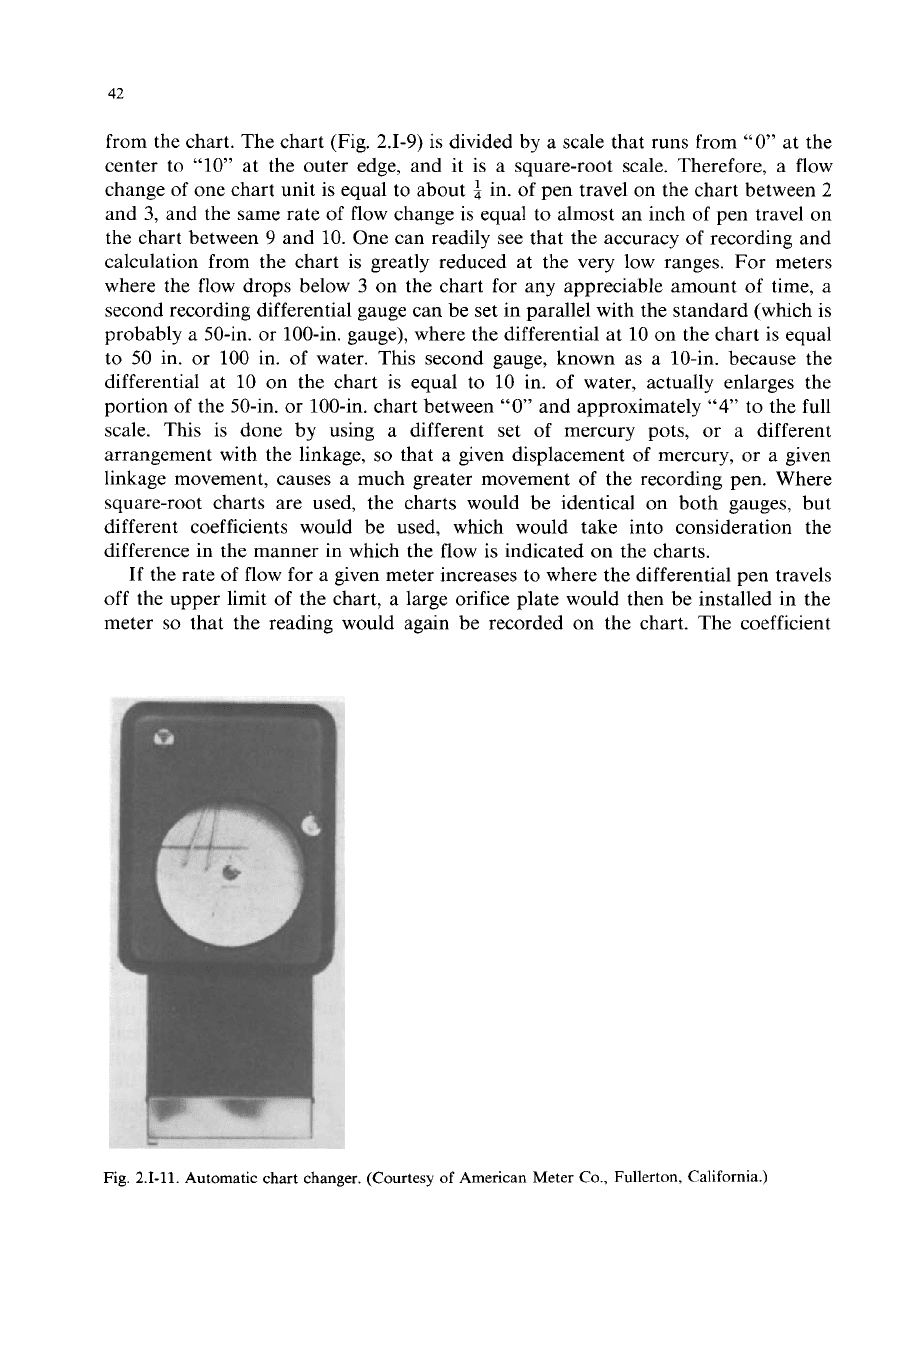
Fig.
2.1-11.
Automatic chart changer. (Courtesy
of
American Meter
Co.,
Fullerton, California.)
43
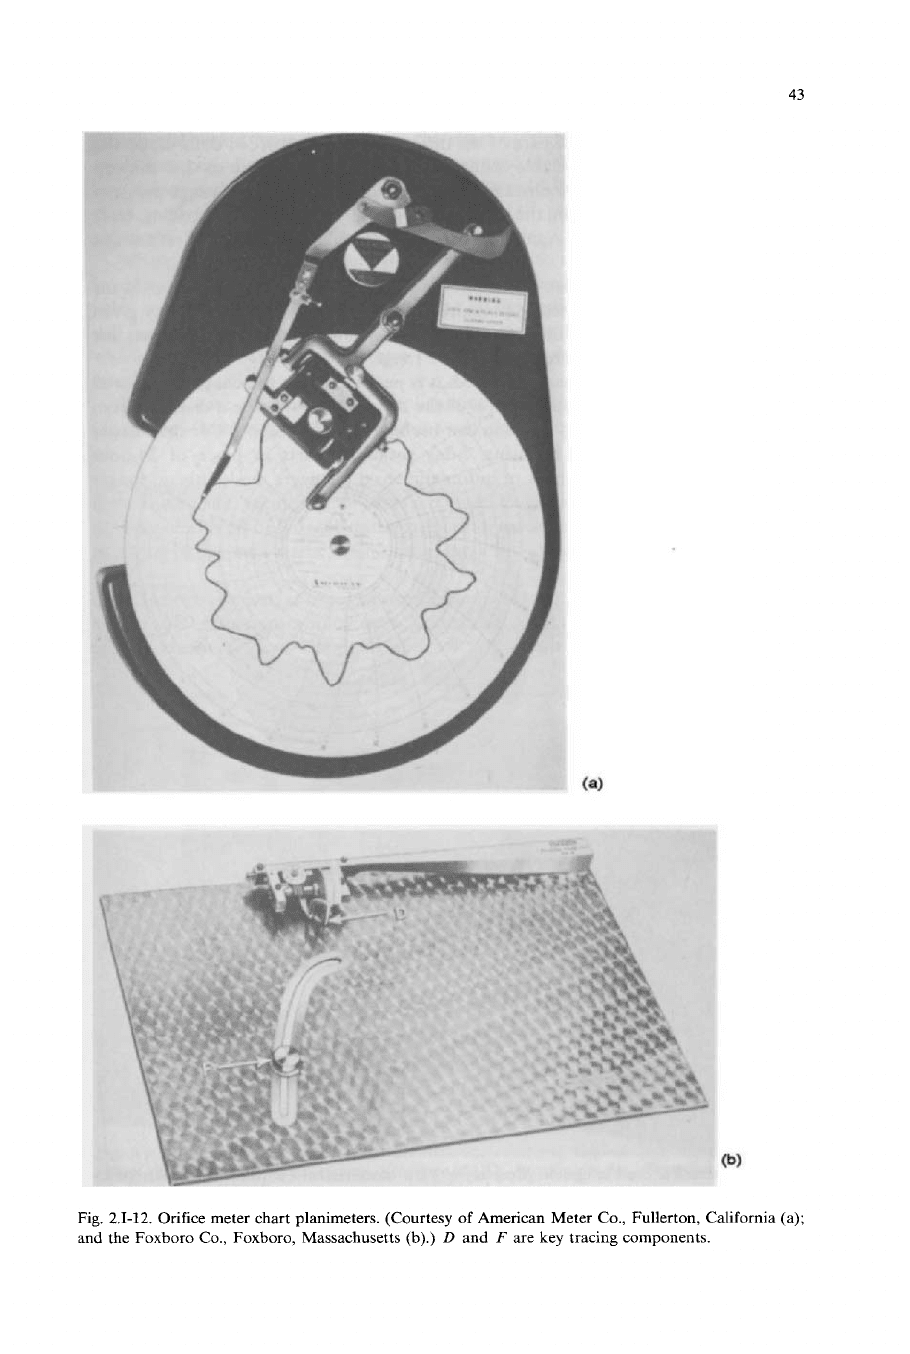
Fig.
2.1-12.
Orifice meter chart planimeters. (Courtesy
of
American Meter
Co.,
Fullerton, California
(a);
and the Foxboro
Co.,
Foxboro, Massachusetts (b).)
D
and
F are key tracing components.
44
would then be changed to take care of the difference in the recorded data. If,
on
the
other hand, there is an appreciable change in the metering pressure
so
that the pen
actuated by the static pressure element ranges off the chart, a higher range pressure
element would be installed
in
the differential gauge to bring the recording back
within the range of the chart. Again, the coefficient would be changed to reflect this
change in recording.
In
other words, where square-root charts are used, the same chart can be used for
all the different ranges of metering pressures and
flow
rates possible with any given
meter. This is not true for direct reading gauges, whch require special charts for
each different static and differential pressure range.
Once the recording has been completed, it is necessary that the chart be removed
and a new one installed.
As
the location of the meters may be quite a distance from
the office, this chart-changing function can become quite expensive. For this reason
accuracy often is sacrificed by using 7-day rotation charts in place of 24-hour
rotation charts. The development of automatic chart changers made this
no
longer
necessary for they allow loading
of
several charts at one time. The charts then
change automatically and thus, seven 24-hour rotation charts can be picked up with
a trip to the meter once a week. One type of automatic chart changer is shown in
Fig.
2.1-11.
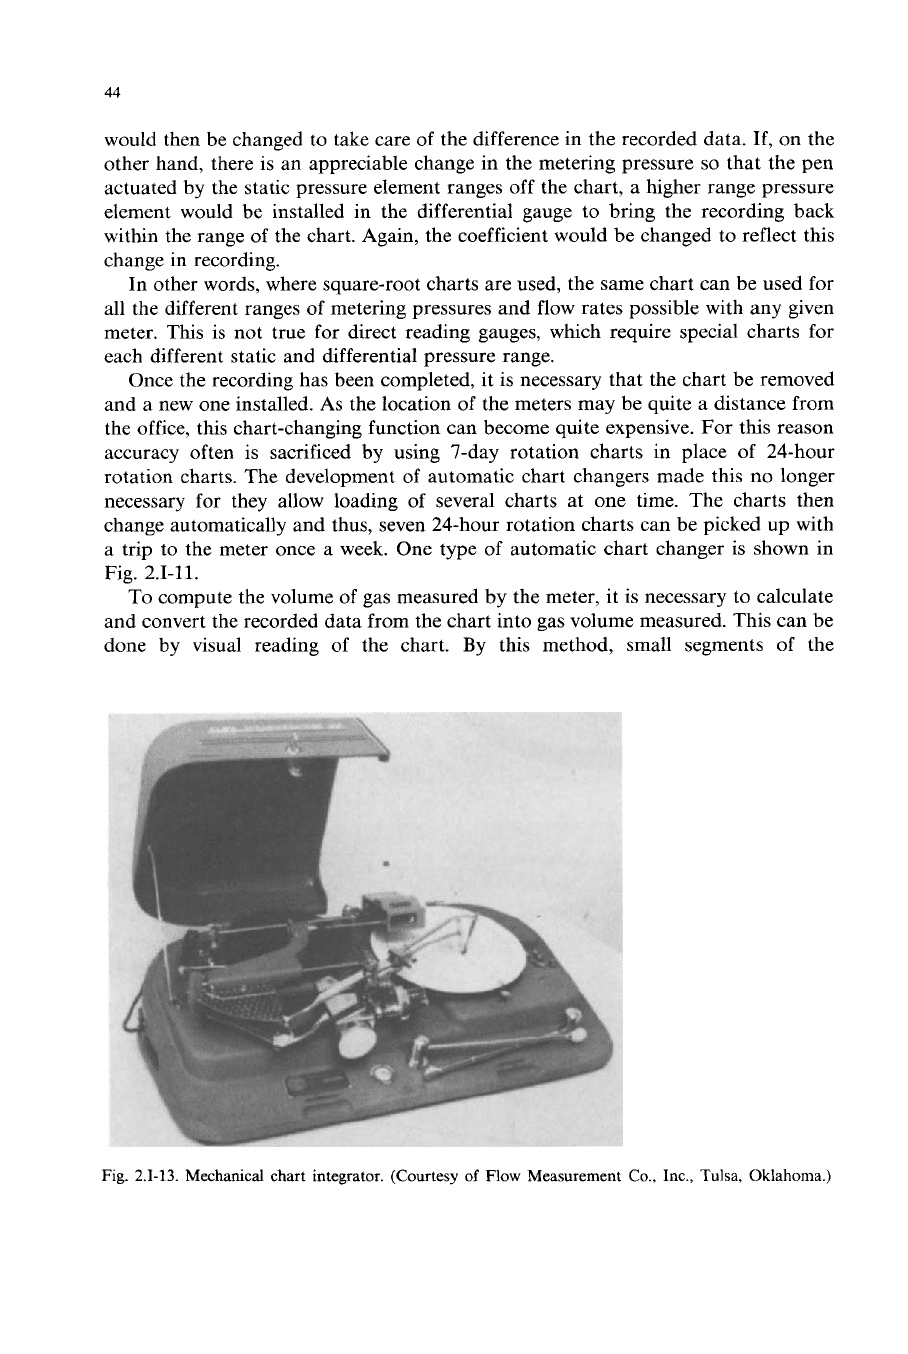
To compute the volume of gas measured by the meter, it
is
necessary to calculate
and convert the recorded data from the chart into gas volume measured. This can be
done by visual reading of the chart.
By
this method, small segments of the
Fig.
2.1-13.
Mechanical chart integrator. (Courtesy
of
Flow
Measurement Co., Inc.,
Tulsa,
Oklahoma.)