Brealey, Myers. Principles of Corporate Finance. 7th edition
Подождите немного. Документ загружается.


Brealey−Meyers:
Principles of Corporate
Finance, Seventh Edition
II. Risk 8. Risk and Return
© The McGraw−Hill
Companies, 2003
CHAPTER 8 Risk and Return 217
dex. The index has an expected return of 14 percent, and its standard deviation is 16
percent.
a. Suppose Percival puts all his money in a combination of the index fund and
Treasury bills. Can he thereby improve his expected rate of return without
changing the risk of his portfolio? The Treasury bill yield is 6 percent.
b. Could Percival do even better by investing equal amounts in the corporate bond
portfolio and the index fund? The correlation between the bond portfolio and the
index fund is ⫹.1.
11. “There may be some truth in these CAPM and APT theories, but last year some stocks
did much better than these theories predicted, and other stocks did much worse.” Is this
a valid criticism?
12. True or false?
a. Stocks of small companies have done better than predicted by the CAPM.
b. Stocks with high ratios of book value to market price have done better than
predicted by the CAPM.
c. On average, stock returns have been positively related to beta.
13. Some true or false questions about the APT:
a. The APT factors cannot reflect diversifiable risks.
b. The market rate of return cannot be an APT factor.
c. Each APT factor must have a positive risk premium associated with it; otherwise
the model is inconsistent.
d. There is no theory that specifically identifies the APT factors.
e. The APT model could be true but not very useful, for example, if the relevant
factors change unpredictably.
14. Consider the following simplified APT model (compare Tables 8.3 and 8.4):
Expected Risk
Factor Premium
Market 6.4%
Interest rate ⫺.6
Yield spread 5.1
Factor Risk Exposures
Market Interest Rate Yield Spread
Stock (b
1
)(b
2
)(b
3
)
P 1.0 ⫺2.0 ⫺.2
P
2
1.2 0 .3
P
3
.3 .5 1.0
Visit us at www.mhhe.com/bm7e
Calculate the expected return for the following stocks. Assume r
f
⫽ 5 percent.
15. Look again at Practice Question 14. Consider a portfolio with equal investments in
stocks P, P
2
, and P
3
.
a. What are the factor risk exposures for the portfolio?
b. What is the portfolio’s expected return?
16. The following table shows the sensitivity of four stocks to the three Fama–French fac-
tors in the five years to 2001. Estimate the expected return on each stock assuming that
the interest rate is 3.5 percent, the expected risk premium on the market is 8.8 percent,
EXCEL

Brealey−Meyers:
Principles of Corporate
Finance, Seventh Edition
II. Risk 8. Risk and Return
© The McGraw−Hill
Companies, 2003
218 PART II Risk
1. In footnote 4 we noted that the minimum-risk portfolio contained an investment of
21.4 percent in Reebok and 78.6 in Coca-Cola. Prove it. Hint: You need a little calcu-
lus to do so.
2. Look again at the set of efficient portfolios that we calculated in Section 8.1.
a. If the interest rate is 10 percent, which of the four efficient portfolios should
you hold?
b. What is the beta of each holding relative to that portfolio? Hint: Remember that if a
portfolio is efficient, the expected risk premium on each holding must be
proportional to the beta of the stock relative to that portfolio.
c. How would your answers to (a) and (b) change if the interest rate was 5 percent?
3. “Suppose you could forecast the behavior of APT factors, such as industrial production,
interest rates, etc. You could then identify stocks’ sensitivities to these factors, pick the
right stocks, and make lots of money.” Is this a good argument favoring the APT? Ex-
plain why or why not.
4. The following question illustrates the APT. Imagine that there are only two pervasive
macroeconomic factors. Investments X, Y, and Z have the following sensitivities to these
two factors:
Factor Sensitivities
Factor Coca-Cola Exxon Mobil Pfizer Reebok
Market .82 .50 .66 1.17
Size* ⫺.29 .04 ⫺.56 .73
Book-to-market
†
.24 .27 ⫺.07 1.14
*Return on small-firm stocks less return on large-firm stocks.
†
Return on high book-to-market-ratio stocks less return on low book-to-market-ratio stocks.
CHALLENGE
QUESTIONS
Visit us at www.mhhe.com/bm7e
Investment b
1
b
2
X 1.75 .25
Y ⫺1.00 2.00
Z 2.00 1.00
We assume that the expected risk premium is 4 percent on factor 1 and 8 percent on fac-
tor 2. Treasury bills obviously offer zero risk premium.
a. According to the APT, what is the risk premium on each of the three stocks?
b. Suppose you buy $200 of X and $50 of Y and sell $150 of Z. What is the
sensitivity of your portfolio to each of the two factors? What is the expected
risk premium?
c. Suppose you buy $80 of X and $60 of Y and sell $40 of Z. What is the
sensitivity of your portfolio to each of the two factors? What is the expected risk
premium?
the expected risk premium on the size factor is 3.1 percent, and the expected risk pre-
mium on the book-to-market factor is 4.4 percent. (These were the realized premia from
1928–2000.)

Brealey−Meyers:
Principles of Corporate
Finance, Seventh Edition
II. Risk 8. Risk and Return
© The McGraw−Hill
Companies, 2003
Visit us at www.mhhe.com/bm7e
d. Finally, suppose you buy $160 of X and $20 of Y and sell $80 of Z. What is your
portfolio’s sensitivity now to each of the two factors? And what is the expected risk
premium?
e. Suggest two possible ways that you could construct a fund that has a sensitivity
of .5 to factor 1 only. Now compare the risk premiums on each of these two
investments.
f. Suppose that the APT did not hold and that X offered a risk premium of 8 percent,
Y offered a premium of 14 percent, and Z offered a premium of 16 percent. Devise
an investment that has zero sensitivity to each factor and that has a positive risk
premium.
CHAPTER 8 Risk and Return 219

Brealey−Meyers:
Principles of Corporate
Finance, Seventh Edition
II. Risk 9. Capital Budgeting and
Risk
© The McGraw−Hill
Companies, 2003
CHAPTER NINE
220
C A P I T A L
BUDGETING
AND RISK

Brealey−Meyers:
Principles of Corporate
Finance, Seventh Edition
II. Risk 9. Capital Budgeting and
Risk
© The McGraw−Hill
Companies, 2003
LONG BEFORE THE development of modern theories linking risk and expected return, smart financial
managers adjusted for risk in capital budgeting. They realized intuitively that, other things being
equal, risky projects are less desirable than safe ones. Therefore, financial managers demanded a
higher rate of return from risky projects, or they based their decisions on conservative estimates of
the cash flows.
Various rules of thumb are often used to make these risk adjustments. For example, many com-
panies estimate the rate of return required by investors in their securities and then use this company
cost of capital to discount the cash flows on new projects. Our first task in this chapter is to explain
when the company cost of capital can, and cannot, be used to discount a project’s cash flows. We
shall see that it is the right hurdle rate for those projects that have the same risk as the firm’s exist-
ing business; however, if a project is more risky than the firm as a whole, the cost of capital needs to
be adjusted upward and the project’s cash flows discounted at this higher rate. Conversely, a lower
discount rate is needed for projects that are safer than the firm as a whole.
The capital asset pricing model is widely used to estimate the return that investors require.
1
It
states
We used this formula in the last chapter to figure out the return that investors expected from a sam-
ple of common stocks but we did not explain how to estimate beta. It turns out that we can gain some
insight into beta by looking at how the stock price has responded in the past to market fluctuations.
Beta is difficult to measure accurately for an individual firm: Greater accuracy can be achieved by
looking at an average of similar companies. We will also look at what features make some investments
riskier than others. If you know why Exxon Mobil has less risk than, say, Dell Computer, you will be in
a better position to judge the relative risks of different capital investment opportunities.
Some companies are financed entirely by common stock. In these cases the company cost of cap-
ital and the expected return on the stock are the same thing. However, most firms finance themselves
partly by debt and the return that they earn on their investments must be sufficient to satisfy both
the stockholders and the debtholders. We will show you how to calculate the company cost of capi-
tal when the firm has more than one type of security outstanding.
There is still another complication: Project betas can shift over time. Some projects are safer in
youth than in old age; others are riskier. In this case, what do we mean by the project beta? There
may be a separate beta for each year of the project’s life. To put it another way, can we jump from
the capital asset pricing model, which looks one period into the future, to the discounted-cash-flow
formula for valuing long-lived assets? Most of the time it is safe to do so, but you should be able to
recognize and deal with the exceptions.
We will use the capital asset pricing model, or CAPM, throughout this chapter. But don’t infer that
it is therefore the last word on risk and return. The principles and procedures covered in this chapter
work just as well with other models such as arbitrage pricing theory (APT).
Expected return ⫽ r ⫽ r
f
⫹ 1beta2 1r
m
⫺ r
f
2
221
1
In a survey of financial practice, Graham and Harvey found that 74 percent of firms always, or almost always, used the capital as-
set pricing model to estimate the cost of capital. See J. Graham and C. Harvey, “The Theory and Practice of Corporate Finance: Ev-
idence from the Field,” Journal of Financial Economics 60 (May/June 2001), pp. 187–244.

Brealey−Meyers:
Principles of Corporate
Finance, Seventh Edition
II. Risk 9. Capital Budgeting and
Risk
© The McGraw−Hill
Companies, 2003
The company cost of capital is defined as the expected return on a portfolio of all
the company’s existing securities. It is used to discount the cash flows on projects
that have similar risk to that of the firm as a whole. For example, in Table 8.2 we
estimated that investors require a return of 9.2 percent from Pfizer common stock.
If Pfizer is contemplating an expansion of the firm’s existing business, it would
make sense to discount the forecasted cash flows at 9.2 percent.
2
The company cost of capital is not the correct discount rate if the new projects
are more or less risky than the firm’s existing business. Each project should in prin-
ciple be evaluated at its own opportunity cost of capital. This is a clear implication
of the value-additivity principle introduced in Chapter 7. For a firm composed of
assets A and B, the firm value is
Here PV(A) and PV(B) are valued just as if they were mini-firms in which stock-
holders could invest directly. Investors would value A by discounting its fore-
casted cash flows at a rate reflecting the risk of A. They would value B by dis-
counting at a rate reflecting the risk of B. The two discount rates will, in general, be
different. If the present value of an asset depended on the identity of the company
that bought it, present values would not add up. Remember, a good project is a
good project is a good project.
If the firm considers investing in a third project C, it should also value C as if C
were a mini-firm. That is, the firm should discount the cash flows of C at the ex-
pected rate of return that investors would demand to make a separate investment
in C. The true cost of capital depends on the use to which that capital is put.
This means that Pfizer should accept any project that more than compensates for
the project’s beta. In other words, Pfizer should accept any project lying above the
upward-sloping line that links expected return to risk in Figure 9.1. If the project
has a high risk, Pfizer needs a higher prospective return than if the project has a
low risk. Now contrast this with the company cost of capital rule, which is to ac-
cept any project regardless of its risk as long as it offers a higher return than the com-
pany’s cost of capital. In terms of Figure 9.1, the rule tells Pfizer to accept any proj-
ect above the horizontal cost of capital line, that is, any project offering a return of
more than 9.2 percent.
It is clearly silly to suggest that Pfizer should demand the same rate of return
from a very safe project as from a very risky one. If Pfizer used the company cost
of capital rule, it would reject many good low-risk projects and accept many poor
high-risk projects. It is also silly to suggest that just because another company has
a low company cost of capital, it is justified in accepting projects that Pfizer
would reject.
The notion that each company has some individual discount rate or cost of cap-
ital is widespread, but far from universal. Many firms require different returns
⫽ sum of separate asset values
Firm value ⫽ PV1AB2⫽ PV1A2⫹ PV1B2
222 PART II
Risk
9.1 COMPANY AND PROJECT COSTS OF CAPITAL
2
Debt accounted for only about 0.3 percent of the total market value of Pfizer’s securities. Thus, its cost
of capital is effectively identical to the rate of return investors expect on its common stock. The compli-
cations caused by debt are discussed later in this chapter.

Brealey−Meyers:
Principles of Corporate
Finance, Seventh Edition
II. Risk 9. Capital Budgeting and
Risk
© The McGraw−Hill
Companies, 2003
from different categories of investment. For example, discount rates might be set
as follows:
CHAPTER 9
Capital Budgeting and Risk 223
Project beta
Company cost of capital
Security market line showing
required return on project
Average
beta of the firm's assets = .71
r
(required return)
3.5
9.2
FIGURE 9.1
A comparison between the
company cost of capital
rule and the required return
under the capital asset
pricing model. Pfizer’s
company cost of capital is
about 9.2 percent. This is
the correct discount rate
only if the project beta is
.71. In general, the correct
discount rate increases as
project beta increases.
Pfizer should accept
projects with rates of return
above the security market
line relating required return
to beta.
Category Discount Rate
Speculative ventures 30%
New products 20
Expansion of existing business 15 (company cost of capital)
Cost improvement, known technology 10
Perfect Pitch and the Cost of Capital
The true cost of capital depends on project risk, not on the company undertaking
the project. So why is so much time spent estimating the company cost of capital?
There are two reasons. First, many (maybe, most) projects can be treated as av-
erage risk, that is, no more or less risky than the average of the company’s other as-
sets. For these projects the company cost of capital is the right discount rate. Sec-
ond, the company cost of capital is a useful starting point for setting discount rates
for unusually risky or safe projects. It is easier to add to, or subtract from, the com-
pany cost of capital than to estimate each project’s cost of capital from scratch.
There is a good musical analogy here.
3
Most of us, lacking perfect pitch, need a
well-defined reference point, like middle C, before we can sing on key. But anyone
who can carry a tune gets relative pitches right. Businesspeople have good intuition
about relative risks, at least in industries they are used to, but not about absolute
risk or required rates of return. Therefore, they set a companywide cost of capital
as a benchmark. This is not the right hurdle rate for everything the company does,
but adjustments can be made for more or less risky ventures.
3
The analogy is borrowed from S. C. Myers and L. S. Borucki, “Discounted Cash Flow Estimates of
the Cost of Equity Capital—A Case Study,” Financial Markets, Institutions, and Investments 3 (August
1994), p. 18.

Brealey−Meyers:
Principles of Corporate
Finance, Seventh Edition
II. Risk 9. Capital Budgeting and
Risk
© The McGraw−Hill
Companies, 2003
Suppose that you are considering an across-the-board expansion by your firm. Such
an investment would have about the same degree of risk as the existing business.
Therefore you should discount the projected flows at the company cost of capital.
Companies generally start by estimating the return that investors require from
the company’s common stock. In Chapter 8 we used the capital asset pricing model
to do this. This states
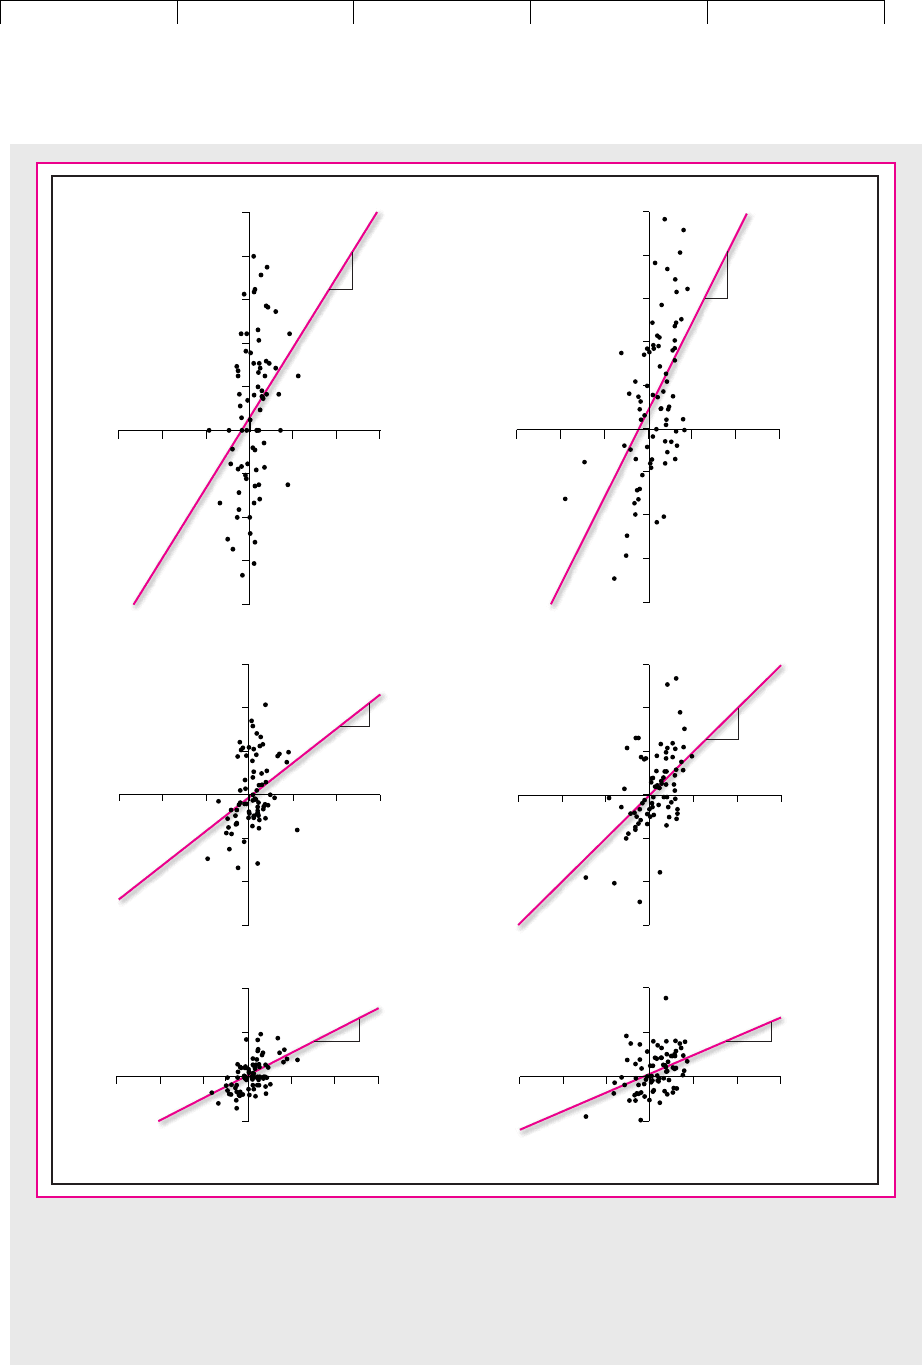
An obvious way to measure the beta () of a stock is to look at how its price has re-
sponded in the past to market movements. For example, look at the three left-hand
scatter diagrams in Figure 9.2. In the top-left diagram we have calculated monthly re-
turns from Dell Computer stock in the period after it went public in 1988, and we have
plotted these returns against the market returns for the same month. The second dia-
gram on the left shows a similar plot for the returns on General Motors stock, and the
third shows a plot for Exxon Mobil. In each case we have fitted a line through the
points. The slope of this line is an estimate of beta.
4
It tells us how much on average
the stock price changed for each additional 1 percent change in the market index.
The right-hand diagrams show similar plots for the same three stocks during the
subsequent period, February 1995 to July 2001. Although the slopes varied from the
first period to the second, there is little doubt that Exxon Mobil’s beta is much less
than Dell’s or that GM’s beta falls somewhere between the two. If you had used the
past beta of each stock to predict its future beta, you wouldn’t have been too far off.
Only a small portion of each stock’s total risk comes from movements in the mar-
ket. The rest is unique risk, which shows up in the scatter of points around the fitted
lines in Figure 9.2. R-squared (R
2
) measures the proportion of the total variance in the
stock’s returns that can be explained by market movements. For example, from 1995
to 2001, the R
2
for GM was .25. In other words, a quarter of GM’s risk was market risk
and three-quarters was unique risk. The variance of the returns on GM stock was 964.
5
So we could say that the variance in stock returns that was due to the market was
and the variance of unique returns was
The estimates of beta shown in Figure 9.2 are just that. They are based on the
stocks’ returns in 78 particular months. The noise in the returns can obscure the true
beta. Therefore, statisticians calculate the standard error of the estimated beta to show
the extent of possible mismeasurement. Then they set up a confidence interval of the
estimated value plus or minus two standard errors. For example, the standard error
of GM’s estimated beta in the most recent period is .20. Thus the confidence interval
for GM’s beta is 1.00 plus or minus 2 ⫻ .20. If you state that the true beta for GM is
between .60 and 1.40, you have a 95 percent chance of being right. Notice that we can
be more confident of our estimate of Exxon Mobil’s beta and less confident of Dell’s.
Usually you will have more information (and thus more confidence) than this
simple calculation suggests. For example, you know that Exxon Mobil’s estimated
.75 ⫻ 964 ⫽ 723..25 ⫻ 964 ⫽ 241,
Expected stock return ⫽ r
f
⫹1r
m
⫺ r
f
2
224 PART II Risk
9.2 MEASURING THE COST OF EQUITY
4
Notice that you must regress the returns on the stock on the market returns. You would get a very sim-
ilar estimate if you simply used the percentage changes in the stock price and the market index. But
sometimes analysts make the mistake of regressing the stock price level on the level of the index and ob-
tain nonsense results.
5
This is an annual figure; we annualized the monthly variance by multiplying by 12 (see footnote 17 in
Chapter 7). The standard deviation was percent.2964 ⫽ 31.0
Brealey−Meyers:
Principles of Corporate
Finance, Seventh Edition
II. Risk 9. Capital Budgeting and
Risk
© The McGraw−Hill
Companies, 2003
-10-20-30 0 10 20 30
-30
-40
-20
-10
0
10
20
30
40
50
-30 -20 -10 0 10 20 30
-40
-30
-20
-10
0
10
20
30
40
50
-30 -20 -10 0 10 20 30
-30
-20
-10
0
10
20
30
-30 -20 -10 0 10 20 30
-30
-20
-10
0
10
20
30
-30 -20 -10 0 10 20 30
-10
0
10
20
-30 -20 -10 0 10 20 30
-10
0
10
20
Dell Computer
return %
August 1988–
January 1995
β = 1.62
(.52)
R
2
= .11
Dell Computer
return %
February 1995–
July 2001
Market return, % Market return, %
β = 2.02
(.38)
R
2
= .27
August 1988–
January 1995
Market return, % Market return, %
General Motors
return %
β = .8
(.24)
R
2
= .13
February 1995–
July 2001
General Motors
return %
β = 1.00
(.20)
R
2
= .25
February 1995–
July 2001
Exxon Mobil
return %
August 1988–
January 1995
Market return, % Market return, %
β = .52
(.10)
R
2
= .28
Exxon Mobil
return %
β = .42
(.11)
R
2
= .16
FIGURE 9.2
We have used past returns to estimate the betas of three stocks for the periods August 1988 to January 1995 (left-
hand diagrams) and February 1995 to July 2001 (right-hand diagrams). Beta is the slope of the fitted line. Notice that
in both periods Dell had the highest beta and Exxon Mobil the lowest. Standard errors are in parentheses below the
betas. The standard error shows the range of possible error in the beta estimate. We also report the proportion of
total risk that is due to market movements (R
2
).
225

Brealey−Meyers:
Principles of Corporate
Finance, Seventh Edition
II. Risk 9. Capital Budgeting and
Risk
© The McGraw−Hill
Companies, 2003
beta was well below 1 in the previous period, while Dell’s estimated beta was well
above 1. Nevertheless, there is always a large margin for error when estimating the
beta for individual stocks.
Fortunately, the estimation errors tend to cancel out when you estimate betas of
portfolios.
6
That is why financial managers often turn to industry betas. For example,
Table 9.1 shows estimates of beta and the standard errors of these estimates for the
common stocks of four large railroad companies. Most of the standard errors are
above .2, large enough to preclude a precise estimate of any particular utility’s beta.
However, the table also shows the estimated beta for a portfolio of all four railroad
stocks. Notice that the estimated industry beta is more reliable. This shows up in
the lower standard error.
The Expected Return on Union Pacific Corporation’s Common Stock
Suppose that in mid-2001 you had been asked to estimate the company cost of cap-
ital of Union Pacific Corporation. Table 9.1 provides two clues about the true beta
of Union Pacific’s stock: the direct estimate of .40 and the average estimate for the
industry of .50. We will use the industry average of .50.
7
In mid-2001 the risk-free rate of interest r
f
was about 3.5 percent. Therefore, if
you had used 8 percent for the risk premium on the market, you would have con-
cluded that the expected return on Union Pacific’s stock was about 7.5 percent:
8
226 PART II Risk
Standard

equity
Error
Burlington Northern & Santa Fe .64 .20
CSX Transportation .46 .24
Norfolk Southern .52 .26
Union Pacific Corp. .40 .21
Industry portfolio .50 .17
TABLE 9.1
Estimated betas and costs of (equity) capital for a
sample of large railroad companies and for a
portfolio of these companies. The precision of the
portfolio beta is much better than that of the
betas of the individual companies—note the lower
standard error for the portfolio.
6
If the observations are independent, the standard error of the estimated mean beta declines in propor-
tion to the square root of the number of stocks in the portfolio.
7
Comparing the beta of Union Pacific with those of the other railroads would be misleading if Union
Pacific had a materially higher or lower debt ratio. Fortunately, its debt ratio was about average for the
sample in Table 9.1.
8
This is really a discount rate for near-term cash flows, since it rests on a risk-free rate measured by the
yield on Treasury bills with maturities less than one year. Is this, you may ask, the right discount rate
for cash flows from an asset with, say, a 10- or 20-year expected life?
Well, now that you mention it, possibly not. In 2001 longer-term Treasury bonds yielded about
5.8 percent, that is, about 2.3 percent above the Treasury bill rate.
The risk-free rate could be defined as a long-term Treasury bond yield. If you do this, however,
you should subtract the risk premium of Treasury bonds over bills, which we gave as 1.8 percent in
Table 7.1. This gives a rough-and-ready estimate of the expected yield on short-term Treasury bills
over the life of the bond:
The expected average future Treasury bill rate should be used in the CAPM if a discount rate is
needed for an extended stream of cash flows. In 2001 this “long-term r
f
” was a bit higher than the
Treasury bill rate.
⫽ .058 ⫺ .019 ⫽ .039, or 3.9%
Expected average T-bill rate ⫽ T-bond yield ⫺ premium of bonds over bills