Brealey, Myers. Principles of Corporate Finance. 7th edition
Подождите немного. Документ загружается.


Brealey−Meyers:
Principles of Corporate
Finance, Seventh Edition
II. Risk 8. Risk and Return
© The McGraw−Hill
Companies, 2003
IN CHAPTER 7 we began to come to grips with the problem of measuring risk. Here is the story so far.
The stock market is risky because there is a spread of possible outcomes. The usual measure
of this spread is the standard deviation or variance. The risk of any stock can be broken down into
two parts. There is the unique risk that is peculiar to that stock, and there is the market risk that
is associated with marketwide variations. Investors can eliminate unique risk by holding a well-
diversified portfolio, but they cannot eliminate market risk. All the risk of a fully diversified port-
folio is market risk.
A stock’s contribution to the risk of a fully diversified portfolio depends on its sensitivity to mar-
ket changes. This sensitivity is generally known as beta. A security with a beta of 1.0 has average
market risk—a well-diversified portfolio of such securities has the same standard deviation as the
market index. A security with a beta of .5 has below-average market risk—a well-diversified port-
folio of these securities tends to move half as far as the market moves and has half the market’s
standard deviation.
In this chapter we build on this newfound knowledge. We present leading theories linking risk and
return in a competitive economy, and we show how these theories can be used to estimate the re-
turns required by investors in different stock market investments. We start with the most widely used
theory, the capital asset pricing model, which builds directly on the ideas developed in the last chap-
ter. We will also look at another class of models, known as arbitrage pricing or factor models. Then
in Chapter 9 we show how these ideas can help the financial manager cope with risk in practical cap-
ital budgeting situations.
187
Most of the ideas in Chapter 7 date back to an article written in 1952 by Harry
Markowitz.
1
Markowitz drew attention to the common practice of portfolio diver-
sification and showed exactly how an investor can reduce the standard deviation
of portfolio returns by choosing stocks that do not move exactly together. But
Markowitz did not stop there; he went on to work out the basic principles of port-
folio construction. These principles are the foundation for much of what has been
written about the relationship between risk and return.
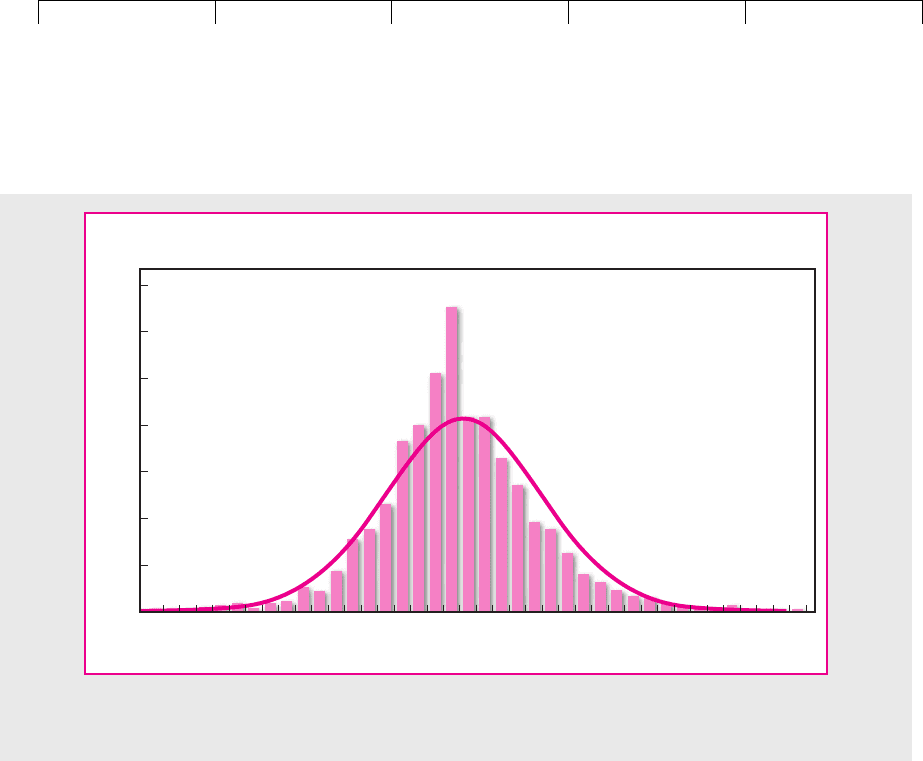
We begin with Figure 8.1, which shows a histogram of the daily returns on Mi-
crosoft stock from 1990 to 2001. On this histogram we have superimposed a bell-
shaped normal distribution. The result is typical: When measured over some
fairly short interval, the past rates of return on any stock conform closely to a nor-
mal distribution.
2
Normal distributions can be completely defined by two numbers. One is the av-
erage or expected return; the other is the variance or standard deviation. Now you
can see why in Chapter 7 we discussed the calculation of expected return and stan-
dard deviation. They are not just arbitrary measures: If returns are normally dis-
tributed, they are the only two measures that an investor need consider.
8.1 HARRY MARKOWITZ AND THE BIRTH
OF PORTFOLIO THEORY
1
H. M. Markowitz, “Portfolio Selection,” Journal of Finance 7 (March 1952), pp. 77–91.
2
If you were to measure returns over long intervals, the distribution would be skewed. For example, you
would encounter returns greater than 100 percent but none less than ⫺100 percent. The distribution of re-
turns over periods of, say, one year would be better approximated by a lognormal distribution. The log-
normal distribution, like the normal, is completely specified by its mean and standard deviation.
Brealey−Meyers:
Principles of Corporate
Finance, Seventh Edition
II. Risk 8. Risk and Return
© The McGraw−Hill
Companies, 2003
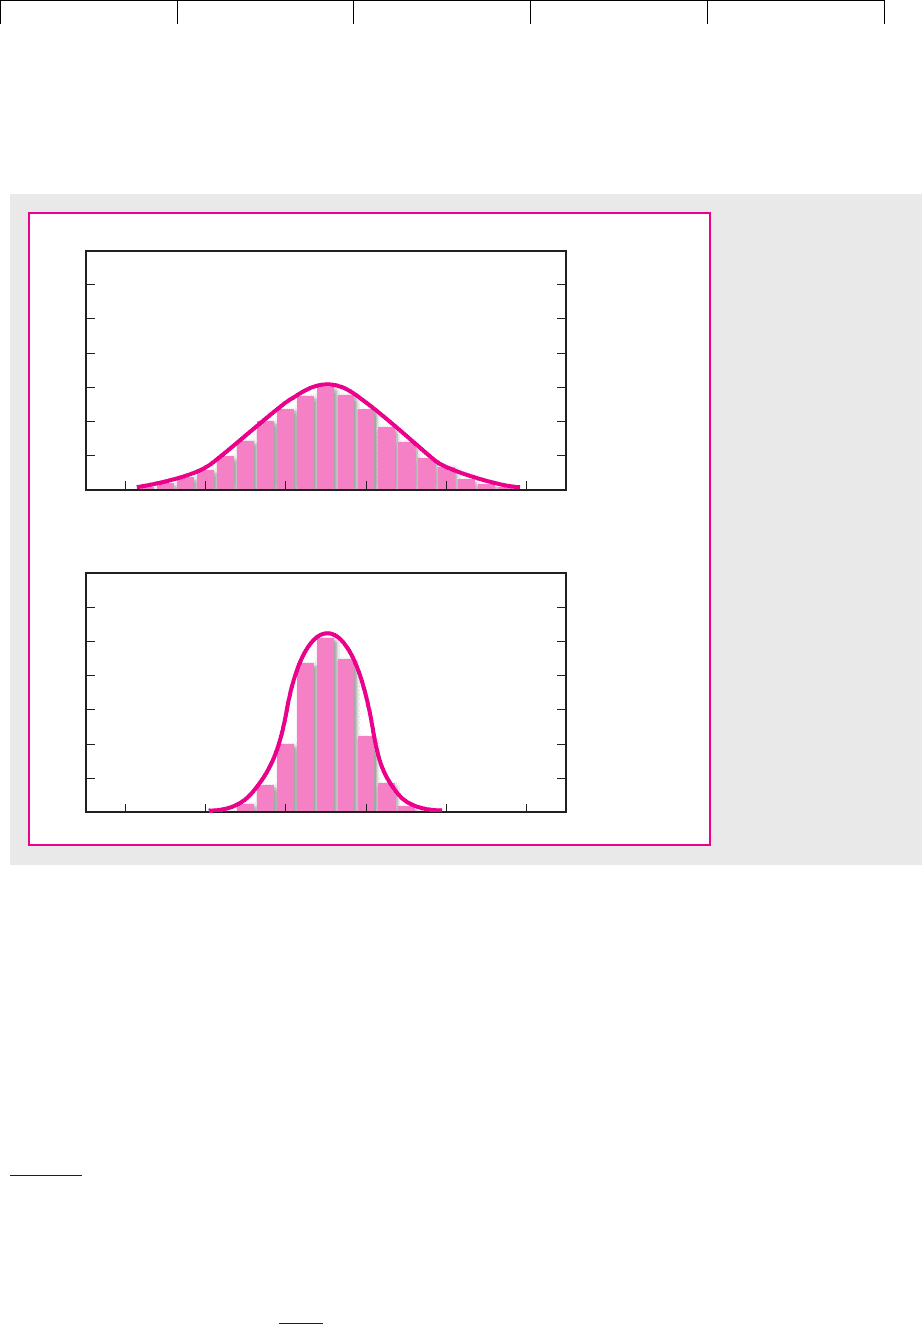
Figure 8.2 pictures the distribution of possible returns from two investments.
Both offer an expected return of 10 percent, but A has much the wider spread of
possible outcomes. Its standard deviation is 15 percent; the standard deviation
of B is 7.5 percent. Most investors dislike uncertainty and would therefore pre-
fer B to A.
Figure 8.3 pictures the distribution of returns from two other investments. This
time both have the same standard deviation, but the expected return is 20 percent
from stock C and only 10 percent from stock D. Most investors like high expected
return and would therefore prefer C to D.
Combining Stocks into Portfolios
Suppose that you are wondering whether to invest in shares of Coca-Cola or
Reebok. You decide that Reebok offers an expected return of 20 percent and Coca-
Cola offers an expected return of 10 percent. After looking back at the past vari-
ability of the two stocks, you also decide that the standard deviation of returns is
31.5 percent for Coca-Cola and 58.5 percent for Reebok. Reebok offers the higher
expected return, but it is considerably more risky.
Now there is no reason to restrict yourself to holding only one stock. For exam-
ple, in Section 7.3 we analyzed what would happen if you invested 65 percent of
your money in Coca-Cola and 35 percent in Reebok. The expected return on this
portfolio is 13.5 percent, which is simply a weighted average of the expected re-
turns on the two holdings. What about the risk of such a portfolio? We know that
thanks to diversification the portfolio risk is less than the average of the risks of the
188 PART II
Risk
0.00
0.02
Proportion
of days
0.04
0.06
0.08
0.10
0.12
0.14
–9 –6 –3 0 3 6 9
Daily price changes, percent
FIGURE 8.1
Daily price changes for Microsoft are approximately normally distributed. This plot spans 1990 to 2001.
Brealey−Meyers:
Principles of Corporate
Finance, Seventh Edition
II. Risk 8. Risk and Return
© The McGraw−Hill
Companies, 2003
separate stocks. In fact, on the basis of past experience the standard deviation of
this portfolio is 31.7 percent.
3
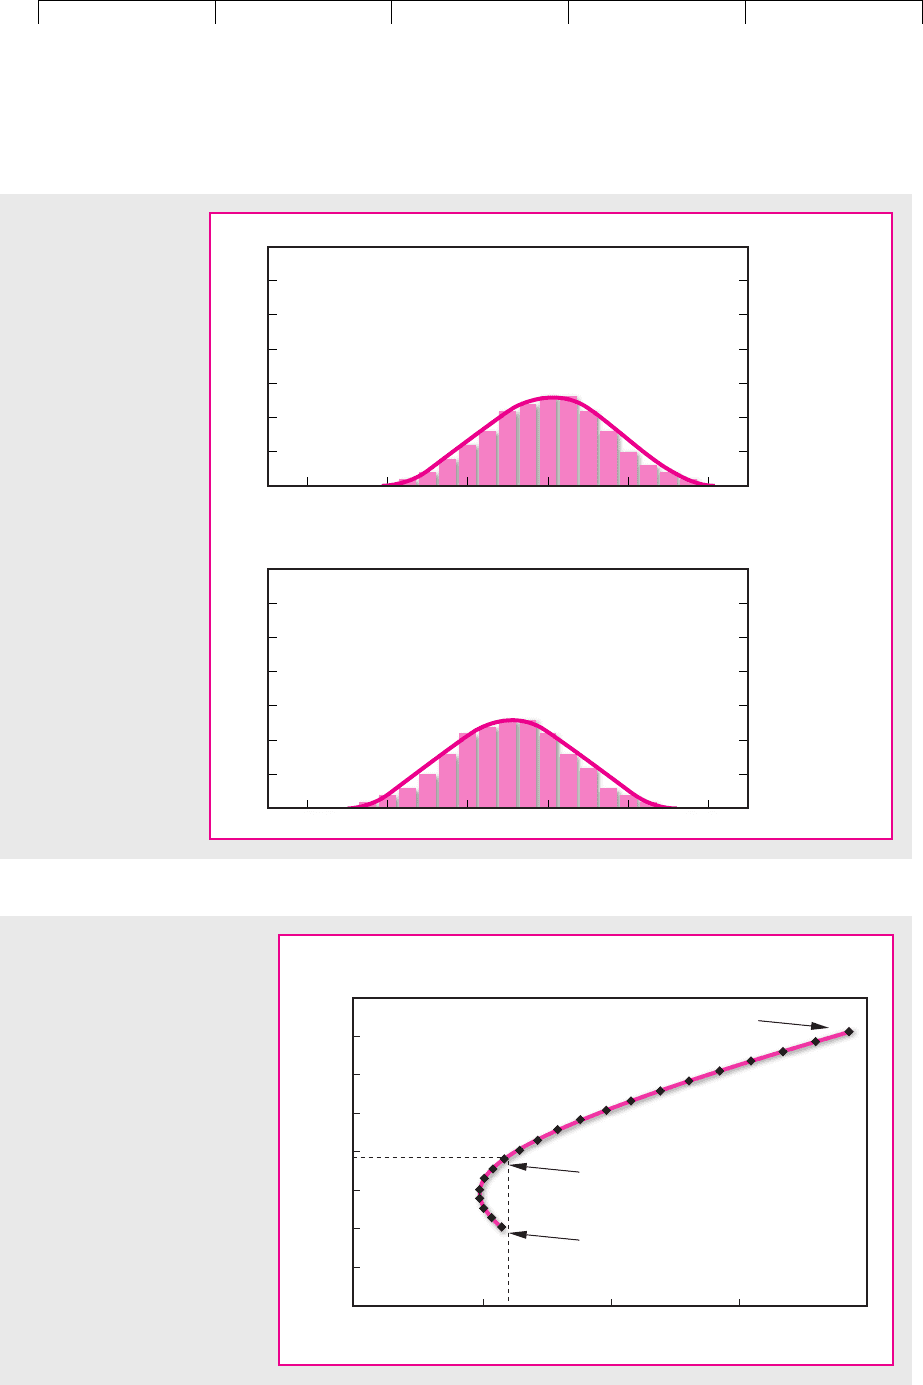
In Figure 8.4 we have plotted the expected return and risk that you could
achieve by different combinations of the two stocks. Which of these combinations
is best? That depends on your stomach. If you want to stake all on getting rich
quickly, you will do best to put all your money in Reebok. If you want a more
peaceful life, you should invest most of your money in Coca-Cola; to minimize risk
you should keep a small investment in Reebok.
4
In practice, you are not limited to investing in only two stocks. Our next task,
therefore, is to find a way to identify the best portfolios of 10, 100, or 1,000 stocks.
CHAPTER 8
Risk and Return 189
Return, percent
Investment B
Return, percent
–40 –20 0 20 40 60
Probability
Probability
Investment A
–40 –20 0 20 40 60
FIGURE 8.2
These two investments
both have an expected
return of 10 percent but
because investment A
has the greater spread
of possible returns, it is
more risky than B. We
can measure this spread
by the standard
deviation. Investment A
has a standard deviation
of 15 percent; B, 7.5
percent. Most investors
would prefer B to A.
3
We pointed out in Section 7.3 that the correlation between the returns of Coca-Cola and Reebok has
been about .2. The variance of a portfolio which is invested 65 percent in Coca-Cola and 35 percent in
Reebok is
The portfolio standard deviation is
4
The portfolio with the minimum risk has 21.4 percent in Reebok. We assume in Figure 8.4 that you may
not take negative positions in either stock, i.e., we rule out short sales.
21006.1 ⫽ 31.7 percent.
⫽ 1006.1
⫽ 31.652
2
⫻ 131.52
2
4⫹ 31.352
2
⫻ 158.52
2
4 ⫹ 21.65 ⫻ .35 ⫻ .2 ⫻ 31.5 ⫻ 58.52
Variance ⫽ x
1
2
1
2
⫹ x
2
2
2
2
⫹ 2x
1
x
2
12
1
2
Brealey−Meyers:
Principles of Corporate
Finance, Seventh Edition
II. Risk 8. Risk and Return
© The McGraw−Hill
Companies, 2003
190 PART II Risk
Return, percent
Investment D
Return, percent
–40 –20 0 20 40 60
Probability
Probability
Investment C
–40 –20 0 20 40 60
FIGURE 8.3
The standard deviation
of possible returns is 15
percent for both these
investments, but the
expected return from C
is 20 percent compared
with an expected return
from D of only 10
percent. Most investors
would prefer C to D.
20
8
10
12
14
16
18
20
22
30 40 50 60
Reebok
35 percent in Reebok
Coca-Cola
Standard deviation (σ), percent
Expected return
(
r
), percent
FIGURE 8.4
The curved line illustrates how
expected return and standard
deviation change as you hold
different combinations of two
stocks. For example, if you invest
35 percent of your money in
Reebok and the remainder in
Coca-Cola, your expected return
is 13.5 percent, which is 35
percent of the way between the
expected returns on the two
stocks. The standard deviation is
31.7 percent, which is less than
35 percent of the way between
the standard deviations on the
two stocks. This is because diver-
sification reduces risk.

Brealey−Meyers:
Principles of Corporate
Finance, Seventh Edition
II. Risk 8. Risk and Return
© The McGraw−Hill
Companies, 2003
We’ll start with 10. Suppose that you can choose a portfolio from any of the
stocks listed in the first column of Table 8.1. After analyzing the prospects for each
firm, you come up with the return forecasts shown in the second column of the
table. You use data for the past five years to estimate the risk of each stock (column
3) and the correlation between the returns on each pair of stocks.
5
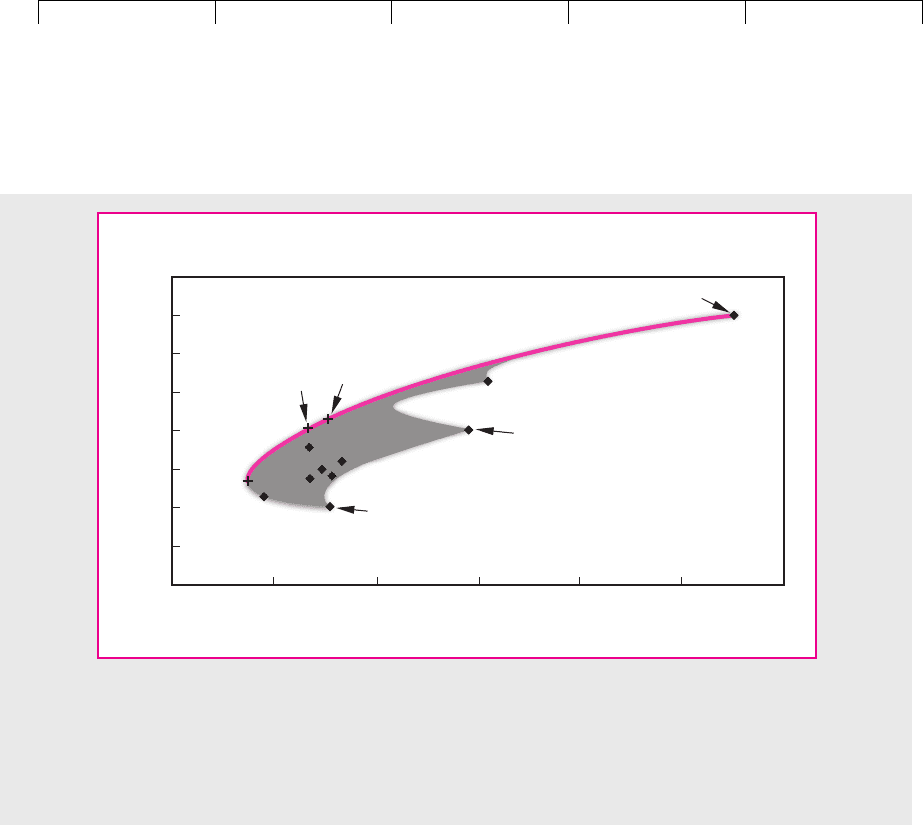
Now turn to Figure 8.5. Each diamond marks the combination of risk and return
offered by a different individual security. For example, Amazon.com has the high-
est standard deviation; it also offers the highest expected return. It is represented
by the diamond at the upper right of Figure 8.5.
By mixing investment in individual securities, you can obtain an even wider selec-
tion of risk and return: in fact, anywhere in the shaded area in Figure 8.5. But where in
the shaded area is best? Well, what is your goal? Which direction do you want to go?
The answer should be obvious: You want to go up (to increase expected return) and to
the left (to reduce risk). Go as far as you can, and you will end up with one of the port-
folios that lies along the heavy solid line. Markowitz called them efficient portfolios.
These portfolios are clearly better than any in the interior of the shaded area.
We will not calculate this set of efficient portfolios here, but you may be interested
in how to do it. Think back to the capital rationing problem in Section 5.4. There we
wanted to deploy a limited amount of capital investment in a mixture of projects to
give the highest total NPV. Here we want to deploy an investor’s funds to give the
highest expected return for a given standard deviation. In principle, both problems
can be solved by hunting and pecking—but only in principle. To solve the capital
CHAPTER 8
Risk and Return 191
5
There are 90 correlation coefficients, so we have not listed them in Table 8.1.
Efficient Portfolios—Percentages
Allocated to Each Stock
Expected Standard
Return Deviation A B C D
Amazon.com 34.6% 110.6% 100 9.3 4.5
Boeing 13.0 30.9 2.1 9.6 0.6
Coca-Cola 10.0 31.5 0.4
Dell Computer 26.2 62.7 21.1 14.4
Exxon Mobil 11.8 17.4 3.6 56.3
General Electric 18.0 26.8 46.8 39.7 10.2
General Motors 15.8 33.4 9
McDonald’s 14.0 27.4 5.4 10
Pfizer 14.8 29.3 9.8 13.3
Reebok 20.0 58.5 20.7 13.0
Expected portfolio return 34.6 21.6 19.0 13.4
Portfolio standard deviation 110.6 30.8 23.7 14.6
TABLE 8.1
Examples of efficient portfolios chosen from 10 stocks.
Note: Standard deviations and the correlations between stock returns were estimated from monthly stock returns, August
1996–July 2001. Efficient portfolios are calculated assuming that short sales are prohibited.
Brealey−Meyers:
Principles of Corporate
Finance, Seventh Edition
II. Risk 8. Risk and Return
© The McGraw−Hill
Companies, 2003
rationing problem, we can employ linear programming; to solve the portfolio prob-
lem, we would turn to a variant of linear programming known as quadratic program-
ming. Given the expected return and standard deviation for each stock, as well as the
correlation between each pair of stocks, we could give a computer a standard qua-
dratic program and tell it to calculate the set of efficient portfolios.
Four of these efficient portfolios are marked in Figure 8.5. Their compositions
are summarized in Table 8.1. Portfolio A offers the highest expected return; A is in-
vested entirely in one stock, Amazon.com. Portfolio D offers the minimum risk;
you can see from Table 8.1 that it has a large holding in Exxon Mobil, which has
had the lowest standard deviation. Notice that D has only a small holding in Boe-
ing and Coca-Cola but a much larger one in stocks such as General Motors, even
though Boeing and Coca-Cola are individually of similar risk. The reason? On past
evidence the fortunes of Boeing and Coca-Cola are more highly correlated with
those of the other stocks in the portfolio and therefore provide less diversification.
Table 8.1 also shows the compositions of two other efficient portfolios B and C
with intermediate levels of risk and expected return.
We Introduce Borrowing and Lending
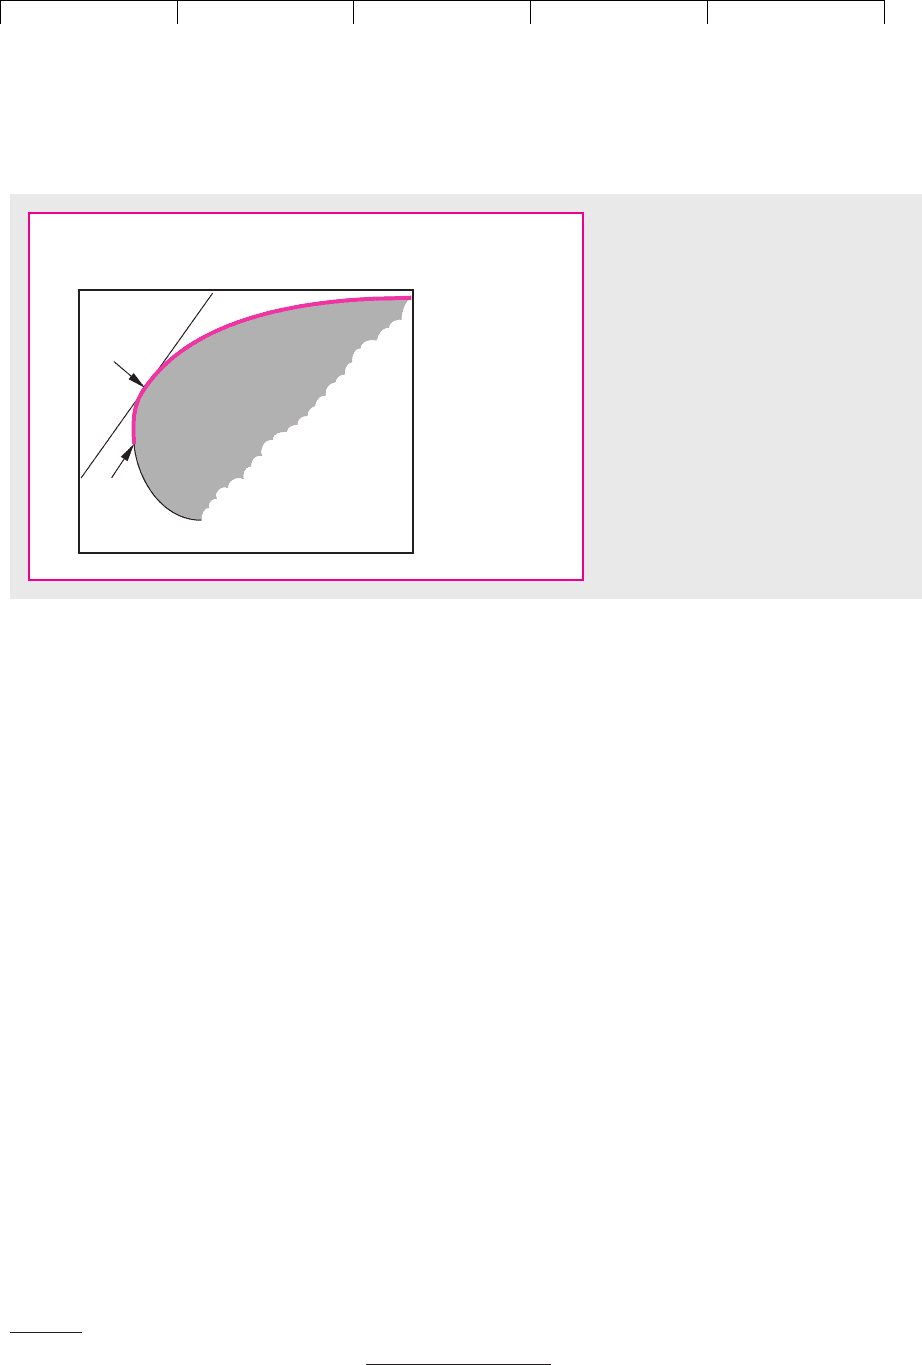
Of course, large investment funds can choose from thousands of stocks and
thereby achieve a wider choice of risk and return. This choice is represented in Fig-
ure 8.6 by the shaded, broken-egg-shaped area. The set of efficient portfolios is
again marked by the heavy curved line.
192 PART II
Risk
0
5
10
15
20
25
30
35
40
20 40 60
80 100 120
Reebok
Coca-Cola
Standard deviation (σ), percent
Expected return
(
r
), percent
A
B
C
D
FIGURE 8.5
Each diamond shows the expected return and standard deviation of one of the 10 stocks in Table
8.1. The shaded area shows the possible combinations of expected return and standard deviation
from investing in a mixture of these stocks. If you like high expected returns and dislike high
standard deviations, you will prefer portfolios along the heavy line. These are efficient portfolios.
We have marked the four efficient portfolios described in Table 8.1 (A, B, C, and D).
Brealey−Meyers:
Principles of Corporate
Finance, Seventh Edition
II. Risk 8. Risk and Return
© The McGraw−Hill
Companies, 2003
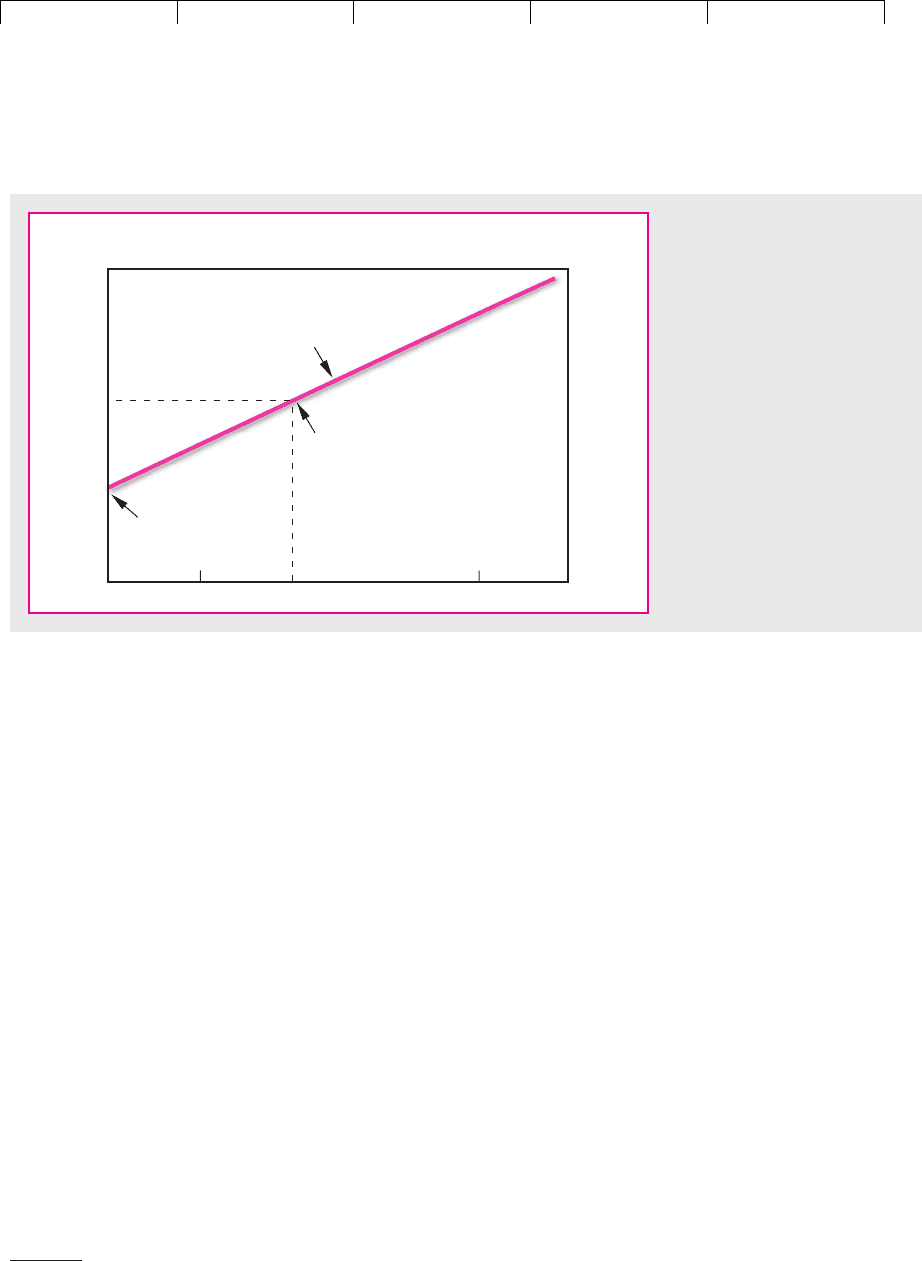
Now we introduce yet another possibility. Suppose that you can also lend and
borrow money at some risk-free rate of interest r
f
. If you invest some of your money
in Treasury bills (i.e., lend money) and place the remainder in common stock portfo-
lio S, you can obtain any combination of expected return and risk along the straight
line joining r
f
and S in Figure 8.6.
6
Since borrowing is merely negative lending, you
can extend the range of possibilities to the right of S by borrowing funds at an inter-
est rate of r
f
and investing them as well as your own money in portfolio S.
Let us put some numbers on this. Suppose that portfolio S has an expected re-
turn of 15 percent and a standard deviation of 16 percent. Treasury bills offer an in-
terest rate (r
f
) of 5 percent and are risk-free (i.e., their standard deviation is zero). If
you invest half your money in portfolio S and lend the remainder at 5 percent, the
expected return on your investment is halfway between the expected return on S
and the interest rate on Treasury bills:
And the standard deviation is halfway between the standard deviation of S and the
standard deviation of Treasury bills:
Or suppose that you decide to go for the big time: You borrow at the Treasury
bill rate an amount equal to your initial wealth, and you invest everything in port-
folio S. You have twice your own money invested in S, but you have to pay interest
on the loan. Therefore your expected return is
⫽ 25%
r ⫽ 12 ⫻
expected return on S2⫺ 11 ⫻ interest rate2
⫽ 8%
⫽ 1
1
冫
2
⫻ standard deviation of S2⫹ 1
1
冫
2
⫻ standard deviation of bills2
⫽ 10%
r ⫽ 1
1
冫
2
⫻ expected return on S2⫹ 1
1
冫
2
⫻ interest rate2
CHAPTER 8
Risk and Return 193
r
f
Expected
return (
r
),
percent
Standard deviation
( ), percent
S
T
Borrowing
Lending
σ
FIGURE 8.6
Lending and borrowing extend the range
of investment possibilities. If you invest
in portfolio S and lend or borrow at the
risk-free interest rate, r
f
, you can achieve
any point along the straight line from r
f
through S. This gives you a higher
expected return for any level of risk than
if you just invest in common stocks.
6
If you want to check this, write down the formula for the standard deviation of a two-stock portfolio:
Now see what happens when security 2 is riskless, i.e., when
2
⫽ 0.
Standard deviation ⫽ 2x
1
2
1
2
⫹ x
2
2
2
2
⫹ 2x
1
x
2
12
1
2

Brealey−Meyers:
Principles of Corporate
Finance, Seventh Edition
II. Risk 8. Risk and Return
© The McGraw−Hill
Companies, 2003
And the standard deviation of your investment is
You can see from Figure 8.6 that when you lend a portion of your money, you end
up partway between r
f
and S; if you can borrow money at the risk-free rate, you
can extend your possibilities beyond S. You can also see that regardless of the level
of risk you choose, you can get the highest expected return by a mixture of portfo-
lio S and borrowing or lending. S is the best efficient portfolio. There is no reason
ever to hold, say, portfolio T.
If you have a graph of efficient portfolios, as in Figure 8.6, finding this best effi-
cient portfolio is easy. Start on the vertical axis at r
f
and draw the steepest line you
can to the curved heavy line of efficient portfolios. That line will be tangent to the
heavy line. The efficient portfolio at the tangency point is better than all the others.
Notice that it offers the highest ratio of risk premium to standard deviation.
This means that we can separate the investor’s job into two stages. First, the best
portfolio of common stocks must be selected—S in our example.
7
Second, this port-
folio must be blended with borrowing or lending to obtain an exposure to risk that
suits the particular investor’s taste. Each investor, therefore, should put money
into just two benchmark investments—a risky portfolio S and a risk-free loan (bor-
rowing or lending).
8
What does portfolio S look like? If you have better information than your rivals,
you will want the portfolio to include relatively large investments in the stocks you
think are undervalued. But in a competitive market you are unlikely to have a mo-
nopoly of good ideas. In that case there is no reason to hold a different portfolio of
common stocks from anybody else. In other words, you might just as well hold the
market portfolio. That is why many professional investors invest in a market-
index portfolio and why most others hold well-diversified portfolios.
⫽ 32%
⫽ 12
⫻ standard deviation of S2⫺ 11 ⫻ standard deviation of bills2
194 PART II Risk
7
Portfolio S is the point of tangency to the set of efficient portfolios. It offers the highest expected risk
premium (r ⫺ r
f
) per unit of standard deviation ().
8
This separation theorem was first pointed out by J. Tobin in “Liquidity Preference as Behavior toward
Risk,” Review of Economic Studies 25 (February 1958), pp. 65–86.
8.2 THE RELATIONSHIP BETWEEN RISK AND RETURN
In Chapter 7 we looked at the returns on selected investments. The least risky in-
vestment was U.S. Treasury bills. Since the return on Treasury bills is fixed, it is un-
affected by what happens to the market. In other words, Treasury bills have a beta
of 0. We also considered a much riskier investment, the market portfolio of com-
mon stocks. This has average market risk: Its beta is 1.0.
Wise investors don’t take risks just for fun. They are playing with real money.
Therefore, they require a higher return from the market portfolio than from Trea-
sury bills. The difference between the return on the market and the interest rate is
termed the market risk premium. Over a period of 75 years the market risk premium
(r
m
⫺ r
f
) has averaged about 9 percent a year.
In Figure 8.7 we have plotted the risk and expected return from Treasury bills
and the market portfolio. You can see that Treasury bills have a beta of 0 and a risk
Brealey−Meyers:
Principles of Corporate
Finance, Seventh Edition
II. Risk 8. Risk and Return
© The McGraw−Hill
Companies, 2003
premium of 0.
9
The market portfolio has a beta of 1.0 and a risk premium of
r
m
⫺ r
f
. This gives us two benchmarks for the expected risk premium. But what is
the expected risk premium when beta is not 0 or 1?
In the mid-1960s three economists—William Sharpe, John Lintner, and Jack
Treynor—produced an answer to this question.
10
Their answer is known as the
capital asset pricing model, or CAPM. The model’s message is both startling and
simple. In a competitive market, the expected risk premium varies in direct pro-
portion to beta. This means that in Figure 8.7 all investments must plot along the
sloping line, known as the security market line. The expected risk premium on an
investment with a beta of .5 is, therefore, half the expected risk premium on the
market; the expected risk premium on an investment with a beta of 2.0 is twice the
expected risk premium on the market. We can write this relationship as
Some Estimates of Expected Returns
Before we tell you where the formula comes from, let us use it to figure out what
returns investors are looking for from particular stocks. To do this, we need three
numbers: , r
f
, and r
m
⫺ r
f
. We gave you estimates of the betas of 10 stocks in Table
7.5. In July 2001 the interest rate on Treasury bills was about 3.5 percent.
How about the market risk premium? As we pointed out in the last chapter, we
can’t measure r
m
⫺ r
f
with precision. From past evidence it appears to be about
r ⫺ r
f
⫽1r
m
⫺ r
f
2
Expected risk premium on stock ⫽ beta ⫻ expected risk premium on market
CHAPTER 8 Risk and Return 195
9
Remember that the risk premium is the difference between the investment’s expected return and the
risk-free rate. For Treasury bills, the difference is zero.
10
W. F. Sharpe, “Capital Asset Prices: A Theory of Market Equilibrium under Conditions of Risk,” Jour-
nal of Finance 19 (September 1964), pp. 425–442 and J. Lintner, “The Valuation of Risk Assets and the Se-
lection of Risky Investments in Stock Portfolios and Capital Budgets,” Review of Economics and Statistics
47 (February 1965), pp. 13–37. Treynor’s article has not been published.
b
0 .5 1.0 2.0
Treasury bills
Market portfolio
Security market line
Expected return
on investment
r
f
r
m
beta ( )
FIGURE 8.7
The capital asset pricing model
states that the expected risk
premium on each investment is
proportional to its beta. This
means that each investment
should lie on the sloping
security market line connecting
Treasury bills and the market
portfolio.

Brealey−Meyers:
Principles of Corporate
Finance, Seventh Edition
II. Risk 8. Risk and Return
© The McGraw−Hill
Companies, 2003
9 percent, although many economists and financial managers would forecast a
lower figure. Let’s use 8 percent in this example.
Table 8.2 puts these numbers together to give an estimate of the expected return
on each stock. The stock with the lowest beta in our sample is Exxon Mobil. Our
estimate of the expected return from Exxon Mobil is 6.7 percent. The stock with the
highest beta is Amazon.com. Our estimate of its expected return is 29.5 percent, 26
percent more than the interest rate on Treasury bills.
You can also use the capital asset pricing model to find the discount rate for a
new capital investment. For example, suppose that you are analyzing a proposal
by Pfizer to expand its capacity. At what rate should you discount the forecast cash
flows? According to Table 8.2, investors are looking for a return of 9.2 percent from
businesses with the risk of Pfizer. So the cost of capital for a further investment in
the same business is 9.2 percent.
11
In practice, choosing a discount rate is seldom so easy. (After all, you can’t ex-
pect to be paid a fat salary just for plugging numbers into a formula.) For example,
you must learn how to adjust for the extra risk caused by company borrowing and
how to estimate the discount rate for projects that do not have the same risk as the
company’s existing business. There are also tax issues. But these refinements can
wait until later.
12
Review of the Capital Asset Pricing Model
Let’s review the basic principles of portfolio selection:
1. Investors like high expected return and low standard deviation. Common
stock portfolios that offer the highest expected return for a given standard
deviation are known as efficient portfolios.
196 PART II
Risk
Expected Return
Stock Beta ()[r
f
⫹ (r
m
⫺ r
f
)]
Amazon.com 3.25 29.5%
Boeing .56 8.0
Coca-Cola .74 9.4
Dell Computer 2.21 21.2
Exxon Mobil .40 6.7
General Electric 1.18 12.9
General Motors .91 10.8
McDonald’s .68 8.9
Pfizer .71 9.2
Reebok .69 9.0
TABLE 8.2
These estimates of the returns expected by
investors in July 2001 were based on the capital
asset pricing model. We assumed 3.5 percent for
the interest rate r
f
and 8 percent for the expected
risk premium r
m
⫺ r
f
.
11
Remember that instead of investing in plant and machinery, the firm could return the money to the
shareholders. The opportunity cost of investing is the return that shareholders could expect to earn by
buying financial assets. This expected return depends on the market risk of the assets.
12
Tax issues arise because a corporation must pay tax on income from an investment in Treasury bills
or other interest-paying securities. It turns out that the correct discount rate for risk-free investments is
the after-tax Treasury bill rate. We come back to this point in Chapters 19 and 26.
Various other points on the practical use of betas and the capital asset pricing model are covered in
Chapter 9.