Brealey, Myers. Principles of Corporate Finance. 7th edition
Подождите немного. Документ загружается.

Brealey−Meyers:
Principles of Corporate
Finance, Seventh Edition
II. Risk 7. Introduction to Risk,
Return, and the Opportunity
Cost of Capital
© The McGraw−Hill
Companies, 2003
167
-35
-15
5
25
45
Aug-96 Jan-97 Jan-98 Jan-99 Jan-00 Jan-01
65
Aug-96 Jan-97 Jan-98 Jan-99 Jan-00 Jan-01
-35
-15
5
25
45
Aug-96 Jan-97 Jan-98 Jan-99 Jan-00 Jan-01
65
-35
-15
5
25
45
65
85
Dell Computer
Reebok
Portfolio
Return, percent
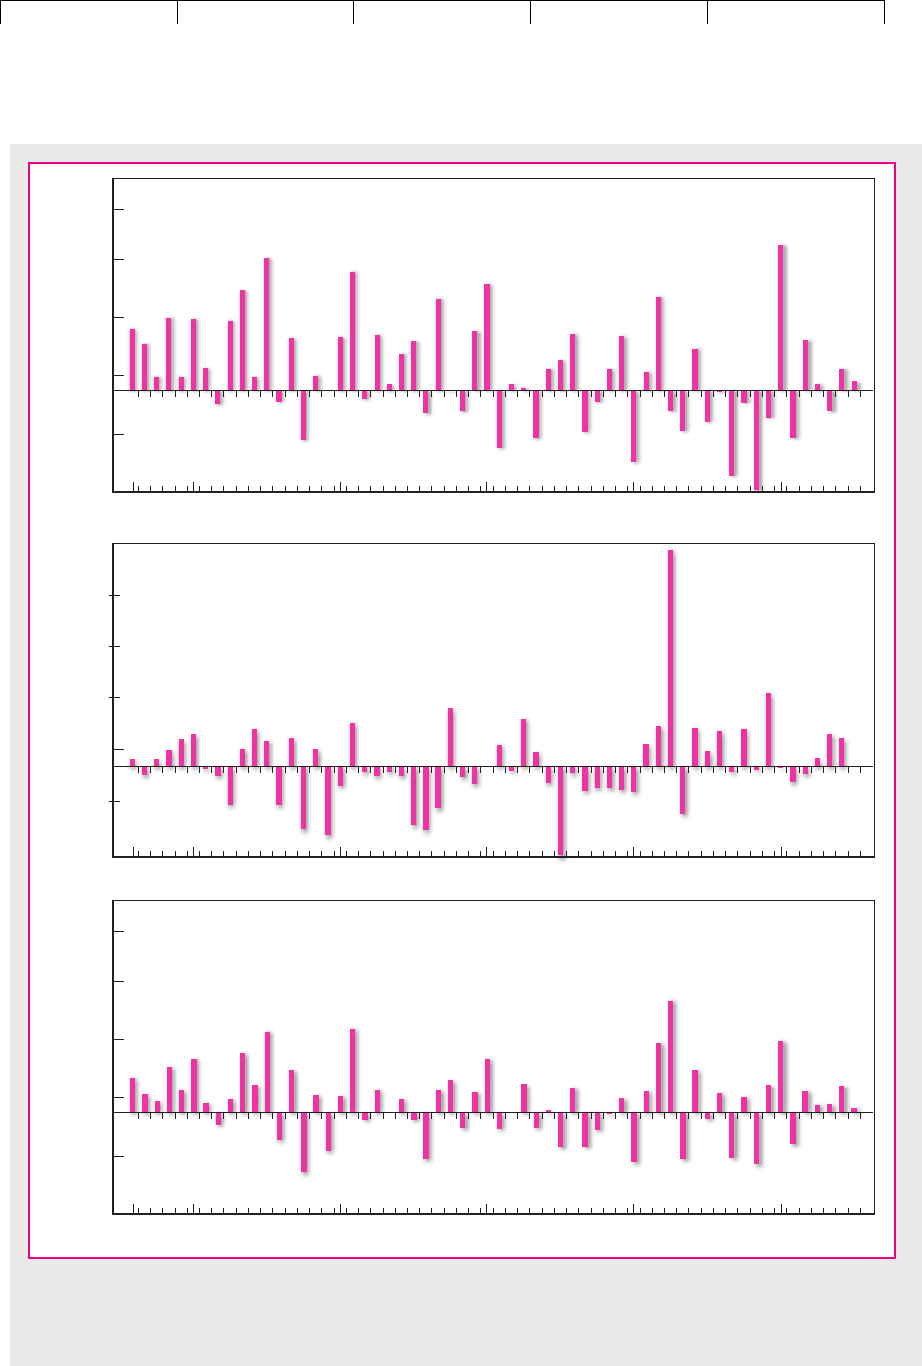
FIGURE 7.7
The variability of a portfolio with equal holdings in Dell Computer and Reebok would have been less than the average
variability of the individual stocks. These returns run from August 1996 to July 2001.
Brealey−Meyers:
Principles of Corporate
Finance, Seventh Edition
II. Risk 7. Introduction to Risk,
Return, and the Opportunity
Cost of Capital
© The McGraw−Hill
Companies, 2003
been unusually volatile. The middle panel shows returns for Reebok stock, which
has also had its ups and downs. But on many occasions a decline in the value of
one stock was offset by a rise in the price of the other.
19
Therefore there was an
opportunity to reduce your risk by diversification. Figure 7.7 shows that if you
had divided your funds evenly between the two stocks, the variability of your
portfolio would have been substantially less than the average variability of the
two stocks.
20
The risk that potentially can be eliminated by diversification is called unique
risk.
21
Unique risk stems from the fact that many of the perils that surround an
individual company are peculiar to that company and perhaps its immediate
competitors. But there is also some risk that you can’t avoid, regardless of how
much you diversify. This risk is generally known as market risk.
22
Market risk
stems from the fact that there are other economywide perils that threaten all
businesses. That is why stocks have a tendency to move together. And that is
why investors are exposed to market uncertainties, no matter how many stocks
they hold.
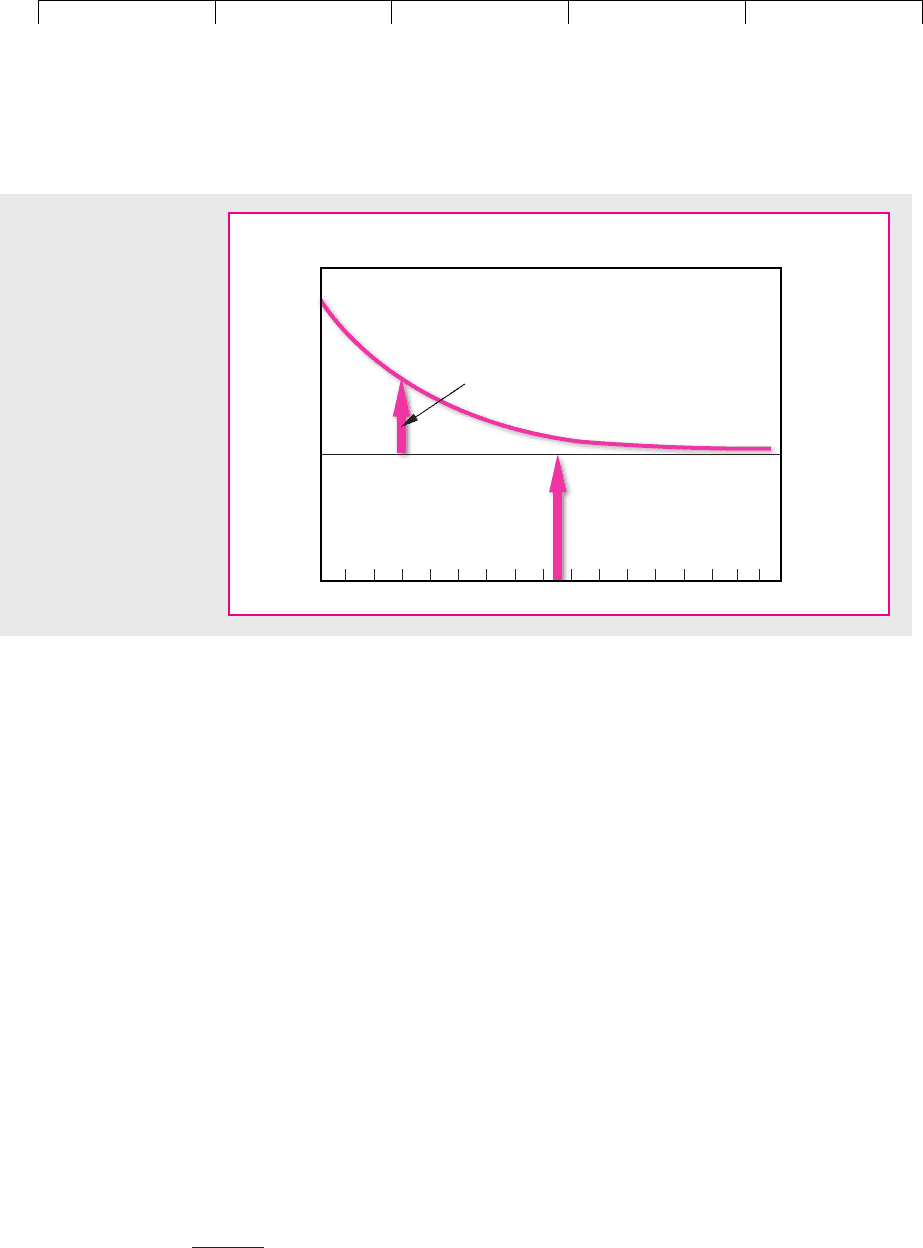
In Figure 7.8 we have divided the risk into its two parts—unique risk and mar-
ket risk. If you have only a single stock, unique risk is very important; but once you
have a portfolio of 20 or more stocks, diversification has done the bulk of its work.
For a reasonably well-diversified portfolio, only market risk matters. Therefore,
the predominant source of uncertainty for a diversified investor is that the market
will rise or plummet, carrying the investor’s portfolio with it.
168 PART II
Risk
19
Over this period the correlation between the returns on the two stocks was approximately zero.
20
The standard deviations of Dell Computer and Reebok were 62.7 and 58.5 percent, respectively. The
standard deviation of a portfolio with half invested in each was 43.3 percent.
21
Unique risk may be called unsystematic risk, residual risk, specific risk, or diversifiable risk.
22
Market risk may be called systematic risk or undiversifiable risk.
Number of
securities
10 1515
Portfolio
standard deviation
Unique risk
Market risk
FIGURE 7.8
Diversification eliminates
unique risk. But there is
some risk that diversifica-
tion cannot eliminate. This
is called market risk.

Brealey−Meyers:
Principles of Corporate
Finance, Seventh Edition
II. Risk 7. Introduction to Risk,
Return, and the Opportunity
Cost of Capital
© The McGraw−Hill
Companies, 2003
We have given you an intuitive idea of how diversification reduces risk, but to un-
derstand fully the effect of diversification, you need to know how the risk of a port-
folio depends on the risk of the individual shares.
Suppose that 65 percent of your portfolio is invested in the shares of Coca-Cola
and the remainder is invested in Reebok. You expect that over the coming year
Coca-Cola will give a return of 10 percent and Reebok, 20 percent. The expected re-
turn on your portfolio is simply a weighted average of the expected returns on the
individual stocks:
23
Calculating the expected portfolio return is easy. The hard part is to work out the
risk of your portfolio. In the past the standard deviation of returns was 31.5 percent
for Coca-Cola and 58.5 percent for Reebok. You believe that these figures are a good
forecast of the spread of possible future outcomes. At first you may be inclined to as-
sume that the standard deviation of your portfolio is a weighted average of the stan-
dard deviations of the two stocks, that is (.65 ⫻ 31.5) ⫹ (.35 ⫻ 58.5) ⫽ 41.0 percent.
That would be correct only if the prices of the two stocks moved in perfect lockstep.
In any other case, diversification reduces the risk below this figure.
The exact procedure for calculating the risk of a two-stock portfolio is given in
Figure 7.9. You need to fill in four boxes. To complete the top left box, you weight
the variance of the returns on stock 1 (
2
1
) by the square of the proportion invested
in it (x
2
1
). Similarly, to complete the bottom right box, you weight the variance of
the returns on stock 2 (
2
2
) by the square of the proportion invested in stock 2 (x
22
2
).
The entries in these diagonal boxes depend on the variances of stocks 1 and 2;
the entries in the other two boxes depend on their covariance. As you might guess,
the covariance is a measure of the degree to which the two stocks “covary.” The co-
variance can be expressed as the product of the correlation coefficient
12
and the
two standard deviations:
24
For the most part stocks tend to move together. In this case the correlation coeffi-
cient
12
is positive, and therefore the covariance
12
is also positive. If the
prospects of the stocks were wholly unrelated, both the correlation coefficient and
the covariance would be zero; and if the stocks tended to move in opposite direc-
tions, the correlation coefficient and the covariance would be negative. Just as you
Covariance between stocks 1 and 2 ⫽
12
⫽
12
1
2
Expected portfolio return ⫽ 10.65 ⫻ 102⫹ 10.35 ⫻ 202⫽ 13.5%
CHAPTER 7
Introduction to Risk, Return, and the Opportunity Cost of Capital 169
23
Let’s check this. Suppose you invest $65 in Coca-Cola and $35 in Reebok. The expected dollar return
on your Coca-Cola holding is .10 ⫻ 65 ⫽ $6.50, and on Reebok it is .20 ⫻ 35 ⫽ $7.00. The expected dol-
lar return on your portfolio is 6.50 ⫹ 7.00 ⫽ $13.50. The portfolio rate of return is 13.50/100 ⫽ 0.135, or
13.5 percent.
24
Another way to define the covariance is as follows:
Note that any security’s covariance with itself is just its variance:
⫽ expected value of 1
˜
r
1
⫺ r
1
2
2
⫽ variance of stock 1 ⫽
2
1
.
11
⫽ expected value of 1
˜
r
1
⫺ r
1
2⫻ 1
˜
r
1
⫺ r
1
2
Covariance between stocks 1 and 2 ⫽
12
⫽ expected value of 1
˜
r
1
⫺ r
1
2⫻ 1
˜
r
2
⫺ r
2
2
7.3 CALCULATING PORTFOLIO RISK

Brealey−Meyers:
Principles of Corporate
Finance, Seventh Edition
II. Risk 7. Introduction to Risk,
Return, and the Opportunity
Cost of Capital
© The McGraw−Hill
Companies, 2003
weighted the variances by the square of the proportion invested, so you must
weight the covariance by the product of the two proportionate holdings x
1
and x
2
.
Once you have completed these four boxes, you simply add the entries to obtain
the portfolio variance:
The portfolio standard deviation is, of course, the square root of the variance.
Now you can try putting in some figures for Coca-Cola and Reebok. We said
earlier that if the two stocks were perfectly correlated, the standard deviation of the
portfolio would lie 45 percent of the way between the standard deviations of the
two stocks. Let us check this out by filling in the boxes with
12
⫽⫹1.
Portfolio variance ⫽ x
2
1
2
1
⫹ x
2
2
2
2
⫹ 21x
1
x
2
12
1
2
2
170 PART II
Risk
Stock 1
Stock 1
Stock 2
Stock 2
x
1
1
σ
22
x
2
2
σ
22
x
1
x
2
12
=
σ
x
1
x
2
12 1 2
σσρ
x
1
x
2
12
=
σ
x
1
x
2
12 1 2
σσρ
FIGURE 7.9
The variance of a two-
stock portfolio is the
sum of these four
boxes. x
1
, x
2
⫽ propor-
tions invested in stocks
1 and 2;
1
,
2
, ⫽
variances of stock
returns;
12
⫽ covariance
of returns (
12
1
2
);
12
⫽ correlation
between returns on
stocks 1 and 2.
Coca-Cola Reebok
Coca-Cola
x
1
x
2
12
1
2
Reebok
⫽ .65 ⫻ .35 ⫻ 1 ⫻ 31.5 ⫻ 58.5
x
2
2
2
2
⫽ 1.352
2
⫻ 158.52
2
⫽ 1.652⫻ 1.352⫻ 1 ⫻ 131.52⫻ 158.52
x
1
x
2
12
1
2
x
2
1
2
1
⫽ 1.652
2
⫻ 131.52
2
The variance of your portfolio is the sum of these entries:
The standard deviation is percent or 35 percent of the way be-
tween 31.5 and 58.5.
Coca-Cola and Reebok do not move in perfect lockstep. If past experience is any
guide, the correlation between the two stocks is about .2. If we go through the same
exercise again with
12
⫽⫹.2, we find
The standard deviation is percent. The risk is now less than 35
percent of the way between 31.5 and 58.5; in fact, it is little more than the risk of in-
vesting in Coca-Cola alone.
21,006.1
⫽ 31.7
⫹ 21.65 ⫻ .35 ⫻ .2 ⫻ 31.5 ⫻ 58.52⫽ 1,006.1
Portfolio variance ⫽ 31.652
2
⫻ 131.52
2
4⫹ 31.352
2
⫻ 158.52
2
4
21,676.9 ⫽ 41.0
⫹ 21.65 ⫻ .35 ⫻ 1 ⫻ 31.5 ⫻ 58.52⫽ 1,676.9
Portfolio variance ⫽ 31.652
2
⫻ 131.52
2
4⫹ 31.352
2
⫻ 158.52
2
4

Brealey−Meyers:
Principles of Corporate
Finance, Seventh Edition
II. Risk 7. Introduction to Risk,
Return, and the Opportunity
Cost of Capital
© The McGraw−Hill
Companies, 2003
The greatest payoff to diversification comes when the two stocks are negatively
correlated. Unfortunately, this almost never occurs with real stocks, but just for il-
lustration, let us assume it for Coca-Cola and Reebok. And as long as we are being
unrealistic, we might as well go whole hog and assume perfect negative correla-
tion (
12
⫽⫺1). In this case,
When there is perfect negative correlation, there is always a portfolio strategy (rep-
resented by a particular set of portfolio weights) which will completely eliminate
risk.
25
It’s too bad perfect negative correlation doesn’t really occur between com-
mon stocks.
General Formula for Computing Portfolio Risk
The method for calculating portfolio risk can easily be extended to portfolios of
three or more securities. We just have to fill in a larger number of boxes. Each of
those down the diagonal—the shaded boxes in Figure 7.10—contains the variance
weighted by the square of the proportion invested. Each of the other boxes contains
the covariance between that pair of securities, weighted by the product of the pro-
portions invested.
26
Limits to Diversification
Did you notice in Figure 7.10 how much more important the covariances become
as we add more securities to the portfolio? When there are just two securities, there
are equal numbers of variance boxes and of covariance boxes. When there are
many securities, the number of covariances is much larger than the number of vari-
ances. Thus the variability of a well-diversified portfolio reflects mainly the co-
variances.
Suppose we are dealing with portfolios in which equal investments are made in
each of N stocks. The proportion invested in each stock is, therefore, 1/N. So in
each variance box we have (1/N)
2
times the variance, and in each covariance box
we have (1/N)
2
times the covariance. There are N variance boxes and N
2
⫺ N co-
variance boxes. Therefore,
⫽
1
N
⫻ average variance ⫹ a1 ⫺
1
N
b⫻ average covariance
⫹ 1N
2
⫺ N2a
1
N
b
2
⫻ average covariance
Portfolio variance ⫽ N a
1
N
b
2
⫻ average variance
⫹ 23.65 ⫻ .35 ⫻ 1⫺12⫻ 31.5 ⫻ 58.54⫽ 0
Portfolio variance ⫽ 31.652
2
⫻ 131.52
2
4⫹ 31.352
2
⫻ 158.52
2
4
CHAPTER 7 Introduction to Risk, Return, and the Opportunity Cost of Capital 171
25
Since the standard deviation of Reebok is 1.86 times that of Coca-Cola, you need to invest 1.86 times
more in Coca-Cola to eliminate risk in this two-stock portfolio.
26
The formal equivalent to “add up all the boxes” is
Notice that when i ⫽ j,
ij
is just the variance of stock i.
Portfolio variance ⫽
a
N
i⫽1
a
N
j⫽1
x
i
x
j
ij

Brealey−Meyers:
Principles of Corporate
Finance, Seventh Edition
II. Risk 7. Introduction to Risk,
Return, and the Opportunity
Cost of Capital
© The McGraw−Hill
Companies, 2003
Notice that as N increases, the portfolio variance steadily approaches the average
covariance. If the average covariance were zero, it would be possible to eliminate
all risk by holding a sufficient number of securities. Unfortunately common stocks
move together, not independently. Thus most of the stocks that the investor can ac-
tually buy are tied together in a web of positive covariances which set the limit to
the benefits of diversification. Now we can understand the precise meaning of the
market risk portrayed in Figure 7.8. It is the average covariance which constitutes
the bedrock of risk remaining after diversification has done its work.
172 PART II
Risk
Stock
Stock
N
N
1
1
2
3
4
5
6
7
234567
FIGURE 7.10
To find the variance of an N-stock
portfolio, we must add the entries in a
matrix like this. The diagonal cells contain
variance terms (x
i
2
2
i
), and the off-diagonal
cells contain covariance terms (x
i
x
j
ij
).
7.4 HOW INDIVIDUAL SECURITIES AFFECT
PORTFOLIO RISK
We presented earlier some data on the variability of 10 individual U.S. securities.
Amazon.com had the highest standard deviation and Exxon Mobil had the lowest.
If you had held Amazon on its own, the spread of possible returns would have
been six times greater than if you had held Exxon Mobil on its own. But that is not
a very interesting fact. Wise investors don’t put all their eggs into just one basket:
They reduce their risk by diversification. They are therefore interested in the effect
that each stock will have on the risk of their portfolio.
This brings us to one of the principal themes of this chapter. The risk of a well-
diversified portfolio depends on the market risk of the securities included in the portfolio.
Tattoo that statement on your forehead if you can’t remember it any other way. It
is one of the most important ideas in this book.

Brealey−Meyers:
Principles of Corporate
Finance, Seventh Edition
II. Risk 7. Introduction to Risk,
Return, and the Opportunity
Cost of Capital
© The McGraw−Hill
Companies, 2003
Market Risk Is Measured by Beta
If you want to know the contribution of an individual security to the risk of a well-
diversified portfolio, it is no good thinking about how risky that security is if held
in isolation—you need to measure its market risk, and that boils down to measur-
ing how sensitive it is to market movements. This sensitivity is called beta ().
Stocks with betas greater than 1.0 tend to amplify the overall movements of the
market. Stocks with betas between 0 and 1.0 tend to move in the same direction as
the market, but not as far. Of course, the market is the portfolio of all stocks, so the
“average” stock has a beta of 1.0. Table 7.5 reports betas for the 10 well-known com-
mon stocks we referred to earlier.
Over the five years from mid-1996 to mid-2001, Dell Computer had a beta of
2.21. If the future resembles the past, this means that on average when the market
rises an extra 1 percent, Dell’s stock price will rise by an extra 2.21 percent. When
the market falls an extra 2 percent, Dell’s stock prices will fall an extra 2 ⫻ 2.21 ⫽
4.42 percent. Thus a line fitted to a plot of Dell’s returns versus market returns has
a slope of 2.21. See Figure 7.11.
CHAPTER 7
Introduction to Risk, Return, and the Opportunity Cost of Capital 173
Stock Beta () Stock Beta ()
Amazon.com* 3.25 General Electric 1.18
Boeing .56 General Motors .91
Coca-Cola .74 McDonald’s .68
Dell Computer 2.21 Pfizer .71
Exxon Mobil .40 Reebok .69
TABLE 7.5
Betas for selected U.S. common stocks,
August 1996–July 2001.
*June 1997–July 2001.
Return on
market, percent
Return on Dell Computer, percent
2.21
1.0
FIGURE 7.11
The return on Dell Computer stock
changes on average by 2.21 percent for
each additional 1 percent change in the
market return. Beta is therefore 2.21.

Brealey−Meyers:
Principles of Corporate
Finance, Seventh Edition
II. Risk 7. Introduction to Risk,
Return, and the Opportunity
Cost of Capital
© The McGraw−Hill
Companies, 2003
Of course Dell’s stock returns are not perfectly correlated with market returns.
The company is also subject to unique risk, so the actual returns will be scattered
about the line in Figure 7.11. Sometimes Dell will head south while the market goes
north, and vice versa.
Of the 10 stocks in Table 7.5 Dell has one of the highest betas. Exxon Mobil is at
the other extreme. A line fitted to a plot of Exxon Mobil’s returns versus market re-
turns would be less steep: Its slope would be only .40.
Just as we can measure how the returns of a U.S. stock are affected by fluctua-
tions in the U.S. market, so we can measure how stocks in other countries are af-
fected by movements in their markets. Table 7.6 shows the betas for the sample of
foreign stocks.
Why Security Betas Determine Portfolio Risk
Let’s review the two crucial points about security risk and portfolio risk:
• Market risk accounts for most of the risk of a well-diversified portfolio.
• The beta of an individual security measures its sensitivity to market
movements.
It’s easy to see where we are headed: In a portfolio context, a security’s risk is meas-
ured by beta. Perhaps we could just jump to that conclusion, but we’d rather ex-
plain it. In fact, we’ll offer two explanations.
Explanation 1: Where’s Bedrock? Look back to Figure 7.8, which shows how
the standard deviation of portfolio return depends on the number of securities in
the portfolio. With more securities, and therefore better diversification, portfolio
risk declines until all unique risk is eliminated and only the bedrock of market
risk remains.
Where’s bedrock? It depends on the average beta of the securities selected.
Suppose we constructed a portfolio containing a large number of stocks—500,
say—drawn randomly from the whole market. What would we get? The market it-
self, or a portfolio very close to it. The portfolio beta would be 1.0, and the correla-
tion with the market would be 1.0. If the standard deviation of the market were 20
percent (roughly its average for 1926–2000), then the portfolio standard deviation
would also be 20 percent.
But suppose we constructed the portfolio from a large group of stocks with an
average beta of 1.5. Again we would end up with a 500-stock portfolio with virtu-
ally no unique risk—a portfolio that moves almost in lockstep with the market.
However, this portfolio’s standard deviation would be 30 percent, 1.5 times that of
174 PART II
Risk
Stock Beta Stock Beta
Alcan .66 LVMH 1.42
BP Amoco .82 Nestlé .64
Deutsche Bank 1.18 Nokia 1.29
Fiat 1.03 Sony 1.38
KLM .82 Telefonica 1.06
de Argentina
TABLE 7.6
Betas for foreign stocks, September
1996–August 2001 (betas are measured
relative to the stock’s home market).

Brealey−Meyers:
Principles of Corporate
Finance, Seventh Edition
II. Risk 7. Introduction to Risk,
Return, and the Opportunity
Cost of Capital
© The McGraw−Hill
Companies, 2003
the market.
27
A well-diversified portfolio with a beta of 1.5 will amplify every mar-
ket move by 50 percent and end up with 150 percent of the market’s risk.
Of course, we could repeat the same experiment with stocks with a beta of .5 and
end up with a well-diversified portfolio half as risky as the market. Figure 7.12
shows these three cases.
The general point is this: The risk of a well-diversified portfolio is proportional
to the portfolio beta, which equals the average beta of the securities included in the
portfolio. This shows you how portfolio risk is driven by security betas.
Explanation 2: Betas and Covariances. A statistician would define the beta of
stock i as
where
im
is the covariance between stock i’s return and the market return, and
m
2
is the variance of the market return.
It turns out that this ratio of covariance to variance measures a stock’s contribu-
tion to portfolio risk. You can see this by looking back at our calculations for the
risk of the portfolio of Coca-Cola and Reebok.
Remember that the risk of this portfolio was the sum of the following cells:

i
⫽
im
2
m
CHAPTER 7 Introduction to Risk, Return, and the Opportunity Cost of Capital 175
27
A 500-stock portfolio with ⫽1.5 would still have some unique risk because it would be unduly con-
centrated in high-beta industries. Its actual standard deviation would be a bit higher than 30 percent. If
that worries you, relax; we will show you in Chapter 8 how you can construct a fully diversified port-
folio with a beta of 1.5 by borrowing and investing in the market portfolio.
Coca-Cola Reebok
Coca-Cola (.65)
2
⫻ (31.5)
2
.65 ⫻ .35 ⫻ .2 ⫻ 31.5 ⫻ 58.5
Reebok .65 ⫻ .35 ⫻ .2 ⫻ 31.5 ⫻ 58.5 (.35)
2
⫻ (58.5)
2
If we add each row of cells, we can see how much of the portfolio’s risk comes from
Coca-Cola and how much comes from Reebok:
Stock Contribution to Risk
Coca-Cola .65 ⫻ {[.65 ⫻ (31.5)
2
] ⫹ [.35 ⫻ .2 ⫻ 31.5 ⫻ 58.5]} ⫽ .65 ⫻ 774.0
Reebok .35 ⫻ {[.65 ⫻ .2 ⫻ 31.5 ⫻ 58.5] ⫹ [.35 ⫻ (58.5)
2
]} ⫽ .35 ⫻ 1,437.3
Total portfolio 1,006.1
Coca-Cola’s contribution to portfolio risk depends on its relative importance in
the portfolio (.65) and its average covariance with the stocks in the portfolio (774.0).
(Notice that the average covariance of Coca-Cola with the portfolio includes its co-
variance with itself, i.e., its variance.) The proportion of the risk that comes from the
Coca-Cola holding is
Similarly, Reebok’s contribution to portfolio risk depends on its relative im-
portance in the portfolio (.35) and its average covariance with the stocks in the
Relative market value ⫻
average covariance
portfolio variance
⫽ .65 ⫻
774.0
1,006.1
⫽ .65 ⫻ .77 ⫽ .5
Brealey−Meyers:
Principles of Corporate
Finance, Seventh Edition
II. Risk 7. Introduction to Risk,
Return, and the Opportunity
Cost of Capital
© The McGraw−Hill
Companies, 2003
176
Number of
securities
500
(a)
Standard deviation
Portfolio risk (
p
) = 20 percent
σ
Market risk (
m
) = 20 percent
σ
Number of
securities
500
(
b
)
Standard deviation
Portfolio risk (
p
) = 30 percent
σ
Market risk (
m
) = 20 percent
σ
Number of
securities
500
(
c
)
Standard deviation
Portfolio risk (
p
) = 10 percent
σ
Market risk (
m
) = 20 percent
σ
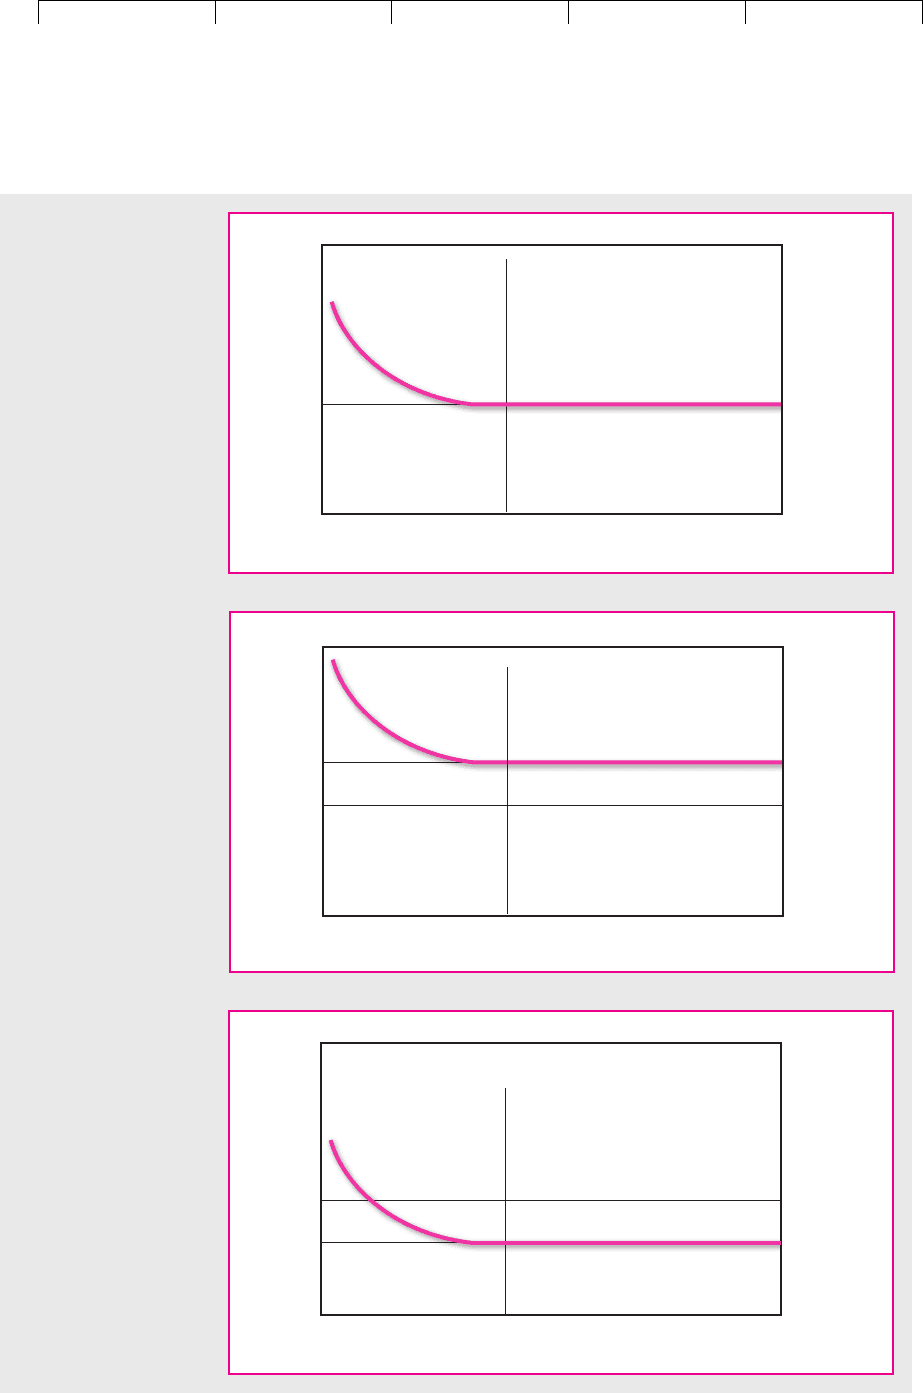
FIGURE 7.12
(a) A randomly selected
500-stock portfolio ends
up with ⫽1 and a
standard deviation equal
to the market’s—in this
case 20 percent. (b) A
500-stock portfolio
constructed with stocks
with average ⫽1.5 has
a standard deviation of
about 30 percent—150
percent of the market’s.
(c) A 500-stock portfolio
constructed with stocks
with average ⫽.5 has a
standard deviation of
about 10 percent—half
the market’s.