Brealey, Myers. Principles of Corporate Finance. 7th edition
Подождите немного. Документ загружается.


Brealey−Meyers:
Principles of Corporate
Finance, Seventh Edition
II. Risk 7. Introduction to Risk,
Return, and the Opportunity
Cost of Capital
© The McGraw−Hill
Companies, 2003
less than the opportunity cost of capital. Investors would not be willing to invest in
a project that offered an 8.8 percent expected return if they could get an expected
return of 10 percent in the capital markets. The net present value of such a project
would be
Moral: If the cost of capital is estimated from historical returns or risk premiums,
use arithmetic averages, not compound annual rates of return.
Using Historical Evidence to Evaluate Today’s Cost of Capital
Suppose there is an investment project which you know—don’t ask how—has the
same risk as Standard and Poor’s Composite Index. We will say that it has the same
degree of risk as the market portfolio, although this is speaking somewhat loosely,
because the index does not include all risky securities. What rate should you use
to discount this project’s forecasted cash flows?
Clearly you should use the currently expected rate of return on the market port-
folio; that is the return investors would forgo by investing in the proposed project.
Let us call this market return r
m
. One way to estimate r
m
is to assume that the fu-
ture will be like the past and that today’s investors expect to receive the same
“normal” rates of return revealed by the averages shown in Table 7.1. In this case,
you would set r
m
at 13 percent, the average of past market returns.
Unfortunately, this is not the way to do it; r
m
is not likely to be stable over time.
Remember that it is the sum of the risk-free interest rate r
f
and a premium for risk.
We know that r
f
varies. For example, in 1981 the interest rate on Treasury bills was
about 15 percent. It is difficult to believe that investors in that year were content to
hold common stocks offering an expected return of only 13 percent.
If you need to estimate the return that investors expect to receive, a more sensi-
ble procedure is to take the interest rate on Treasury bills and add 9.1 percent, the
average risk premium shown in Table 7.1. For example, as we write this in mid-2001
the interest rate on Treasury bills is about 3.5 percent. Adding on the average risk
premium, therefore, gives
The crucial assumption here is that there is a normal, stable risk premium on the
market portfolio, so that the expected future risk premium can be measured by the
average past risk premium.
Even with 75 years of data, we can’t estimate the market risk premium exactly;
nor can we be sure that investors today are demanding the same reward for risk
that they were 60 or 70 years ago. All this leaves plenty of room for argument about
what the risk premium really is.
5
Many financial managers and economists believe that long-run historical re-
turns are the best measure available. Others have a gut instinct that investors
⫽ .035 ⫹ .091 ⫽ .126, or about 12.5%
r
m
120012⫽ r
f
120012⫹ normal risk premium
NPV ⫽⫺100 ⫹
108.8
1.1
⫽⫺1.1
CHAPTER 7 Introduction to Risk, Return, and the Opportunity Cost of Capital 157
5
Some of the disagreements simply reflect the fact that the risk premium is sometimes defined in dif-
ferent ways. Some measure the average difference between stock returns and the returns (or yields) on
long-term bonds. Others measure the difference between the compound rate of growth on stocks and
the interest rate. As we explained above, this is not an appropriate measure of the cost of capital.

Brealey−Meyers:
Principles of Corporate
Finance, Seventh Edition
II. Risk 7. Introduction to Risk,
Return, and the Opportunity
Cost of Capital
© The McGraw−Hill
Companies, 2003
don’t need such a large risk premium to persuade them to hold common stocks.
6
In a recent survey of financial economists, more than a quarter of those polled be-
lieved that the expected risk premium was about 8 percent, but most of the re-
mainder opted for a figure between 4 and 7 percent. The average estimate was
just over 6 percent.
7
If you believe that the expected market risk premium is a lot less than the his-
torical averages, you probably also believe that history has been unexpectedly kind
to investors in the United States and that their good luck is unlikely to be repeated.
Here are three reasons why history may overstate the risk premium that investors
demand today.
Reason 1 Over the past 75 years stock prices in the United States have out-
paced dividend payments. In other words, there has been a long-term decline in
the dividend yield. Between 1926 and 2000 this decline in yield added about 2
percent a year to the return on common stocks. Was this yield change antici-
pated? If not, it would be more reasonable to take the long-term growth in div-
idends as a measure of the capital appreciation that investors were expecting.
This would point to a risk premium of about 7 percent.
Reason 2 Since 1926 the United States has been among the world’s most pros-
perous countries. Other economies have languished or been wracked by war or
civil unrest. By focusing on equity returns in the United States, we may obtain a bi-
ased view of what investors expected. Perhaps the historical averages miss the pos-
sibility that the United States could have turned out to be one of those less-fortu-
nate countries.
8
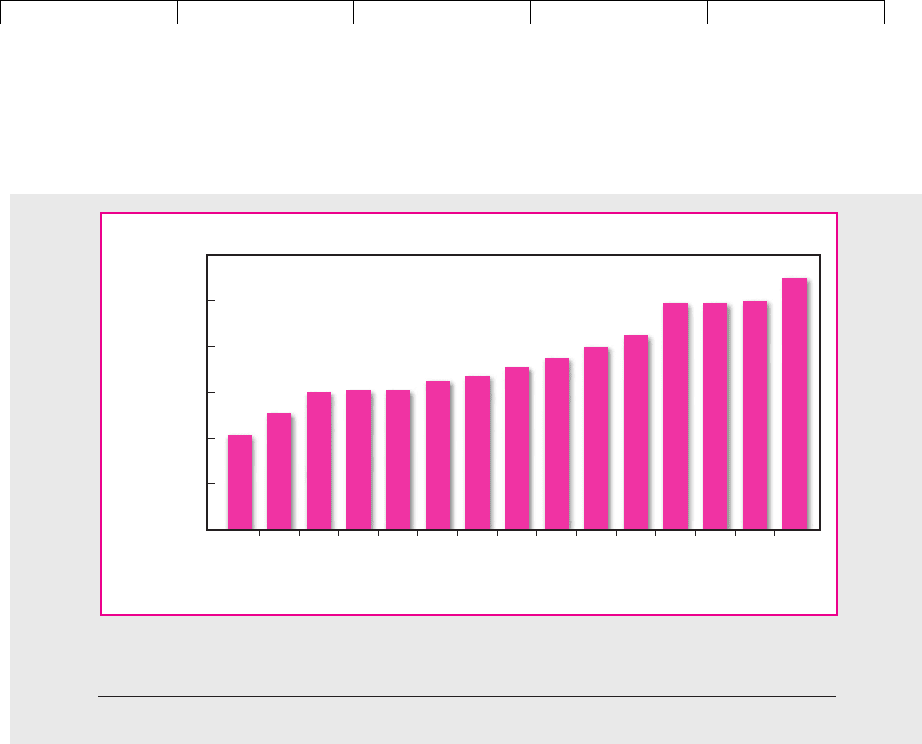
Figure 7.3 sheds some light on this issue. It is taken from a comprehensive study
by Dimson, Marsh, and Staunton of market returns in 15 countries and shows the
average risk premium in each country between 1900 and 2000.
9
Two points are
worth making. Notice first that in the United States the risk premium over 101
years has averaged 7.5 percent, somewhat less than the figure that we cited earlier
for the period 1926–2000. The period of the First World War and its aftermath was
in many ways not typical, so it is hard to say whether we get a more or less repre-
sentative picture of investor expectations by adding in the extra years. But the ef-
158 PART II
Risk
6
There is some theory behind this instinct. The high risk premium earned in the market seems to imply
that investors are extremely risk-averse. If that is true, investors ought to cut back their consumption
when stock prices fall and wealth decreases. But the evidence suggests that when stock prices fall, in-
vestors spend at nearly the same rate. This is difficult to reconcile with high risk aversion and a high
market risk premium. See R. Mehra and E. Prescott, “The Equity Premium: A Puzzle,” Journal of Mone-
tary Economics 15 (1985), pp. 145–161.
7
I. Welch, “Views of Financial Economists on the Equity Premium and Other Issues,” Journal of Business
73 (October 2000), pp. 501–537. In a later unpublished survey undertaken by Ivo Welch the average es-
timate for the equity risk premium was slightly lower at 5.5 percent. See I. Welch, “The Equity Premium
Consensus Forecast Revisited,” Yale School of Management, September 2001.
8
This possibility was suggested in P. Jorion and W. N. Goetzmann, “Global Stock Markets in the Twen-
tieth Century,” Journal of Finance 54 (June 1999), pp. 953–980.
9
See E. Dimson, P. R. Marsh, and M. Staunton, Millenium Book II: 101 Years of Investment Returns, ABN-
Amro and London Business School, London, 2001.
Brealey−Meyers:
Principles of Corporate
Finance, Seventh Edition
II. Risk 7. Introduction to Risk,
Return, and the Opportunity
Cost of Capital
© The McGraw−Hill
Companies, 2003
fect of doing so is an important reminder of how difficult it is to obtain an accurate
measure of the risk premium.
Now compare the returns in the United States with those in the other countries.
There is no evidence here that U.S. investors have been particularly fortunate; the
USA was exactly average in terms of the risk premium. Danish common stocks
came bottom of the league; the average risk premium in Denmark was only 4.3 per-
cent. Top of the form was Italy with a premium of 11.1 percent. Some of these vari-
ations between countries may reflect differences in risk. For example, Italian stocks
have been particularly variable and investors may have required a higher return to
compensate. But remember how difficult it is to make precise estimates of what in-
vestors expected. You probably would not be too far out if you concluded that the
expected risk premium was the same in each country.
Reason 3 During the second half of the 1990s U.S. equity prices experienced a re-
markable boom, with the annual return averaging nearly 25 percent more than the
return on Treasury bills. Some argued that this price rise reflected optimism that
the new economy would lead to a golden age of prosperity and surging profits, but
others attributed the rise to a reduction in the market risk premium.
To see how a rise in stock prices can stem from a fall in the risk premium, sup-
pose that investors in common stocks initially look for a return of 13 percent, made
up of a 3 percent dividend yield and 10 percent long-term growth in dividends. If
they now decide that they are prepared to hold equities on a prospective return of
12 percent, then other things being equal the dividend yield must fall to 2 percent.
CHAPTER 7
Introduction to Risk, Return, and the Opportunity Cost of Capital 159
0
2
4
6
8
10
12
Risk premium, percent
Den
(from
1915)
Bel Can Swi
(from
1911)
Spa UK Ire NethUSA Swe Aus Ger
(ex
1922/3)
Fra Jap It
Country
FIGURE 7.3
Average market risk premia, 1900–2000.
Source: E. Dimson, P. R. Marsh, and M. Staunton, Millenium Book II: 101 Years of Investment Returns, ABN-Amro
and London Business School, London, 2001.

Brealey−Meyers:
Principles of Corporate
Finance, Seventh Edition
II. Risk 7. Introduction to Risk,
Return, and the Opportunity
Cost of Capital
© The McGraw−Hill
Companies, 2003
Thus a 1 percentage point fall in the risk premium would lead to a 50 percent rise
in equity prices. If we include this price adjustment in our measures of past returns,
we will be doubly wrong in our estimate of the risk premium. First, we will over-
estimate the return that investors required in the past. Second, we will not recog-
nize that the return that investors require in the future is lower than in the past.
As stock prices began to slide back from their highs of March 2000, this belief in
a falling market risk premium began to wane. It seems that if the risk premium
truly did fall in the 1990s, then it also rose again as the new century dawned.
10
Out of this debate only one firm conclusion emerges: Do not trust anyone who
claims to know what returns investors expect. History contains some clues, but ul-
timately we have to judge whether investors on average have received what they
expected. Brealey and Myers have no official position on the market risk premium,
but we believe that a range of 6 to 8.5 percent is reasonable for the United States.
11
160 PART II Risk
10
The decline in the stock market in 2001 also reduces the long-term average risk premium. The aver-
age premium from 1926 to September 2001 is 8.7 percent, .4 percentage points lower than the figure
quoted in Table 7.1.
11
This range seems to be consistent with company practice. For example, Kaplan and Ruback, in an
analysis of valuations in 51 takeovers between 1983 and 1998, found that acquiring companies appeared
to base their discount rates on a market risk premium of about 7.5 percent over average returns on long-
term Treasury bonds. The risk premium over Treasury bills would have been about a percentage point
higher. See S. Kaplan and R. S. Ruback, “The Valuation of Cash Flow Forecasts: An Empirical Analysis,”
Journal of Finance 50 (September 1995), pp. 1059–1093.
7.2 MEASURING PORTFOLIO RISK
You now have a couple of benchmarks. You know the discount rate for safe proj-
ects, and you have an estimate of the rate for average-risk projects. But you don’t
know yet how to estimate discount rates for assets that do not fit these simple
cases. To do that, you have to learn (1) how to measure risk and (2) the relationship
between risks borne and risk premiums demanded.
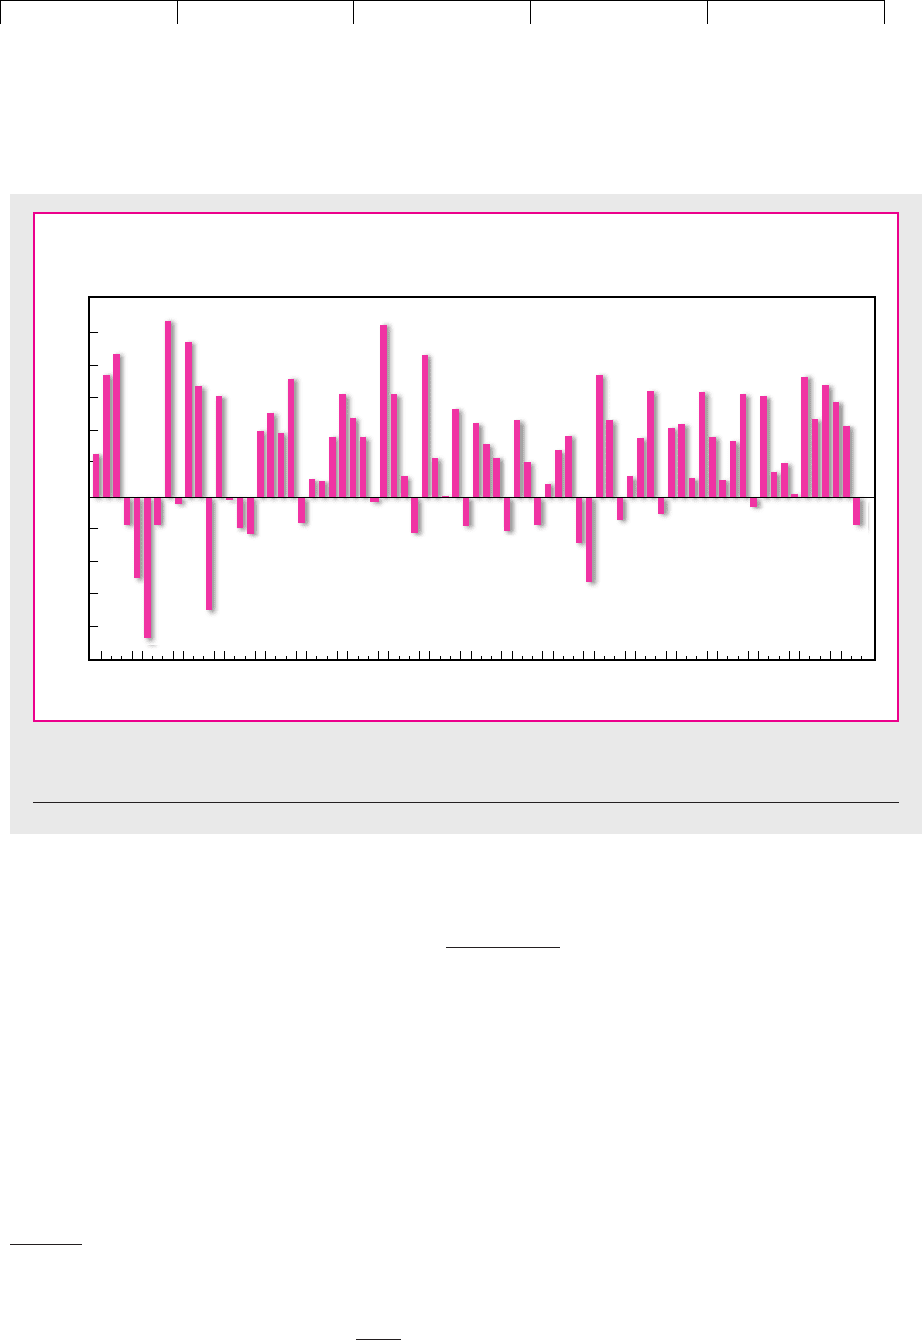
Figure 7.4 shows the 75 annual rates of return calculated by Ibbotson Associ-
ates for Standard and Poor’s Composite Index. The fluctuations in year-to-year
returns are remarkably wide. The highest annual return was 54.0 percent in
1933—a partial rebound from the stock market crash of 1929–1932. However,
there were losses exceeding 25 percent in four years, the worst being the ⫺43.3
percent return in 1931.
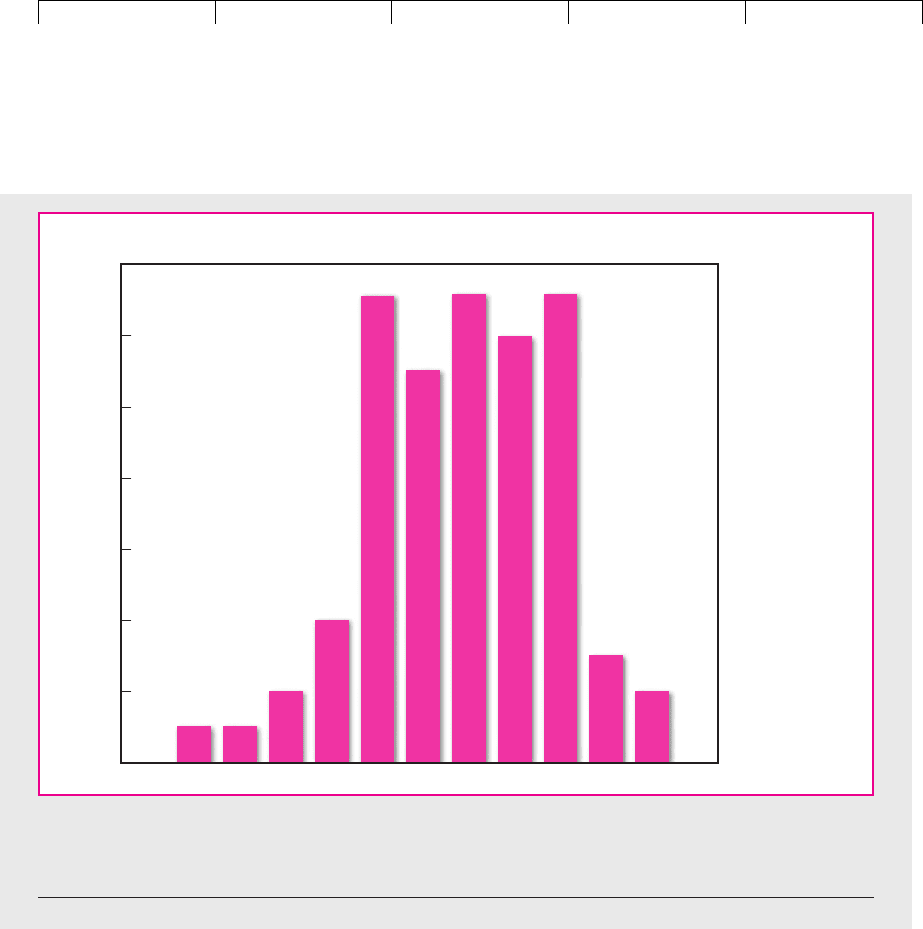
Another way of presenting these data is by a histogram or frequency distribu-
tion. This is done in Figure 7.5, where the variability of year-to-year returns shows
up in the wide “spread” of outcomes.
Variance and Standard Deviation
The standard statistical measures of spread are variance and standard deviation.
The variance of the market return is the expected squared deviation from the ex-
pected return. In other words,
Variance 1
˜
r
m
2⫽ the expected value of 1
˜
r
m
⫺ r
m
2
2
Brealey−Meyers:
Principles of Corporate
Finance, Seventh Edition
II. Risk 7. Introduction to Risk,
Return, and the Opportunity
Cost of Capital
© The McGraw−Hill
Companies, 2003
where
˜
r
m
is the actual return and r
m
is the expected return.
12
The standard devia-
tion is simply the square root of the variance:
Standard deviation is often denoted by and variance by
2
.
Here is a very simple example showing how variance and standard deviation
are calculated. Suppose that you are offered the chance to play the following game.
You start by investing $100. Then two coins are flipped. For each head that comes
up you get back your starting balance plus 20 percent, and for each tail that comes
up you get back your starting balance less 10 percent. Clearly there are four equally
likely outcomes:
• Head ⫹ head: You gain 40 percent.
• Head ⫹ tail: You gain 10 percent.
Standard deviation of
˜
r
m
⫽ 2variance 1
˜
r
m
2
CHAPTER 7 Introduction to Risk, Return, and the Opportunity Cost of Capital 161
1926
–40
–50
–30
–20
–10
0
10
30
40
50
60
1934 1942 1950 1958 198219741966 1990
Rate of
return,
percent
Year
20
1998
FIGURE 7.4
The stock market has been a profitable but extremely variable investment.
Source: Ibbotson Associates, Inc., 2001 Yearbook, © 2001 Ibbotson Associates, Inc.
12
One more technical point: When variance is estimated from a sample of observed returns, we add the
squared deviations and divide by N ⫺ 1, where N is the number of observations. We divide by N ⫺ 1
rather than N to correct for what is called the loss of a degree of freedom. The formula is
where
˜
r
mt
is the market return in period t and r
m
is the mean of the values of
˜
r
mt
.
Variance 1
˜
r
m
2⫽
1
N ⫺ 1
a
N
t⫽1
1
˜
r
mt
⫺ r
m
2
2
Brealey−Meyers:
Principles of Corporate
Finance, Seventh Edition
II. Risk 7. Introduction to Risk,
Return, and the Opportunity
Cost of Capital
© The McGraw−Hill
Companies, 2003
• Tail ⫹ head: You gain 10 percent.
• Tail ⫹ tail: You lose 20 percent.
There is a chance of 1 in 4, or .25, that you will make 40 percent; a chance of 2 in
4, or .5, that you will make 10 percent; and a chance of 1 in 4, or .25, that you will
lose 20 percent. The game’s expected return is, therefore, a weighted average of the
possible outcomes:
Table 7.2 shows that the variance of the percentage returns is 450. Standard devia-
tion is the square root of 450, or 21. This figure is in the same units as the rate of re-
turn, so we can say that the game’s variability is 21 percent.
One way of defining uncertainty is to say that more things can happen than will
happen. The risk of an asset can be completely expressed, as we did for the coin-
tossing game, by writing all possible outcomes and the probability of each. In prac-
Expected return ⫽ 1.25 ⫻ 402⫹ 1.5 ⫻ 102⫹ 1.25 ⫻⫺202⫽⫹10%
162 PART II Risk
0
2
4
6
8
10
12
14
–50 –40 –30 –20 –10 0 10 20 60504030
Return, percent
Number of years
FIGURE 7.5
Histogram of the annual rates of return from the stock market in the United States, 1926–2000, showing the wide
spread of returns from investment in common stocks.
Source: Ibbotson Associates, Inc., 2001 Yearbook.

Brealey−Meyers:
Principles of Corporate
Finance, Seventh Edition
II. Risk 7. Introduction to Risk,
Return, and the Opportunity
Cost of Capital
© The McGraw−Hill
Companies, 2003
tice this is cumbersome and often impossible. Therefore we use variance or stan-
dard deviation to summarize the spread of possible outcomes.
13
These measures are natural indexes of risk.
14
If the outcome of the coin-tossing
game had been certain, the standard deviation would have been zero. The actual
standard deviation is positive because we don’t know what will happen.
Or think of a second game, the same as the first except that each head means a
35 percent gain and each tail means a 25 percent loss. Again, there are four equally
likely outcomes:
• Head ⫹ head: You gain 70 percent.
• Head ⫹ tail: You gain 10 percent.
• Tail ⫹ head: You gain 10 percent.
• Tail ⫹ tail: You lose 50 percent.
For this game the expected return is 10 percent, the same as that of the first game.
But its standard deviation is double that of the first game, 42 versus 21 percent. By
this measure the second game is twice as risky as the first.
Measuring Variability
In principle, you could estimate the variability of any portfolio of stocks or bonds
by the procedure just described. You would identify the possible outcomes, assign
a probability to each outcome, and grind through the calculations. But where do
the probabilities come from? You can’t look them up in the newspaper; newspa-
pers seem to go out of their way to avoid definite statements about prospects for
securities. We once saw an article headlined “Bond Prices Possibly Set to Move
Sharply Either Way.” Stockbrokers are much the same. Yours may respond to your
query about possible market outcomes with a statement like this:
The market currently appears to be undergoing a period of consolidation. For the in-
termediate term, we would take a constructive view, provided economic recovery
CHAPTER 7 Introduction to Risk, Return, and the Opportunity Cost of Capital 163
(1) (2) (3) (5)
Percent Deviation Squared Probability ⴛ
Rate of from Expected Deviation (4) Squared
Return (
˜
r) Return (
˜
r ⴚ r)(
˜
r ⴚ r)
2
Probability Deviation
⫹40 ⫹30 900 .25 225
⫹10 0 0 .5 0
⫺20 ⫺30 900 .25 225
Variance ⫽ expected value of (
˜
r ⫺ r)
2
⫽ 450
Standard deviation ⫽ 2variance
⫽ 2450 ⫽ 21
TABLE 7.2
The coin-tossing
game: Calculating
variance and
standard deviation.
13
Which of the two we use is solely a matter of convenience. Since standard deviation is in the same
units as the rate of return, it is generally more convenient to use standard deviation. However, when
we are talking about the proportion of risk that is due to some factor, it is usually less confusing to work
in terms of the variance.
14
As we explain in Chapter 8, standard deviation and variance are the correct measures of risk if the re-
turns are normally distributed.

Brealey−Meyers:
Principles of Corporate
Finance, Seventh Edition
II. Risk 7. Introduction to Risk,
Return, and the Opportunity
Cost of Capital
© The McGraw−Hill
Companies, 2003
continues. The market could be up 20 percent a year from now, perhaps more if in-
flation continues low. On the other hand, . . .
The Delphic oracle gave advice, but no probabilities.
Most financial analysts start by observing past variability. Of course, there is no
risk in hindsight, but it is reasonable to assume that portfolios with histories of
high variability also have the least predictable future performance.
The annual standard deviations and variances observed for our five portfolios
over the period 1926–2000 were:
15
164 PART II Risk
Portfolio Standard Deviation () Variance (
2
)
Treasury bills 3.2 10.1
Government bonds 9.4 88.7
Corporate bonds 8.7 75.5
Common stocks (S&P 500) 20.2 406.9
Small-firm common stocks 33.4 1118.4
15
Ibbotson Associates, Inc., 2001 Yearbook. In discussing the riskiness of bonds, be careful to specify the
time period and whether you are speaking in real or nominal terms. The nominal return on a long-term
government bond is absolutely certain to an investor who holds on until maturity; in other words, it is
risk-free if you forget about inflation. After all, the government can always print money to pay off its
debts. However, the real return on Treasury securities is uncertain because no one knows how much
each future dollar will buy.
The bond returns reported by Ibbotson Associates were measured annually. The returns reflect year-
to-year changes in bond prices as well as interest received. The one-year returns on long-term bonds are
risky in both real and nominal terms.
16
You may have noticed that corporate bonds come in just ahead of government bonds in terms of low
variability. You shouldn’t get excited about this. The problem is that it is difficult to get two sets of bonds
that are alike in all other respects. For example, many corporate bonds are callable (i.e., the company has
an option to repurchase them for their face value). Government bonds are not callable. Also interest
payments are higher on corporate bonds. Therefore, investors in corporate bonds get their money
sooner. As we will see in Chapter 24, this also reduces the bond’s variability.
17
These estimates are derived from monthly rates of return. Annual observations are insufficient for es-
timating variability decade by decade. The monthly variance is converted to an annual variance by mul-
tiplying by 12. That is, the variance of the monthly return is one-twelfth of the annual variance. The
longer you hold a security or portfolio, the more risk you have to bear.
This conversion assumes that successive monthly returns are statistically independent. This is, in
fact, a good assumption, as we will show in Chapter 13.
Because variance is approximately proportional to the length of time interval over which a security
or portfolio return is measured, standard deviation is proportional to the square root of the interval.
As expected, Treasury bills were the least variable security, and small-firm stocks were
the most variable. Government and corporate bonds hold the middle ground.
16
You may find it interesting to compare the coin-tossing game and the stock
market as alternative investments. The stock market generated an average an-
nual return of 13.0 percent with a standard deviation of 20.2 percent. The game
offers 10 and 21 percent, respectively—slightly lower return and about the same
variability. Your gambling friends may have come up with a crude representation
of the stock market.
Of course, there is no reason to believe that the market’s variability should stay
the same over more than 70 years. For example, it is clearly less now than in the
Great Depression of the 1930s. Here are standard deviations of the returns on the
S&P index for successive periods starting in 1926.
17

Brealey−Meyers:
Principles of Corporate
Finance, Seventh Edition
II. Risk 7. Introduction to Risk,
Return, and the Opportunity
Cost of Capital
© The McGraw−Hill
Companies, 2003
These figures do not support the widespread impression of especially volatile
stock prices during the 1980s and 1990s. These years were below average on the
volatility front.
However, there were brief episodes of extremely high volatility. On Black Mon-
day, October 19, 1987, the market index fell by 23 percent on a single day. The stan-
dard deviation of the index for the week surrounding Black Monday was equiva-
lent to 89 percent per year. Fortunately, volatility dropped back to normal levels
within a few weeks after the crash.
How Diversification Reduces Risk
We can calculate our measures of variability equally well for individual securities
and portfolios of securities. Of course, the level of variability over 75 years is less
interesting for specific companies than for the market portfolio—it is a rare com-
pany that faces the same business risks today as it did in 1926.
Table 7.3 presents estimated standard deviations for 10 well-known common
stocks for a recent five-year period.
18
Do these standard deviations look high to you?
They should. Remember that the market portfolio’s standard deviation was about 13
percent in the 1990s. Of our individual stocks only Exxon Mobil came close to this fig-
ure. Amazon.com was about eight times more variable than the market portfolio.
Take a look also at Table 7.4, which shows the standard deviations of some well-
known stocks from different countries and of the markets in which they trade.
Some of these stocks are much more variable than others, but you can see that once
again the individual stocks are more variable than the market indexes.
This raises an important question: The market portfolio is made up of individ-
ual stocks, so why doesn’t its variability reflect the average variability of its com-
ponents? The answer is that diversification reduces variability.
CHAPTER 7
Introduction to Risk, Return, and the Opportunity Cost of Capital 165
Market Standard
Period Deviation (
m
)
1926–1930 21.7
1931–1940 37.8
1941–1950 14.0
1951–1960 12.1
1961–1970 13.0
1971–1980 15.8
1981–1990 16.5
1991–2000 13.4
Standard Standard
Stock Deviation () Stock Deviation ()
Amazon.com* 110.6 General Electric 26.8
Boeing 30.9 General Motors 33.4
Coca-Cola 31.5 McDonald’s 27.4
Dell Computer 62.7 Pfizer 29.3
Exxon Mobil 17.4 Reebok 58.5
TABLE 7.3
Standard deviations for
selected U.S. common stocks,
August 1996–July 2001 (figures
in percent per year).
*June 1997–July 2001.
18
These standard deviations are also calculated from monthly data.

Brealey−Meyers:
Principles of Corporate
Finance, Seventh Edition
II. Risk 7. Introduction to Risk,
Return, and the Opportunity
Cost of Capital
© The McGraw−Hill
Companies, 2003
Even a little diversification can provide a substantial reduction in variability.
Suppose you calculate and compare the standard deviations of randomly chosen
one-stock portfolios, two-stock portfolios, five-stock portfolios, etc. A high pro-
portion of the investments would be in the stocks of small companies and indi-
vidually very risky. However, you can see from Figure 7.6 that diversification can
cut the variability of returns about in half. Notice also that you can get most of this
benefit with relatively few stocks: The improvement is slight when the number of
securities is increased beyond, say, 20 or 30.
Diversification works because prices of different stocks do not move exactly
together. Statisticians make the same point when they say that stock price
changes are less than perfectly correlated. Look, for example, at Figure 7.7. The
top panel shows returns for Dell Computer. We chose Dell because its stock has
166 PART II
Risk
Standard Standard Standard Standard
Deviation Deviation Deviation Deviation
Stock () Market () Stock () Market ()
Alcan 31.0 Canada 20.7 LVMH 41.9 France 21.5
BP Amoco 24.8 UK 14.5 Nestlé 19.7 Switzerland 19.0
Deutsche Bank 37.5 Germany 24.1 Nokia 57.6 Finland 43.2
Fiat 38.1 Italy 26.7 Sony 46.3 Japan 18.2
KLM 39.6 Netherlands 20.6 Telefonica 45.4 Argentina 34.3
de Argentina
TABLE 7.4
Standard deviation for selected foreign stocks and market indexes, September 1996–August 2001 (figures in percent
per year).
Number of
securities
0
10
2
Standard deviation,
percent
4 6 8 10 12 14 16 18 20
20
30
40
50
FIGURE 7.6
The risk (standard
deviation) of randomly
selected portfolios
containing different
numbers of New York
Stock Exchange stocks.
Notice that diversification
reduces risk rapidly at
first, then more slowly.
Source: M. Statman, “How
Many Stocks Make a Diversi-
fied Portfolio?” Journal of
Financial and Quantitative
Analysis 22 (September 1987),
pp. 353–363.