Blank L., Tarquin A. Engineering Economy (McGraw-Hill Series in Industrial Engineering and Management)
Подождите немного. Документ загружается.

SECTION
19
.2 Elements Important to Decision Making Under
Ri
sk
F(C
I
)
1.0
0.8
0.6
0.4
f(CI)
o:t
0.2
0
10
15
to
12
15
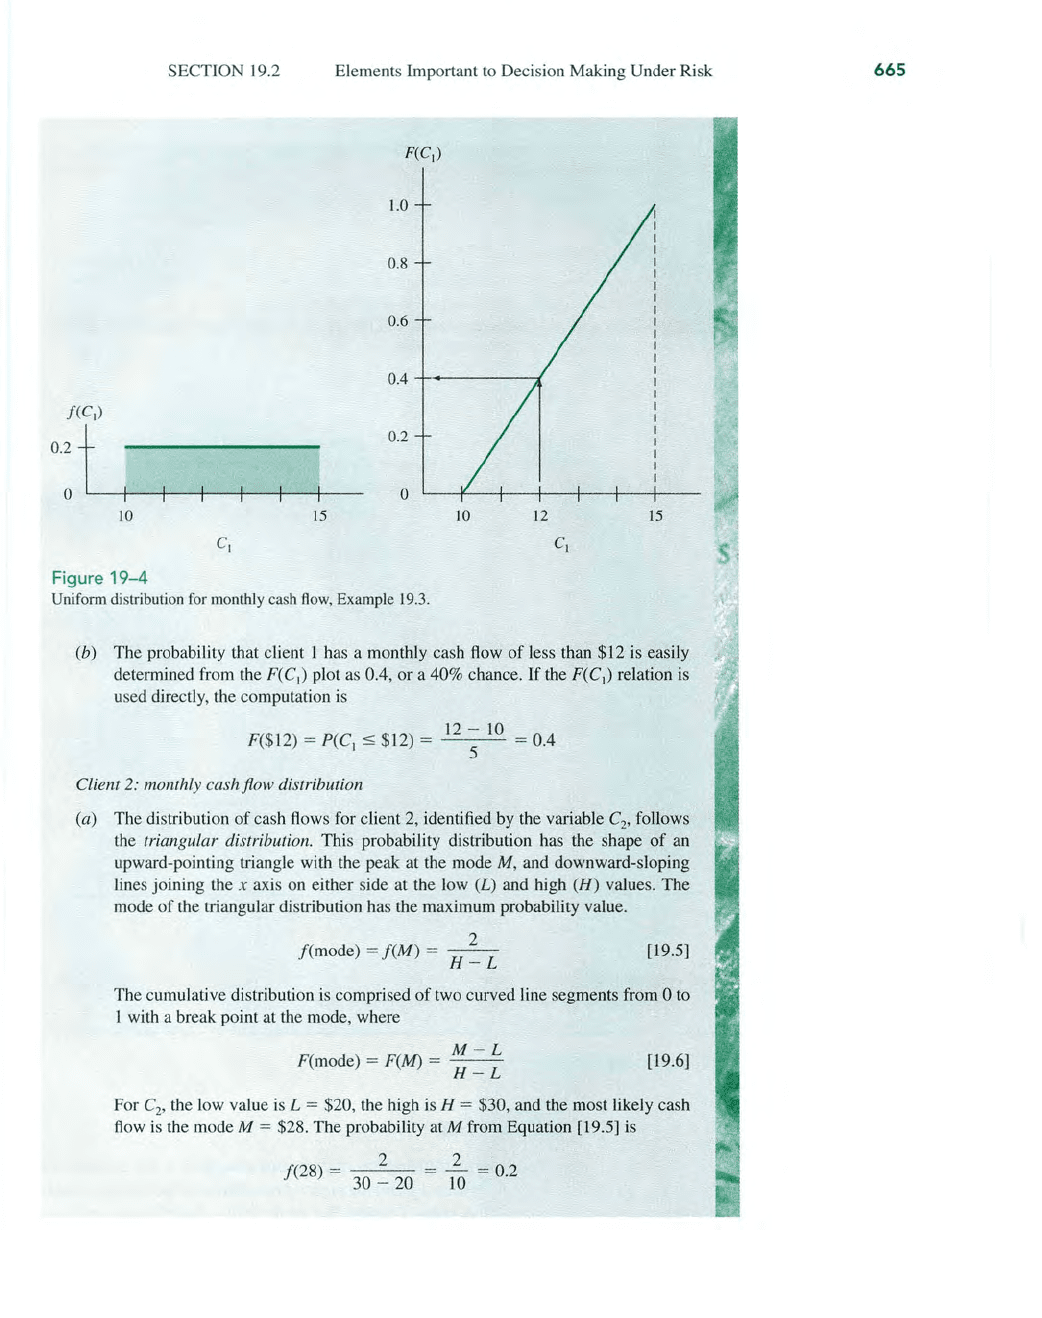
Figure
19-4
Uniform
di
stribution for monthly cash
flow
, Example 19.3.
(b)
The
probability that client 1 has a monthly cash flow
of
less than $12 is easily
determined from the
F(
C
I
)
plot as 0.4, or a 40% chance.
If
the
F(
C
j
) relation is
used directly, the computation is
12 -
10
F($12) =
P(CI
~
$12) = 5 = 0.4
Client 2: monthly cash flow distribution
(a)
The
distribution
of
cash flows for client 2, identified by the variable C
2
'
follows
the
triangular distribution. This probability distribution has the shape
of
an
upward-pointing triangle with the peak
at
the mode M, and downward-sloping
lines joining the
x axis on either side at the low (L) and high
(H)
values.
The
mode
of
the triangular
di
stribution has the maximum probability value.
2
f(mode)
=
f(M)
=
--
H-L
[19.5]
The cumulative distribution is comprised
of
two curved line segments from 0 to
1 with a break point at the mode, where
M-L
F(mode) =
F(M)
= - -
H-L
[19.6]
For
C
2
'
the low value
is
L = $20, the high is H = $30, and the most likely cash
flow
is
the mode M = $28.
The
probability at M from Equation [19.5] is
f(28) = 2 =
~
= 0.2
30
- 20 10
665
666
CHAPTER
19
More on Variation a
nd
Decision Making Under Risk
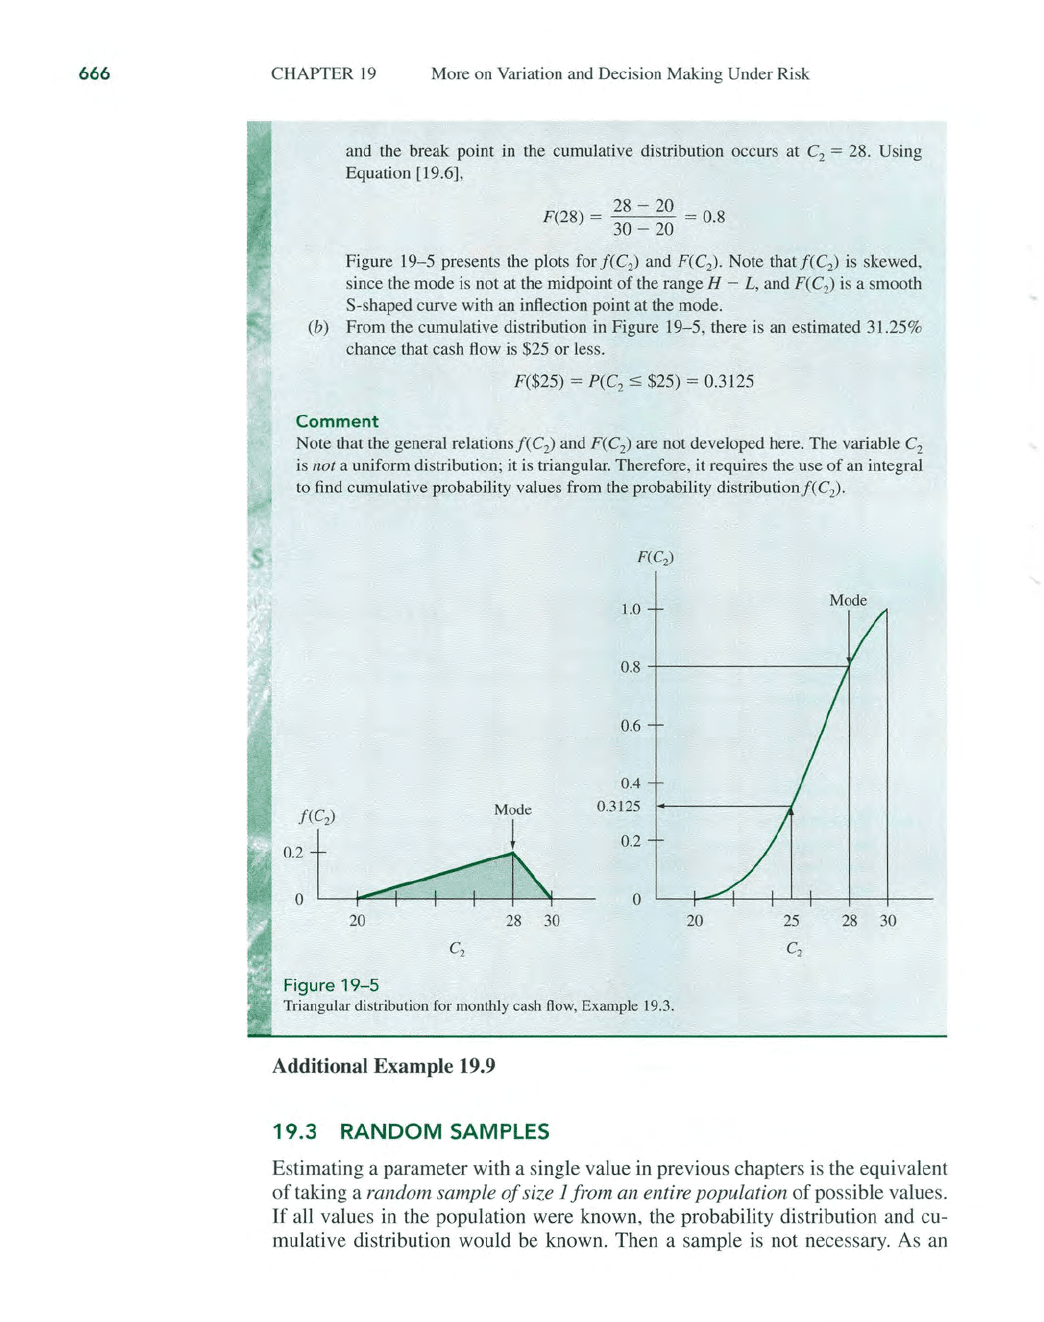
and the break point in the cumulative distribution occurs at C
2
= 28. Using
Equation [19.6],
F(28) = 28 - 20 = 0.8
30 - 20
Figure 19-5 presents the plots for
f(C
2
) and
F(C
2
).
Note
thatf(C
2) is skewed,
since the mode is not at the midpoint
of
the range H - L, and
F(C
2
)
is
a smooth
S-shaped curve with
an
inflection point at the mode.
(b) From the cumulative distribution in Figure
19-5
, there is an estimated 31.25%
chance that cash flow is $25
or
less.
F($25) =
P(C
z
:s $25) = 0.3125
Comment
Note that the general
relationsf
(C
z)
and
F(C
2
)
are not developed here. The variable C
2
is not a uniform distribution; it is triangular. Therefore, it requires the use
of
an
integral
to find cumulative probability va]ues from the probability distributionf(C
2
).
F(
C.
)
1.0
0.8
0.6
0.4
0.3125
0.2
0
f (C
2
)
Mr
e
o:t
~
20
28
30
Figure
19-5
Triangular distribution for monthly cash flow, Example 19.3.
Additional Example 19.9
19.3 RANDOM
SAMPLES
20
25
C
2
Mode
28
30
Estimating a parameter with a single value in previous chapters is the equivalent
of
taking a random sample
of
size 1 from an entire population
of
possible value
s.
If
all values in the population were known, the probability distribution and cu-
mulative distribution would be known. Then a sample is not necessary. As an
SECTION
19.3
Random Samples
illustration, assume that estimates
of
first cost, annual operating cost, interest
rate, and other parameters are used to compute one
PW
value in order to accept
or reject an alternative. Each estimate
is
a sample
of
size 1 from an entire popu-
lation
of
possible values for each parameter. Now,
if
a second estimate is made
for each parameter and a second
PW
value is determined, a sample
of
size 2 has
been taken.
Whenever we perform an engineering economy study and utilize decision
making under certainty, we use one estimate for each parameter to calculate a
measure
of
worth (i.e., a sample
of
size 1 for each parameter). The estimate is the
most likely value, that is, one estimate
of
the expected value. We know that all
parameters will vary somewhat; yet some are important enough,
or
will vary
enough, that a probability distribution should be determined or assumed for it
and the parameter treated as a random variable. This is using risk, and a sample
from the parameter's probability
distribution-P(X)
for discrete or
I(X)
for con-
tinuous-helps
formulate probability statements about the estimates. This ap-
proach complicates the analysis somewhat; however, it also provides a sense
of
confidence (or possibly a lack
of
confidence in some cases) about the decision
made concerning the economic viability
of
the alternative based on the varying
parameter. (We will further discuss this aspect later, after we learn how to cor-
rectly take a random sample from any probability distribution.)
A random sample of size n
is
the selection in a
random
fashion
of
n values
from a population with an assumed
or
known probability distribution,
such
that
the values of the variable have the same chance of occurring in
the sample as they
are
expected to
occur
in the population.
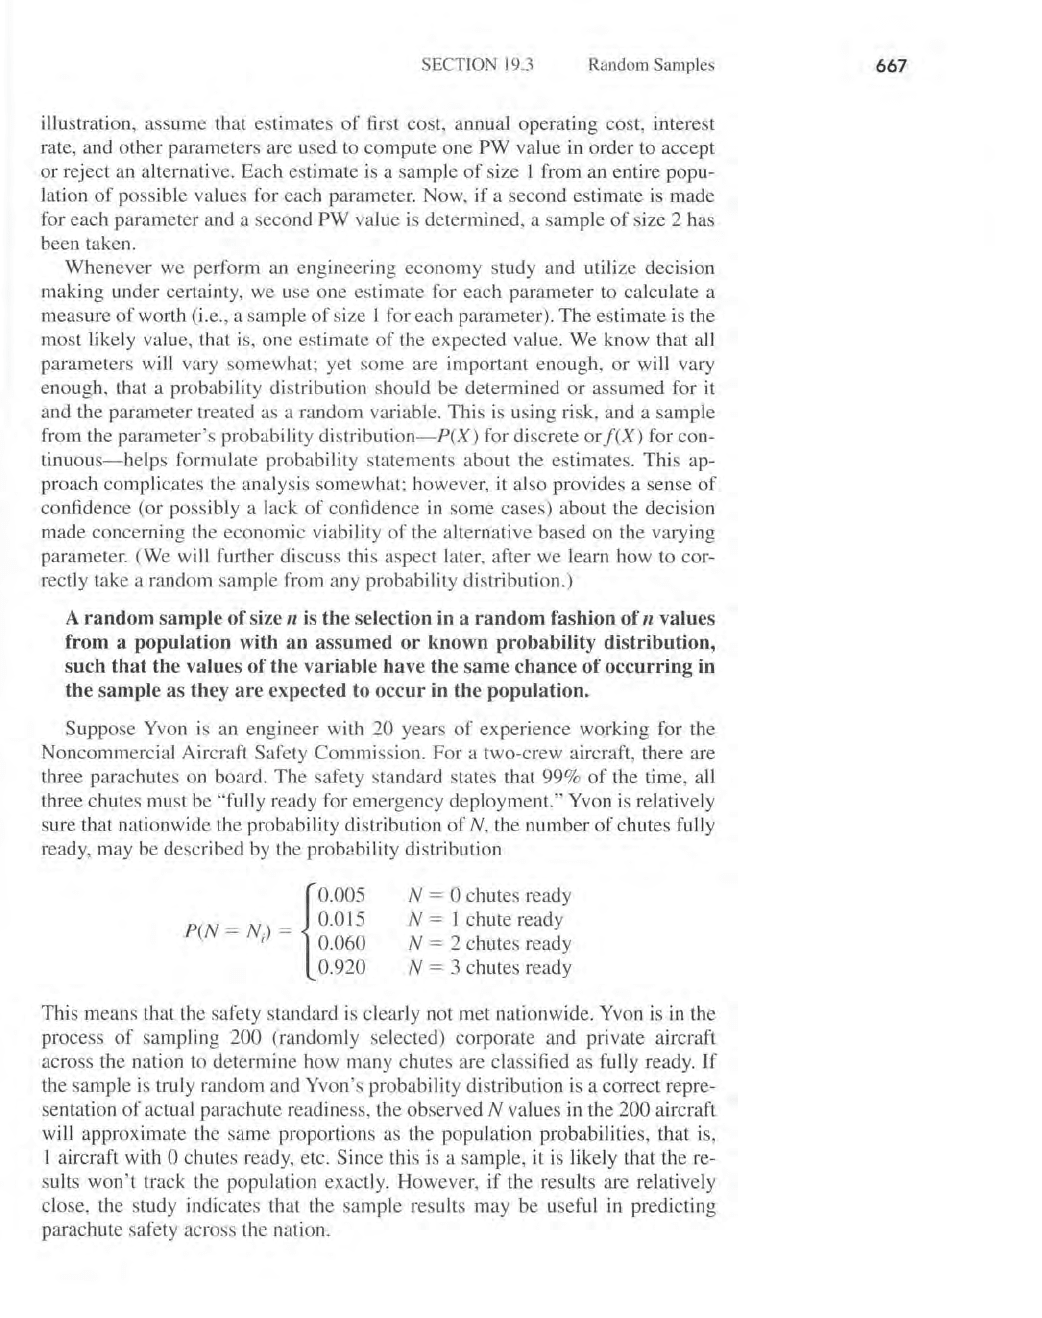
Suppose Yvon is an engineer with 20 years
of
experience working for the
Noncommercial Aircraft Safety Commission. For a two-crew aircraft, there are
three parachutes on board. The safety standard states that 99%
of
the time, all
three chutes must be
"fully ready for emergency deployment." Yvon
is
relatively
sure that nationwide the probability distribution
of
N, the number
of
chutes fully
ready, may be described by the probability distribution
{
o.oos
peN =
N)
= 0.015
I 0.060
0.920
N = ° chutes ready
N = I chute ready
N = 2 chutes ready
N = 3 chutes ready
This means that the safety standard
is
clearly not met nationwide. Yvon is in the
process
of
sampling 200 (randomly selected) corporate and private aircraft
across the nation to determine how many chutes are classified as fully ready.
If
the sample
is
truly random and Yvon's probability distribution is a correct repre-
sentation
of
actual parachute readiness, the observed N values in the 200 aircraft
will approximate the same proportions
as
the population probabilities, that is,
1 aircraft with
a chutes ready, etc. Since this is a sample, it is likely that the re-
sults won't track the population exactly. However,
if
the results are relatively
close, the study indicates that the sample results may be useful in predicting
parachute safety across the nation.
667
668
CHAPTER
19
More
on Variation and Decision Making Under Risk
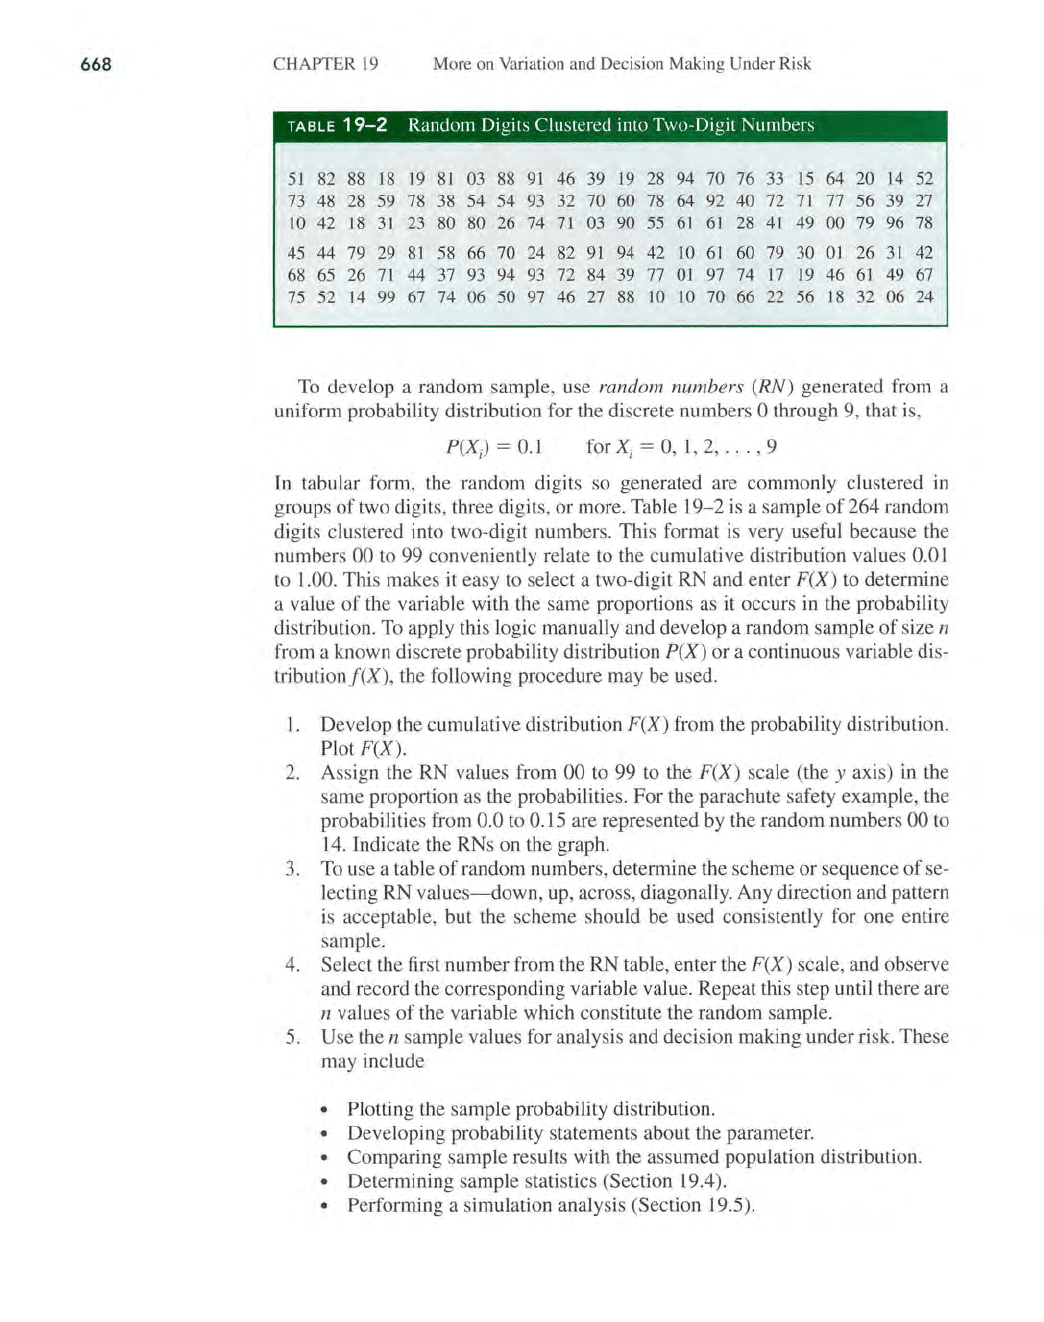
TABLE
19-2
Random Digits Clustered into Two-Digit Numbers
51
82
88
18
19
81
03
88
91
46
39
19
28
94
70 76
33
15
64
20
14
52
73
48
28
59
78
38
54 54
93
32
70
60
78
64
92
40
72
71
77
56
39
27
10
42
18
31
23
80
80
26
74
71
03
90
55
61
61
28
41
49
00
79
96
78
45
44
79
29
81
58
66
70
24
82
91
94
42
10
61
60
79
30
01
26
31
42
68
65
26
71
44
37
93
94
93
72
84
39
77
01
97
74
17
19
46
61
49
67
75
52
14
99
67
74
06
50
97
46
27
88
10
10
70
66
22
56
18
32
06
24
To
develop a random sample, use random numbers (RN) generated from a
uniform probability distribution for the discrete numbers
0 through 9, that
is
,
P(X)
=
0.1
for
Xi
= 0, 1
,2,
.
..
,9
In tabular form, the random digits so generated are commonly clustered
in
groups
of
two digits, three digits, or more. Table 19-2
is
a sample
of
264 random
digits clustered into two-digit numbers. This format
is
very useful because the
numbers
00 to 99 conveniently relate
to
the cumulative distribution values 0.01
to
1.00. This makes it easy
to
select a two-digit RN and enter
F(X)
to determine
a value
of
the variable with the same proportions
as
it occurs in the probability
distribution.
To
apply this logic manually and develop a random sample
of
size n
from a known discrete probability distribution
P(X)
or a continuous variable dis-
tributionj(X), the following procedure may be used.
1.
Develop the cumulative distribution
F(X)
from the probability distribution.
Plot
F(X)
.
2.
Assign the RN values from 00 to 99
to
the
F(X)
scale (the y axis) in the
same proportion
as
the probabilities. For the parachute safety example, the
probabilities from
0.0 to 0.
15
are represented by the random numbers 00
to
14.
Indicate the RNs on the graph.
3.
To
use a table
of
random numbers, determine the scheme or sequence
of
se-
lecting RN
values-down
, up, across, diagonally. Any direction and pattern
is
acceptable, but the scheme should be used consistently for one entire
sample.
4.
Select the first number from the RN table, enter the
F(X)
scale, and observe
and record the corresponding variable value. Repeat this step until there are
n values
of
the variable which constitute the random sample.
5.
Use the n sample values for analysis and decision making under risk. These
may include
• Plotting the sample probability distribution.
• Developing probability statements about the parameter.
• Comparing sample results with the assumed population distribution.
• Determining sample statistics (Section 19.4).
• Performing a simulation analysis (Section
19
.5).
SECTION 19.3 Random Samples
EXAMPLE
19.4
;C;
Develop a random sample
of
size
10
for the variable
N,
number
of
months, as described
by
the probability distribution
Solution
{
0.20
peN =
N)
= 0.50
0.30
N=
24
N =
30
N = 36
Apply the procedure above, using the peN =
N)
values in Equation [19.7]
[19.7]
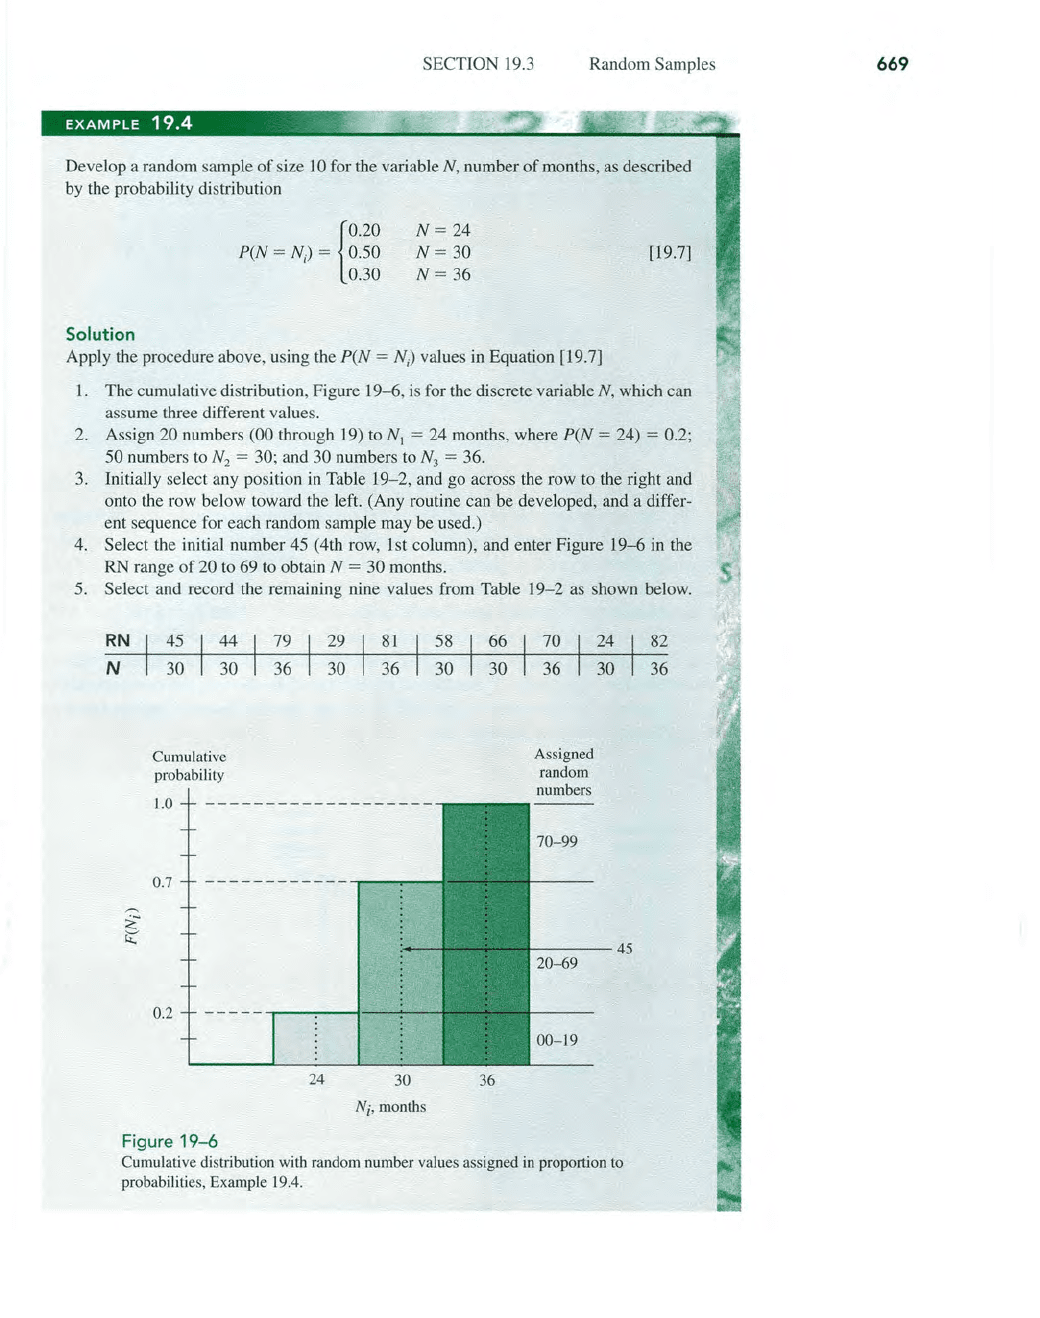
I.
The cumulative distribution, Figure 19-6,
is
for the discrete variable N, which can
assume three different values.
2.
Assign 20 numbers (00 through 19)
to
N
J
= 24 months, where peN = 24) = 0.2;
50
numbers
to
N2 = 30; and 30 numbers
to
N3
= 36.
3.
Initially select any position in Table 19-2, and go across the row
to
the right and
onto the row below toward the left. (Any routine can be developed, and a differ-
ent sequence for each random sample may be used.)
4.
Select the initial number 45 (4th row, 1st column), and enter Figure 19-6 in the
RN range
of
20
to
69
to
obtain N = 30 months.
5.
Select and record the remaining nine values from Table
19
-2
as shown below.
RN
N
Cumulative
probability
1.0
0.7
------------
,---~~
0.2
24
30
Ni
, months
Figure
19-6
36
Assigned
random
numbers
70-99
----45
20-69
00-19
Cumulative distribution with random number values assigned
in
proportion to
probabilities, Example 19.4.
669
670
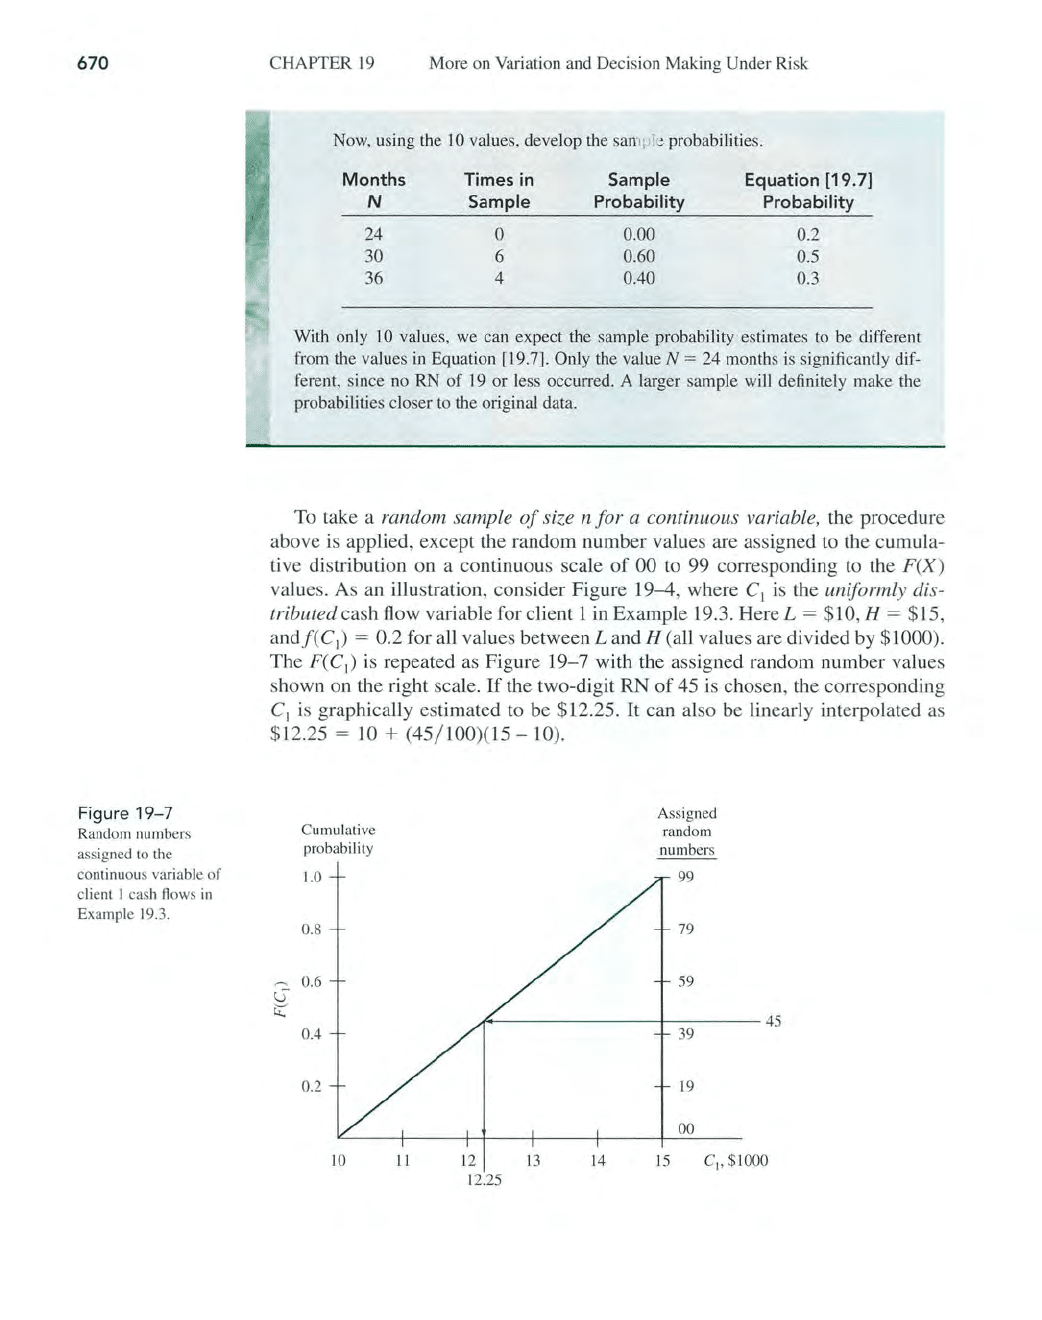
Figure
19-7
Rand
om
nu
mbers
ass
igned to
th
e
continuous variable of
cli
e
nt
I
cas
h
fl
ows in
E
xa
mple 19.
3.
CHAPTER 19 More on
Vari
ation and Decision Making Under Risk
Now, using
th
e 10 values, develop
th
e sample p
ro
babilities.
Months Times
in
Sample Equation [19.
7)
N Sample Probability
Probability
24
0
0.
00
0.2
30
6 0.60 0.5
36
4
DAD
0.3
With only 10 values, we can ex pect the sample probabili
ty
estimates to be different
from the values
in
E
qu
a
ti
on [19.7]. Only the value N = 24 months is significantly dif-
ferent, since no RN
of
J 9 or less occu
rr
ed. A larger sample
wi
ll
definitely make the
probabilities closer to the o
ri
ginal dat
a.
To
take a random sample
of
size n for a continuous variable, the procedure
above is applied, except the random
nu
mber va
lu
es are assigned to the cumula-
tive distribution on a conti
nu
ous scale
of
00
to
99 corresponding
to
the
F(X
)
values. As an illustration, consider Figure 19-4, where
C]
is the uniformly dis-
tributed
cash flow variable for client 1
in
Example
19
.3. Here L = $10, H = $15,
an
df(C
I
)
= 0.2 for all values between
Land
H (all values are divided
by
$
10
00).
The
F(C
I
)
is
repeated
as
Figure
19-
7 with the assigned random number values
shown on the right scale.
If
the two-digit RN
of
45 is chosen, the corresponding
C
I
is
graphica
ll
y estimated
to
be $12.25.
It
can also be linearly interpolated as
$ l2.25
= ]0 + (45/ 100)(15
-10).
Cumul
at
i
ve
probabil
it
y
1.0
0
.8
~
0.6
U
1:(
0.4
0.2
10 I I 12
12.25
13 14
Assign
ed
random
numbers
99
79
59
45
39
19
00
15
C
1
•
$1000
SECTION 19.4 Expected Value and Standard Deviation
For greater accuracy when developing a random sample, especially for a con-
tinuous variable, it
is
possible to use 3-, 4-, or 5-digit RNs. These can be developed
from Table
19-2
simply by combining digits in the columns and rows
or
obtained
from tables with RNs printed
in
larger clusters
of
digit
s.
In computer-based sam-
pling, most simulation software packages have an RN generator built in which will
generate values
in
the range
of
0 to 1 from a continuous variable uniform distribu-
~
tion, usually identified by the symbol
U(O,
1). The
RN
values, usually between
~
0.00000 and 0.99999, are used to sample directly from the cumulative distribution E-Sol
ve
employing essentially the same procedure explained here. The Excel functions
RAND and RANDBETWEEN are described in Appendix A, Section A.3.
An initial question in random sampling usually concerns the minimum size
of
n required to ensure confidence in the results. Without detailing the mathemati-
cal logic, sampling theory, which is based upon the law
of
large numbers and the
central-limit theorem (check a basic statistics book to learn about these), indi-
cates that an n
of
30
is
sufficient. However, since reality does not follow theory
exactly, and since engineering economy often deals with sketchy estimates, sam-
ples in the range
of100
to 200 are the common practice. But samples
as
small as
10 to
25
provide a much better foundation for decision making under risk than
the single-point estimate for a parameter that is known to vary widely.
19.4
EXPECTED VALUE
AND
STANDARD DEVIATION
Two very important measures or properties
of
a random variable are the expected
value and standard deviation.
If
the entire population for a variable were known,
these properties would be calculated directly. Since they are usually not known,
random samples are commonly used to estimate them via the sample mean and
the sample standard deviation, respectively. The following is a brief introduction
to the interpretation and calculation
of
these properties using a random sample
of
size n from the population.
The usual symbols are Greek letters for the true population measures and En-
glish letters for the sample estimates.
Expected val
ue
Standard deviation
True P
opul
ation
Measure
Sy
mbol
Name
fJ..
or E(X)
(J" or YVar(X)
orW
Mu
or
true mean
Sigma or true
standard deviation
Sample Esti
mate
Symb
ol
Na
me
X Sample mean
s or W Sample standard
deviation
The
expected value is the long-run expected average
if
the
variable
is
sampled
many
times.
The population expected value
is
not known exactly, since the population itself
is
not known completely, so
f.L
is estimated either by
E(X)
from a distribution or
by
X, the sample mean. Equation [18.2], repeated here as Equation [19.8],
is
used
Expected
value
671
672
CHAPTER
19
More
on Variation and Decision Making Under Risk
to compute the
E(X)
of
a probability distribution, and Equation [19.9] is the sam-
ple mean, also called the sample average.
Population:
Probability distribution:
Sample:
x =
sum
of
sample values
sample size
= LXi =
L
f~
i
n n
[19.8]
[19.9]
The
/;
in the second form
of
Equation [19.9] is the frequency
of
Xi' that is, the
number
of
times each value occurs in the sample. The resulting X is not neces-
sarily an observed value
of
the variable; it
is
the long-run average value and can
take on any value within the range
of
the variable.
(We
omit the subscript i on X
andfwhen
there
is
no confusion introduced.)
Kayeu, an engineer with Pacific
NW
Utilities, is planning to test several hypotheses
about residential electricity bills
in
North American and Asian countries.
The
variable
of
interest is
X,
the monthly residential bill in U.S. dollars (rounded to the neare
st
dollar). Two small samples have been collected from different countries
of
North Amer-
ica and Asia. Estimate the population expected value.
Do
the samples (from a nonsta-
tistical viewpoint) appear to be drawn from
one
population
of
electricity bills
or
from
two different populations?
North American, Sample 1, $
Asian,
Samp
le 2, $
Solution
Use Equation [19.9] for the sample mean.
Sample
1:
n=7
Samp
le 2:
n=5
IX;
= 814
IX;
= 655
X = $116.29
X = $131.00
275
Based solely on the small sample averages, the approximate $15 difference, which is
less than 10%
of
the smaller average bill, does not seem sufficiently large to conclude
th
at
the two popUlations are different. There are several statistical tests available to de-
termine
if
samples
come
from the same
or
different populations. (Check a basic statis-
tics text to learn about them.)
Comment
There
are three commonly used measures
of
central tendency for data.
The
sample
average is the most popular, but the
mode
and
the median are also good measures.
The
mo
de, which
is
the
most
frequently observed value, was utilized
in
Example
19.3
for a triangular distribution.
There
is no specific
mode
in Kayeu
's
two samples, since all
SECTION 19.4 Expected Value and Standard Deviation
values are different. The median
is
the middle value
of
the sample. It is
not
biased by
extreme sample values,
as
is the mean. The two medians in the samples are $92 and
$104. Based solely on the medians, the conclusion is still that the samples do not nec-
essarily come from two different populations
of
electricity bills.
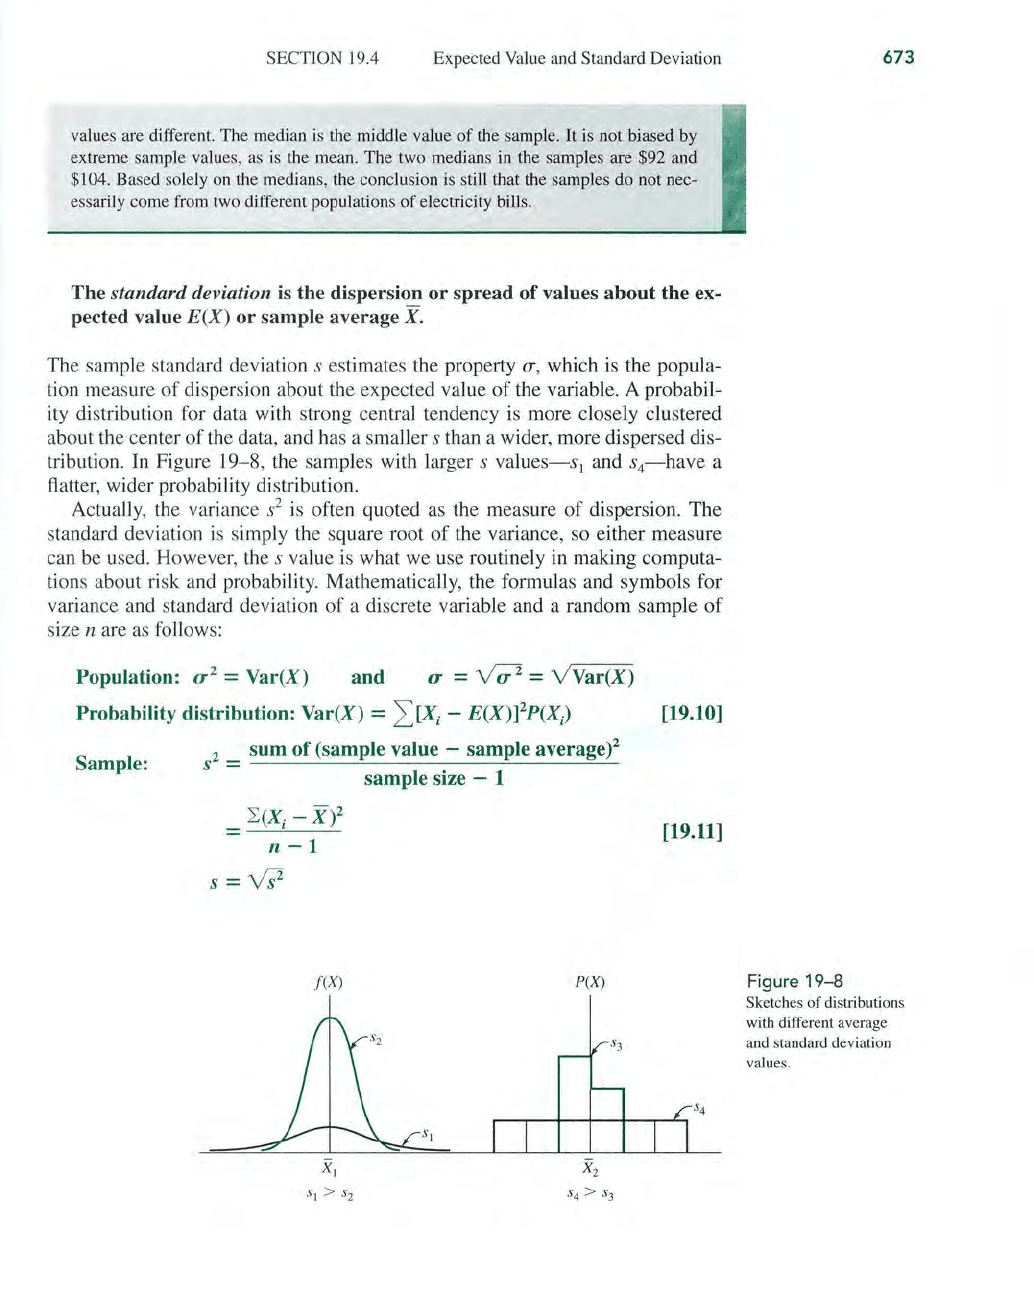
The
standard deviation is the dispersion
or
spread
of
values
about
the ex-
pected value
E(X)
or
sample average
X.
The sample standard deviation s estimates the property
(T,
which is the popula-
tion measure
of
dispersion about the expected value
of
the variable. A probabil-
ity distribution for data with strong central tendency is more closely clustered
about the center
of
the data, and has a smaller s than a wider, more dispersed dis-
tribution. In Figure
19-8, the samples with larger s
values-s)
and
s4-have
a
flatter, wider probability distribution.
Actually, the variance
i is often quoted as the measure
of
dispersion.
The
standard deviation is simply the square root
of
the variance, so either measure
can be used. However, the s value is what we use routinely in making computa-
tions about risk and probability. Mathematically, the formulas and symbols for
variance and standard deviation
of
a discrete variable and a random sample
of
size n are
as
follows:
Population:
0'
2 = Var(X)
and
0'
=
y-;;z
=
v'Var(X)
Probability distribution: Var(X) =
~
)Xi
-
E(X)]2p(X)
[19.10]
Sample:
2
sum
of
(sample value - sample average)2
s
=
L(X. -
xi
- ,
n
-1
s=W
f(X)
XI
SI > S2
sample size - 1
P(X)
S3
X
2
S4>
S3
[19.11]
S4
673
Fi
gure 1
9-8
Sketches
of
distributions
with different average
and standard deviation
values.
674
CHAPTER
19
More
on
Variation and Decision Making Under Risk
Equation [19.11] for sample variance
is
usually applied in a more computation-
ally convenient form.
2 _
I,
X
7 n
-2
_
I,fX
2
n-
2
s -
--
- -
-X
-
=u.:.::..L
-
--
X [19
12]
n-l n-l
n-l
n-1
.
The standard deviation uses the sample average
as
a basis about which
to
mea-
sure the spread or dispersion
of
data via the calculation
eX
- X), which can have
a minus or plus sign.
To
accurately measure the dispersion in both directions
from the average, the quantity
eX
- X) is squared.
To
return to the dimension of
the variable itself, the square root
of
Equation [19.11]
is
extracted. The term
eX
- X)2 is called the mean-squared deviation, and s has historically also been
referred
to
as
the root-mean-square deviation. The f
in
the second form
of
Equa-
tion [19.12] uses the frequency
of
each
Xi
value to calculate S2.
One simple way
to
combine the average and standard deviation is
to
deter-
mine the percentage or fraction
of
the sample that is
within::':::
1,
::':::
2,
or
::':::
3 stan-
dard deviations
of
the average, that is,
X ±
ts
for t = 1, 2, or 3 [19.13]
In probability terms, this is stated
as
peX
-
ts
::;
X ::; X + ts)
[19.14]
Virtually all the sample values will always be within the
::':::3s
range
of
X,
but the
percent
within::':::
Is will vary depending on how the data points are distributed
about
X. The following example illustrates the5alculation
of
s
to
estimate
cr,
and
incorporates
s with the sample average using X
::':::
ts.
(a) Use the two samples
of
Example
19
.5
to estimate population variance and standard
deviation for electricity bills.
(b) Determine the percentages
of
each sample that are in-
side the ranges
of
1 and 2 standard deviations from the mean.
Solution
(a) For illustration purposes only, apply the two different relations to calculate s for
the two samples. For sample 1 (North American) with n
=
7,
use X to identify
the values. Table 19-3 presents the computation
of
2:(X
- X)2 for Equation
[19.11], with
X = $116.29. The resulting
S2
and s values are
S2
= 37
,7:3.40
= 6290.57
S = $79.31
For sample 2 (Asian), use
Y
to
identify the values. With n = 5 and Y = 131,
Table 19--4 shows
2:y2
for Equation [19.l2]. Then
S2 = 97,041 _ 5 (131)2 = 42,260.25 - 1.25(17,161) = 2809
4 4
S = $53