Blank L., Tarquin A. Engineering Economy (McGraw-Hill Series in Industrial Engineering and Management)
Подождите немного. Документ загружается.


766
I
NDEX
N
11
, 23,26, 103-5.
See
al
so
In
terpolation
in in
terest rate
ta
bl
es; Least
co
mmon mul
ti
pl
e; Payback
analysis; Study pe
ri
od
Natural r
eso
urces. See De
pl
e
ti
on
Net cash
fl
ow, 31, 436,
57
4-
75
Net
in
co
me (NT
),
570
Net
in
vestment proce
dur
e, 25
6--
61
et operat
in
g pro
fi
t a
ft
er taxes (NOPAT), 570
Net present va
lu
e. See NPY func
ti
on;
Pr
esent worth
Net profit
af
ter taxes (N
PAT)
, 570, 602- 6
Net worth, 717
Nominal interest rate, 126, 128
annual, 13
0,
13 1
any payment period, 130, 131
of bonds, 196-
97
and eff
ec
ti
ve r
at
es, 133 (ta
bl
e), 1
38
Nonconventional cash
fl
ow se
ri
es, 249- 55
Noneconomic factors, 10
Nonrecurring cash
fl
ows, 180
No
nsimple cash
fl
ow series, 249-
55
No
-return (simple) payback, 1
86
-
87
No
rm
al dis
tri
bution,
66
3,
68
7-
91
Norstrom's c
ri
terion, 250, 593
otation
fo
r factors, 51, 58, 6 1,
67
,
72
NPER func
ti
on, 707- 8
and a
nn
ua
l worth, 2
.3
0
-3
1
and
un
known
11
, 77- 78
NPY f
un
ction, 708
a
ft
er-tax, 5
87
, 588
for ar
itJ
lme
ti
c gra
di
ents, 69
embedding
in
PMT, 227, 394, 703
geometric gradients, 73
independent projects, 430
and present worth, 197- 200
in
PY
vs.
i graphs, 245, 247
sensitiv
it
y analysis, 626, 628
and shift
in
g, 96, 9
8,
107,
110
-
11
o
Ob
solescence, 388
One-add
iti
onal-year re
pl
a
ce
ment studies, 398
Op
erating costs. See A
nn
ual operating costs;
Cos
t es
ti
mation
Op
erations phase, 191, 192-93
Opp
ortunity cost, 30, 352
and replacement analysis, 391, 405
Optimis
ti
c estimate, 629- 31
Overh
ea
d rates.
See
Indir
ec
t
co
sts
Owner
's
equity, 352, 717
p
P,
23, 26
P
IA
factor, 56- 57,
71
- 7
3.
See also
Geo
met
ri
c gradients;
Uniform se
ri
es,
pr
esent worth f
ac
tors
Parameter valiation, 622- 29
Payba
ck
analysis
calculation,
185- 89, 200- 20 I
definition, 185
limitations, 1
87
spreadsh
ee
t analysis, 2
00-
202
u
se
s, 186, 1
88
-
89
Payment pe
ri
od
of
bonds, 194
de
fin
ed, 136
equals compounding
per
iod, 142 (table)
Exce
l® func
ti
on, 708- 9
lon
ge
r than compounding pe
ri
od, 139-46
single amount,
13
9-42
, 147
-49
Payout pe
ri
od. See Payb
ack
analysis
Per
ce
nta
ge
de
pl
et
ion. S
ee
De
pl
e
ti
on
Pe
ri
odic cash
fl
ows
, 1
80-82
Permanent investments, 228-3J. See al
so
Capital cost
Perpe
tu
al inv
est
ment. See Capital cost
Personal property, 533, 541 , 545
-46
Perspec
ti
ve
and public sector,
316- 19
for replacement analysis, 389-90
Pessimistic estimate, 629-31
PIF factor, 50. See also Single-pay
ment
present
worth factor
PIG factor, 6
7.
See also Gradients, arithme
ti
c
Phaseout st
age
, 191
Phases of systems, 1
90-9
1
Pl
anning ho
ri
zon.
See
Study pe
ri
od
Plant costs, 505-7
PM
T function,
708-
9
and
af
ter-tax analysis, 587, 5
88
and annual worth, 225, 349
and arithme
ti
c gra
di
ents, 69
and B/C analysis, 323
and
ca
pital reco
ver
y, 223
and
ca
pi
ta
li
ze
d
co
st, 184-85
and
eco
nomic servi
ce
life, 393
a
nd
embedded
NP
V, 703
and ge
om
et
ric gradients, 73
and random s
in
gle amounts,
10
2- 3
and replacement anal
ys
is,
392-93
and s
hi
fted series,
96-98
, 106
a
nd
sinking fund factor, 62
and
uni
fo
rm
se
ri
es present worth, 59
Point estimates, 3 1, 632, 660
Power
law a
nd
siz
in
g model,
503-4
PPMT function, 709
Preferred
stock, 352, 359
Prese
nt
va
lu
e ne
t.
See NPY function; Prese
nt
worth
Prese
nt
worth, 170- 202
after-tax analysi
s,
586
-88
in
a
lt
ernative eva
lu
ation,
16
8
and annual worth, 2 18
assumption
s,
175
of
bo
nd
s,
1
94-97
a
nd
breakeven analysis,
451
and capital budget
in
g, 432
-3
6
of depreciation,
560
fo
r equal
li
ves, 1
72-74
eva
lu
a
ti
on me
th
od, 350 (ta
bl
e)
geometric gradient series, 7 1
-74
income taxes, 586
and independent projects, 428- 34
and inflation,
473-80
and
li
fe-cycle cost, 1
90
a
nd
mUlt
iple interest rates,
249-54
, 3
10
-
11
and rate
of
return,
244-47
,
283-9
1
and sens
iti
vity analysis, 623
-2
6
in
shifted se
ri
es,
94-96
in
simulation, 678, 679
s
in
gle-payme
nt
factor,
50
-52
for
un
equal
li
ves,
174
- 76
Prese
nt
-worth factors
gradie
nt
, 65-
71
s
in
gle-payment factor,
50-52
unifo
rm
-se
ri
es,
56-58
Proba
bi
I i
ty
in
decision
tr
ees,
637-40
defined
,632,66
1
a
nd
expected
va
lu
e, 634
-3
5,
67
1- 72
Probability distribution,
661
- 77
of
continuous va
ri
a
bl
es,
661
, 677
of
di
screte va
ri
a
bl
es,
662-63
a
nd
Excel®, 696
prope
rti
es, 673, 677
a
nd
samples, 667- 73
in
simulation, 678
Produc
ti
ve hour rate, 5
10
Profitability index, 238. See also Rate
of
return
INDEX
Profitabili
ty
ratios, 719
Profit-a
nd
-Ioss statement. See Income statement
Project net-inves
tm
ent,
256-6
1
Property class,
545-46
Property
of
indepe
nd
ent ra
nd
om
va
ri
a
bl
es, 677
Publjc sector projects, 314-19
a
nd
annual worth, 228
benefit/cost analysis, 3
19
-24
BOT
contracts, 319
capita
li
zed cost,
179
-8
5
est
im
a
ti
on, 315, 333, 499
joint ventures, 318
Purchas
in
g power, 480
-8
1,
482-83
PY f
un
c
ti
on, 26, 59, 709- 10
and bond
s,
197
a
nd
NPY
fu
nction, 708
and present worth, 349
and s
hi
fted uniform series,
111
and s
in
gle payment, 52, 55
and unifo
rm
se
ri
es present worth, 59
PW
vs
. i gra
ph
, 245, 287-
91
, 595
Q
Q-Sol
v,
28
Quick ratio,
720
R
r.
See Nominal interest rate
RAND function,
683-86,
710
Ra
nd
om number
s,
668 (table)
genera
ti
on, 7
10
Random samples,
666-71,
678
Random variables
continuous,
660, 661
,6
64-66
, 670- 71
,676-77
,
679-
80,696
cumulati ve distribution, 661- 66
di
screte, 660-
63
,
667-70
, 673- 76,
679-8
0
,696
expected va
lu
e, 67 1
-73
probabiljty
di
stribution
of
, 661 , 662
-63,
667,67
1
standard deviation,
673-73
Range, 676
Ra
nk
a
nd
rate technique, 369
Ranking
in
consisten
cy,
291
RATE function,
76-77
, 245, 710-
11
767
768
Rate
of
depreciation
declining balance, 537
MACRS, 562- 65
INDEX
straight line, 533
s
um
-of-year digits, 555-56
Rate
of
return. See also
In
cremental rate
of
return
after-tax, 588- 94
and annual worth, 248, 29 1- 92
on bonds, 26 1-
63
breakeven, 287, 591
in
capital budgeting, 432- 36
ca
uti
ons,
248-49
composite, 255- 61, 283
computer solutions, 245, 247, 248-49, 252, 253, 263
on
debt capital, 357- 59
d
efi
ned,
13,240
determin
in
g,
74-76,
242-49
on
equi
ty
cap
it
al, 359- 62
evaluation method,
350 (table)
in
Excel
®,
26, 706, 7 1
0-
11
external, 256
on extra investment, 282-
83
incremental, 278- 82
and
ind
ependent projects, 283
and inflation,
14
-
15
,473,482-83
in
stallment
fin
ancing, 24 1
-42
inte
rn
al, 75- 76, 255, 706- 7
minimum
attracti
ve
(see Minimum attractive ra
te
of
return)
multiple, 248, 249- 61
,273
- 75
and
mu
tu
ally exc
lu
sive a
lt
e
rn
atives, 278
and present worth, 242-47, 283-91
ranking
in
consistency, 29 1
a
nd
reinvestme
nt
rate, 256
and sens
iti
vity analysi
s,
623
Ratios, accountin
g,
719-23
Real interest rate, 473, 476, 478, 483
Real property, 533,
541-42
Reasonable estimate,
629-3
1
Recaptured de
pr
eciation
definition, 582
in
replacement studies, 595- 99
a
nd
taxes, 582, 586-87, 606
Reco
ve
ry
period
defined, 533
effect on taxes,
580-82
MACRS,
541
, 544,
545-46
,
561,570
straight
lin
e option, 549
Reco
ve
ry
rate. See Rate
of
depreciation
Recurring cash
fl
ows, 180
Reinvestment, assumption
in
capi
tal
budgeting,
425-27
Reinvestment rate, 256
Repayment
of
loans,
20-22
Replacement analysis
after-tax, 595
-99
an
nu
al worth, 390,
392-96,404-10
before-tax,
386-410
cash flow approach, 403
depreciation recapture, 595
economic service
li
fe
, 388, 39 J
-97
first costs,
388-89
ga
in
s and losses, 595
market va
lu
e, 388-90, 392-93
need for, 388
one-additional year, 398
opportunity cost approach, 389,
403
overview, 398
and study periods,
404-
10
sunk cost
s,
389
unequal-
li
fe
assets, 403, 404, 410
Replacement life. See Economic service life
Replacement
va
lue,
403-5
Retained earnings, 29, 352, 360
Retirement life. See Economic se
rvi
ce life
Return on assets ratio, 721
Return on
in
vested capital, 256
Return
on
in
ves
tm
ent (ROI), 14,238. See also Rate
of
return
Return on sales ratio,
721
Revenue alternatives, 1
72,279
, 293, 591
RIC. See Return on
in
vested capital
Ri
sk
and debt-equity mix,
362-64
and decision making, 656-59, 660- 66
description, 656
and MARR, 353, 362
and payback analysis, 186, 1
88-89
and random sampling, 667
RNG f
un
ct
ion, 696
ROI. See Return on
in
vestment
Root mean square deviation, 674
ROR. See Rate
of
return
Round-off errors,
53,
10
3
R
ul
e
of
72,
35
, 179
Rule
of
100, 35
Rule
of
signs, 249-50, 251, 253, 299
5
s. See Standard deviation
Safe investment, 28-29, 194-95,
360

Sales, return on, 721
Salvage value.
See also Trade-
in
value
a
nd
capi
ta
l recovery,
221
defined,
10
, 220
and depreciation, 533, 537, 539, 543, 557
a
nd
market va
lu
e, 388, 392, 397
a
nd
public projects, 319
a
nd
PW over LCM, 175
in
replaceme
nt
ana
ly
si
s,
386, 388, 391- 92
updating
fo
r study period, 349
Sampling, 666-71
Monte Carlo, 677- 84, 685
-88
Savings, tax, 576, 595
Scatter charts.
S
ee
xy
Excel® cha
rt
s
Screening project
s,
186, ] 88- 89
Section
179
property, 533- 34
Section
12
31 transaction
s,
583
Securitie
s,
defined, 361
Selection
of
evaluation method, 348-
51
Sens
iti
vity analysis. See also Breakeven analysis;
SOLVER
approach, 7-
8,
623
and Excel® ce
ll
referenc
in
g,
247, 698
-9
9
of
one parameter, 622- 29
with three est
im
ates, 629- 31
tw
o a
lt
ernatives, 626- 29
Service a
lt
e
rn
atives, 172, 279
a
nd
in
cremental rate
of
return, 59 I
Service life, 174- 75. See also Economic
service life
Shifted gradients.
See Gradie
nt
s,
arithmetic
Shifted se
ri
es, 94- 103
Sign changes, number of, 249- 54
Simple cash
fl
ow se
ri
es, 249
Simple inte
re
st, 17- J
8,
36- 37
Simulation, 659, 678- 86
Single-payment compound amount factor,
50
S
in
gle payment factors, 50- 56
Single-payment present worth f
ac
tor,
51
- 52
Sinking fund
(A
/F) factor, 60- 63
SLN function, 535,
711
Social discount rate, 316, 333
Solvency rati.os, 7 19
SOLVER,434-36, 455- 59, 712- 13
Spreadsheet.
See also Excel®
absolute ce
ll
referenc
in
g,
247, 703
annual worth, 225, 227- 28
and
B/C analysi
s,
323, 330- 31
and breakeven analysi
s,
451
- 52
and CFAT w
ith
depreciation, 578- 79
a
nd
EVA
TM, 601- 3
INDEX
and independent projects, 430, 434
-36
and inflation, 480
and present worth, 197- 202
and rate
of
return, 75- 77,
247,252,263,287
, 289,
297- 300
replacement anal
ys
i
s,
395-97, 402- 5
after-tax, 598- 99
a
nd
sensitivity analysis, 625- 26, 628- 29
and shifted uniform series,
11
0-
11
for s
im
ple and compound interest, 36- 39
incremental, after tax, 592
-9
5
Standard deviation
for continuous variable, 676-77
definition, 673- 74
for discrete variable, 673- 76
Standard normal distribution, 688- 89
Stocks
CAPM model, 360-61
common, 352, 359
in
equi
ty
financing, 352, 359
preferred, 352, 359
Straight line alternative,
in
MACRS,
541-42, 549
Straight line depreciation, 535- 36, 580-
86.
See also Alternatives
Straight line rate, 533, 535
Study period
and annual worth, 218, 226-28
and capital budgeting, 425
equal service, 173, 427
and
FW
ana
ly
si
s,
177
a
nd
PW
evaluation, 174- 77
a
nd
replacement analysis, 390, 400, 404-
10
and salvage value, 220
spreadsheet example, 197-200
SUM function,
703
Sum-
of
-year
di
gits depreciation, 533,
535- 57
,711
Sunk costs, 389
SYD function, 556,
711
Symbol
s,
23
System, phases of, 190-91
T
Tables
compound interest factor
s,
727- 55
effective
in
terest rates, 133
interpolation, 63-65
Tax
depreciation, 532
769
770
INDEX
Taxable
in
come, 570- 71, 583
a
nd
CFAT, 577
and depr
ec
iation, 572
nega
ti
ve, 577
-78
and taxes, 572
Taxe
s.
See also After-tax; In
co
me tax ; Taxa
bl
e in
come
and
debt
capital, 357-59
and
dep
r
ec
ia
ti
on, 530
and eq
ui
ty capital, 359- 60
and MARR, 35
3-
54
rates, 573, 575
T
im
e
in
terest rates
ove
r, 1
51
-
53
units of,
23
Ti
me placement
of
do
ll
ars, 31- 32, 472-73
Time
va
lu
e
of
money, 9, 127. See also Inflation
and capita
li
zed cost, 179- 80
a
nd
equivalence, 15-
17
a
nd
no-return payback, 1
87
Total cost relation, 445. See also
Bre
akeven analysis
Trade-in value,
389, 533. See also Mark
et
va
lu
e;
Salvage value
Treasury securities,
194-
95
, 315
Triang
ul
ar distribution, 663, 665- 66
u
Unad
ju
sted basis, 532
Un
ce
rtainty, 656, 659
Uniform di
st
ri
bution, 663 , 664, 670
Un
ifo
rm
gradient. See Gradient,
ar
ithme
ti
c
Uniform per
ce
ntage m
et
hod. See Declining balance
de
pr
eciation
Uniform se
ri
es
compound
amount
factor, 60-
63
compounding pe
ri
od greater
th
an payment period,
147-49
compounding p
er
iod less
th
an
payme
nt period,
142
-46
d
esc
ription,
23
present worth factors, 56- 58, 80
-8
1,
11
4
shifted, 94,
95
,
110
-
14
Unit me
th
od, 498-
99
Unkn
ow
n interest rate,
74-76
Unkn
ow
n years (
li
fe), 77- 78
Unr
ecove
red balan
ce
, 240
-4
1
,255-56
Unrecovered capital. See
Sunk
costs
Usage
stage, 191
v
Va
lu
e, resale,
lO.
See also Salvage value; Trade-
in
va
lu
e
Va
lu
e added analysis, after tax, 599-603. See also
Econ
om
ic value a
dd
ed
Variable.
See Random varia
bl
es
Variable costs,
444-48
Variance
in cost a
ll
ocation, 509-
11
definition, 673
formula for, 674, 677
and norm a
l.
distribution,
68
8
VDB func
ti
on, 558,
561
-
62
, 712
w
WACC. See Weighted
ave
rage cost
of
capital
Websites, IRS,
568
Blank and Tarqui
n,
xviii
Weighted attribute method,
37
1
-72
Weighted avera
ge
cost
of
capital, 29-30, 3
55
-
57
Working capital, 720
Worth, measures
of
, 9, 678
x
xy Ex
ce
l® charts, 247, 700-7
01
y
Ye
ar(s). See also Half-year
co
nvention;
One-additi
ona
l-year replacem
ent
studies;
Sum-of-year digits depreciation
and end-of-period convention,
31
-3
2
fiscal versus
ca
lendar, 716
symbols,
23
unknown,
77
- 78
z
Zero cash
fl
ow
in
Exce
l® functions, I I I, 198, 70
6,
708
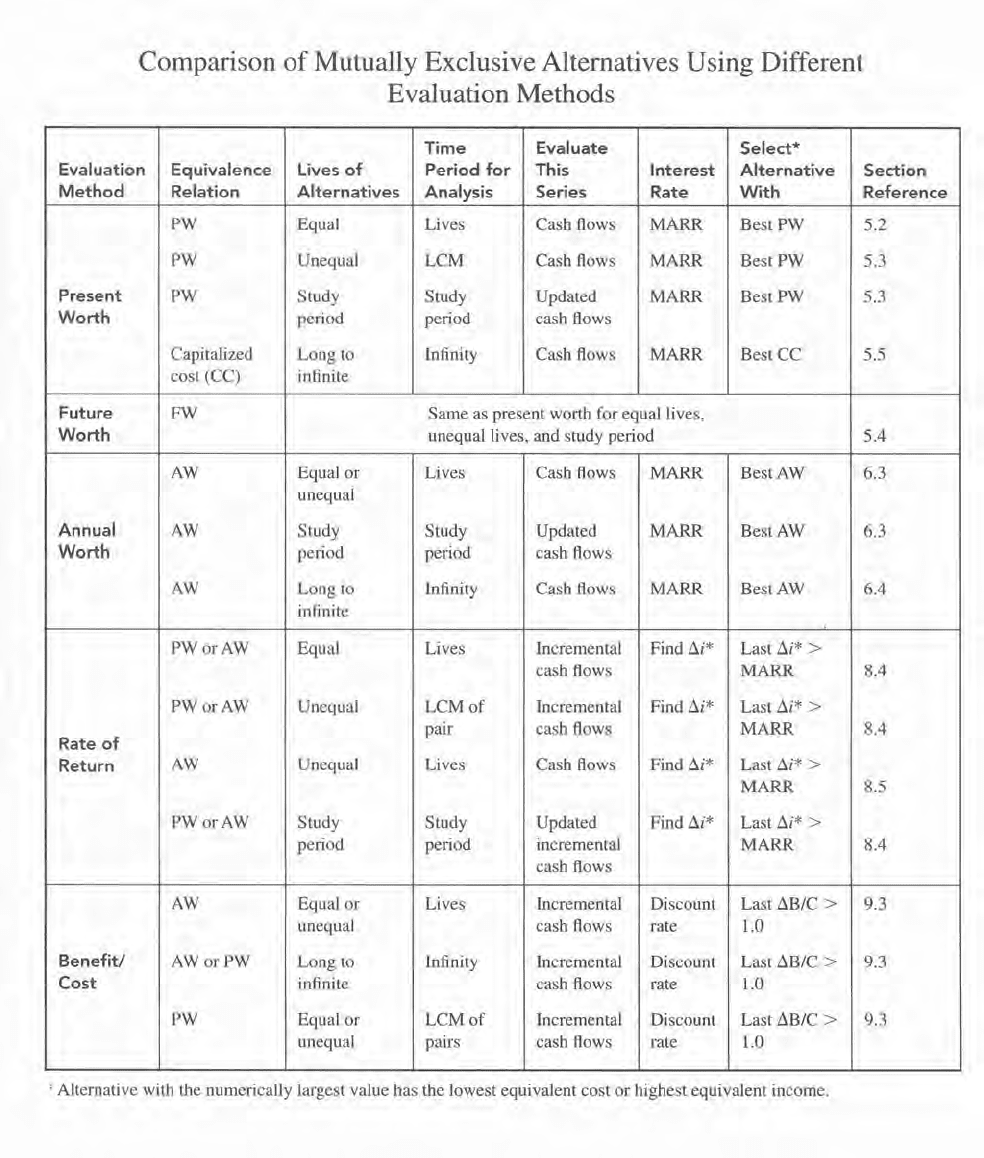
Comparison
of
Mutually Exclusive Alternatives Using Different
Evaluation Methods
Time Evaluate
Select*
Evaluation Equivalence
Lives
of
Period
for
This Interest Alternative
Section
Method
Relation Alternatives
Analysis Series Rate
With
Reference
PW
Equal Lives Cash flows
MARR
Best PW 5.2
PW
Unequal
LCM
Cash flows
MARR
Best PW 5.3
Present
PW Study Study
Updated MARR
Best
PW
5.3
Worth
period period cash flows
Capitalized
Long to Infinity Cash flows
MARR
Best CC
5.5
cost (CC) infinite
Future FW
Same as present worth for equal lives,
Worth
unequal lives, and study period 5.4
AW
Equal or Lives Cash flows
MARR
BestAW
6.3
unequal
Annual
AW
Study Study Updated
MARR
BestAW
6.3
Worth
period period cash flows
AW
Long to Infinity Cash flows
MARR
BestAW
6.4
infinite
PWorAW
Equal Lives Incremental Find
/::"i*
Last
/::"i*
>
cash flows
MARR
8.4
PWorAW
Unequal
LCMof
Incremental Find
/::"i*
Last
/::"i*
>
pair
cash flows
MARR 8.4
Rate
of
Return
AW
Unequal Lives Cash flows
Find
/::"i*
Last
/::"i
* >
MARR 8.5
PWorAW
Study Study Updated Find/::"i*
Last
/::"i*
>
period period incremental
MARR
8.4
cash flows
AW
Equal
or
Lives
Incremental Discount
Last
/::,.B/C
>
9.3
unequal
cash flows rate
1.0
Benefit!
AWorPW
Long to Infinity Incremental Discount Last
/::"B/C
> 9.3
Cost infinite
cash flows rate
1.0
PW
Equal
or
LCMof
Incremental Discount Last
/::"B/C
> 9.3
unequal
pairs
cash flows
rate
1.0
,
Alternative with the numerically largest value has the lowest equivalent cost or highest equivalent income.
Term
Annual amount or worth
Annual operating cost
Benefit/cost ratio
Breakeven point
Book value
Capital budget
Capital recovery
Capitalized cost
Cash flow
Cash flow before
or after taxes
Composite rate
of
return
Cost estimating
relationships
Cost
of
capital
Debt-equity
mix
Depreciation
Depreciation rate
Economic service life
Expected value
(average)
Expenses
First cost
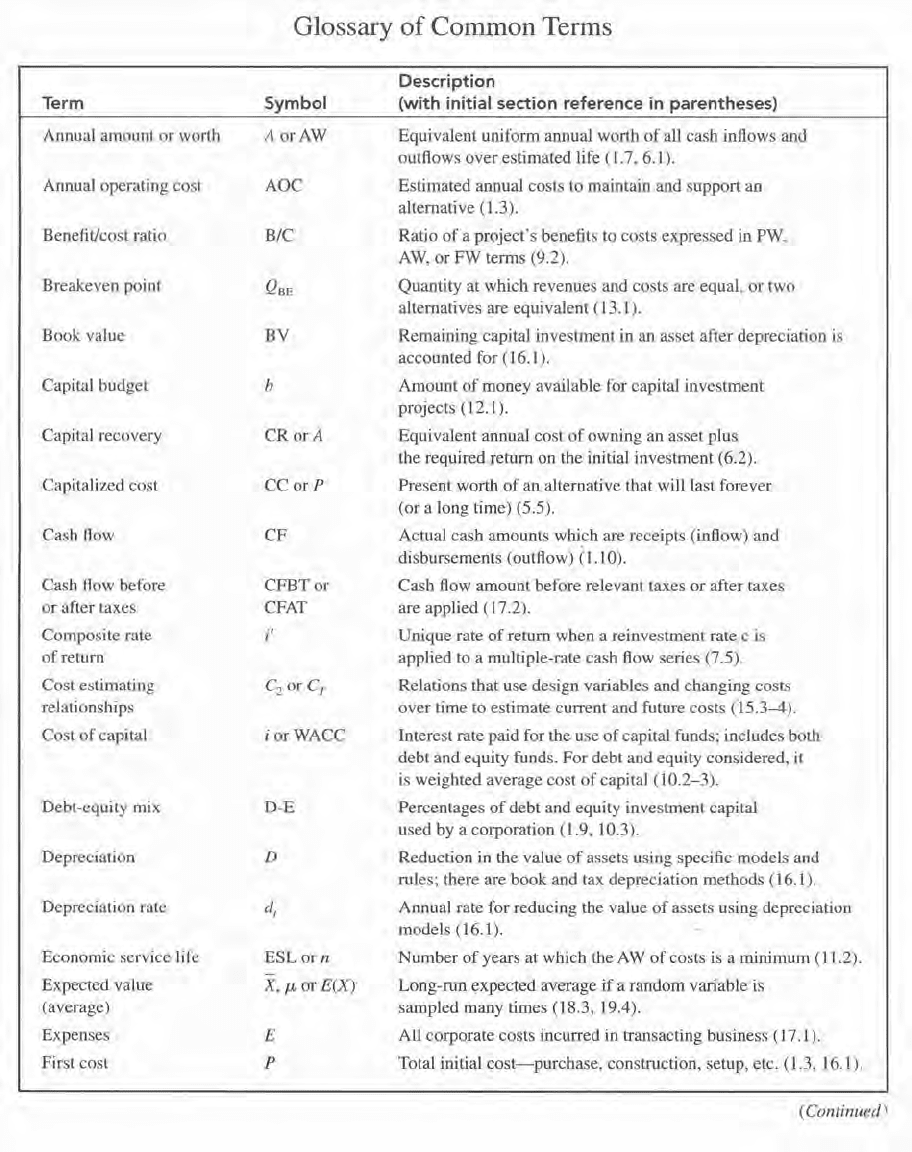
Glossary
of
Common Terms
Symbol
AorAW
AOC
B/C
Q
BE
BV
b
CRorA
CCorP
CF
CFBTor
CFAT
i'
C
2
or
C
r
iorWACC
D-E
D
d,
ESL
or n
X,
f.L
or
E(X)
E
P
Description
(with
initial section reference
in
parentheses)
Equivalent uniform annual worth
of
all cash inflows and
outflows over estimated life (1.7, 6.1).
Estimated annual costs to maintain and support an
alternative (1.3).
Ratio
of
a project's benefits to costs expressed in
PW
,
AW,
or
FW
terms (9.2).
Quantity at which revenues and costs are equal,
or
two
alternatives are equivalent (13.1).
Remaining capital investment
in
an asset after depreciation is
accounted for (16.1).
Amount
of
money available for capital investment
projects (12.1).
Equivalent annual cost
of
owning an asset plus
the required return on the initial investment (6.2).
Present worth
of
an alternative that will last forever
(or a long time) (5.5).
Actual cash amounts whi.ch are receipts (inflow) and
disbursements (outflow)
(1.1 0).
Cash flow amount before relevant taxes
or
after taxes
are applied
(l7.2).
Unique rate
of
return when a reinvestment rate c is
applied to a multiple-rate cash flow series (7.5).
Relations that use design variables and changing costs
over time to estimate current and future costs (15.3-4).
Interest rate paid for the use
of
capital funds; includes both
debt and equity funds.
For
debt and equity considered, it
is weighted average cost
of
capital (10.2
-3)
.
Percentages
of
debt and equity investment capital
used by a corporation (1.9,
10.3).
Reduction in the value
of
assets using specific models and
rules; there are
book
and tax depreciation methods (16.1).
Annual rate for reducing the value
of
assets using depreciation
models (16.1).
Number
of
years at which the AW
of
costs is a minimum (11.2).
Long-run
yxpected average if a random variable is
sampled many times (18.3, 19.4).
All corporate costs incurred in transacting business (17.1).
Total initial
cost-purchase
,.
construction, setup, etc. (1.3, 16.1).
( Continued'
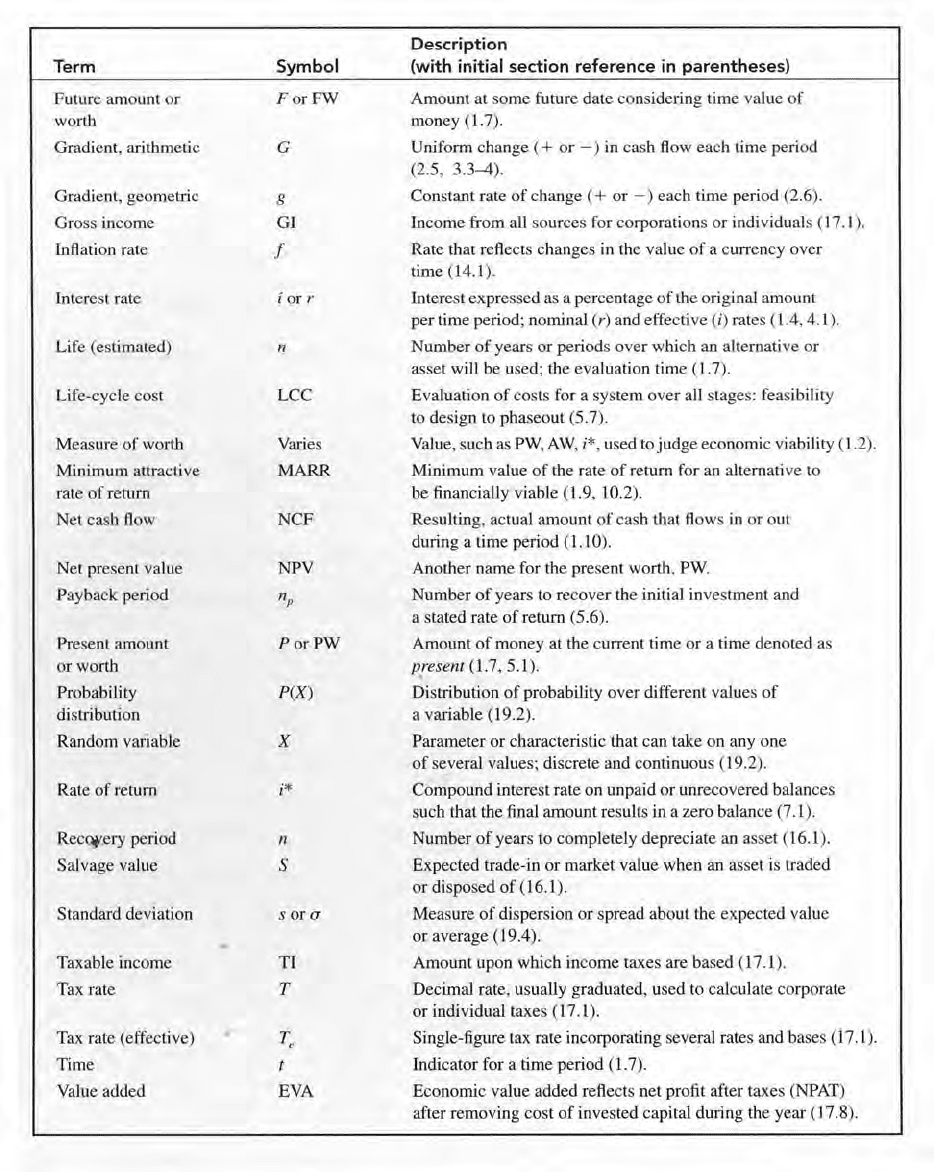
Term
Future amount
or
worth
Gradient, aritbmetic
Gradient, geometric
Gross
in
come
Inflation rate
Interest rate
Lif
e (estimated)
Life-cycle cost
Measure
of
worth
Minimum attractive
rate
of
return
Net cash flow
Net
present value
Payback period
Present amount
or
worth
Probability
distribution
Random variable
Rate
of
return
Recot'ery period
Salvage value
Standard deviation
Taxable income
Tax rate
Tax rate (effecti ve)
Time
Value added
Symbol
ForFW
G
g
GI
f
i or r
n
LCC
Varies
MARR
NCF
NPV
PorPW
P(X)
x
i*
n
s
s
or
(T
Tl
T
EVA
Description
(with
initial section reference
in
parentheses)
Amount at some future date considering time value
of
money (1.7).
Uniform change
(+
or
-)
in cash flow each time period
(2
.5
, 3
.3
-4).
Constant rate
of
change
(+
or
-)
each time period (2.6).
Income from all
so
urces for corporations or individuals (17.1).
Rate that reflects changes in the value
of
a currency over
time (14.1).
Interest expressed as a percentage
of
the original amount
per
time period; nominal
(r)
and effective (i) rates (1.4, 4.1
).
Number
of
years
or
periods over which an alternative
or
asset will be used; the evaluation time
(l.7).
Evaluation
of
costs for a system over all stages: feasibility
to design to phaseout
(5.7).
Value, such as PW, A W,
i*
, used to
judg
e economic viability (1.2).
Minimum value
of
the rate
of
return for an alternative to
be financially viable (1.9, 10.2).
Resulting, actual amount
of
cash that flows in or out
during a time period
(1.10).
Another name for the present worth, PW.
Number
of
years to recover the initial investment and
a stated rate
of
return (5.6).
Amount
of
money at the current time
or
a time denoted as
prese
nt
(1.7,5.1).
Distribution
of
probability over different values
of
a variable (19.2).
Parameter or characteristic that can take on
anyone
of
several values; discrete and continuous (19.2).
Compound interest rate on unpaid or unrecovered balances
such that the final amount results in a zero balance (7.1).
Number
of
years to completely depreciate an asset (16.1).
Expected trade-in or market value when an asset
is
traded
or disposed
of
(16.1).
Measure
of
dispersion or spread about the expected value
or
average (19.4).
Amount upon which income taxes are based (17.1).
Decimal rate, usually graduated, used to calculate corporate
or individual taxes (17.1).
Single-figure tax rate incorporating several rates and bases (17.1).
Indicator for a time period (1.7).
Economic value added reflects net profit after taxes (NPAT)
after removing cost
of
invested capital during the year (17.8).