Bhushan B. Nanotribology and Nanomechanics: An Introduction
Подождите немного. Документ загружается.

7 Molecular Recognition Force Microscopy 293
which, in turn, depends on the tether length. Therefore, only order-of-magnitude
estimates of k
on
can be gained from such measurements [57].
Additional information about the unbinding process is contained in the distri-
butions of the unbinding forces. Concomitant with the shift of maxima to higher
unbinding forces, increasing the loading rate also leads to an increase in the width
σ of the distributions [22,38], indicating that, at lower loading rates, the system ad-
justs closer to equilibrium. The lifetime τ(f) of a bond under an applied force was
estimated by the time the cantilever spends in a regime the force window spanned
by the standard deviation of the most probableforce for unbinding[4]. In the case of
Ni
2+
-His
6
, the lifetime of the complex decreased from 17 to 2.5ms when the force
was increased from 150 to 194pN [22]. The data fit well to Bell’s model, confirm-
ing the predicted exponential dependence of bond lifetime on the applied force, and
yielded an estimated lifetime at zero force of about 15 seconds. A more direct meas-
urement of τ is afforded by force-clamp experiments in which the applied force is
kept constant by a feedback loop. This configuration was first adapted for use with
AFM by Oberhauser et al. [59], who employed it to study the force dependence of
the unfolding probability of the I27 and I28 modules of cardiac titin as well as of
the full-length protein [59].
However, as discussed above, in most experiments the applied force is not con-
stant but varies with time, and the measured bond strength depends on the load-
ing rate [48, 50, 60]. In accordance with this, experimentally measured unbind-
ing forces do not assume unitary values but rather vary with both pulling veloc-
ity [52, 57] and cantilever spring constant [2]. The predicted logarithmic depen-
dence of the unbinding force on the loading rate in the thermally activated regime
was likewise confirmed by a large number of unbinding and unfolding experi-
ments [15,22,38,52,57,58,61].The slopes of the force–loadingrate curves contain
information about the length scale x
β
of prominent energy barriers along the force-
drivendissociation pathway, whichmay be related to thedepth of the bindingpocket
of the interaction [57].
The forcespectra may also be used to derivethe dissociationrate constantk
off
by
extrapolation to zero force [52,57,58]. As mentioned above, values derived in this
mannermay differ fromthose obtainedfrom bulk measurementsbecause only a sub-
set of dissociation pathways defined by the force is sampled. Nevertheless, a simple
correlation between unbinding forces and thermal dissociation rates was obtained
for a set consisting of nine different Fv fragments constructed from point mutations
of three unrelated anti-fluorescein antibodies [58]. This correlation, which implies
a close similarity between the force- and thermally driven pathways exploredduring
dissociation, was probably due to the highly rigid nature of the interaction, which
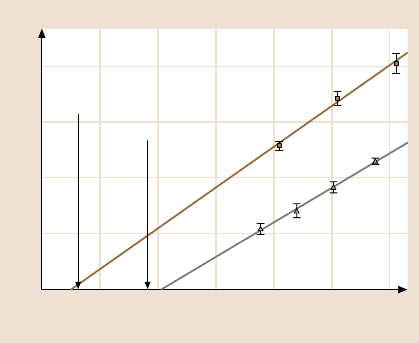
proceeds in a lock-and-keyfashion. The force spectra obtainedfor the different con-
structs exhibited a single linear regime, indicating that in all cases unbinding was
governed by a single prominent energy barrier (Fig. 7.8). Interestingly, the position
of the energy barrier along the forced-dissociation pathway was found to be pro-
portional to the height of the barrier and, thus, most likely includes contributions
arising from elastic stretching of the antibodies during the unbinding process.
294 Peter Hinterdorfer and Ziv Reich
F (pN)
r (pN/s)
0.01
160
120
80
40
0
0.1 1 10 100 1000 10
4
FITC-E2 w.t.
4D5-Flu
k
off (Solution)
= 0.0044
k
off (Solution)
= 0.062
Fig. 7.8. The dependence of the unbinding force on the loading rate for two anti-fluorescein
antibodies. For both FITC-E2 w.t. and 4D5-Flu a strictly single-exponential dependence was
found in the range accessed, indicating that only a single energy barrier was probed. The same
energy barrier dominates dissociation without forces applied because extrapolation to zero
force matches kinetic off-rates determined in solution (indicated by the arrow) (after [58])
7.6.2 Complex Bonds and Energy Landscapes
The energy landscapes that describe proteins are generally not smooth. Rather, they
are traversed by multiple energy barriers of various heights that render them highly
corrugated or rugged. All these barriers affect the kinetics and conformational dy-
namics of proteinsand any one of them may governinteraction lifetime and strength
on certain time scales. Dynamic force spectroscopy provides an excellent tool to
detect energy barriers which are difficult or impossible to detect by conventional,
near-equilibrium assays and to probe the free-energy surface of proteins and protein
complexes. It also provides a natural means to study interactionswhich are normally
subjected to varying mechanical loads [52,57,62–64].
A beautiful demonstration of the ability of dynamic force spectroscopyto reveal
hidden barriers was provided by Merkel et al. [38] who used BFP to probe bond for-
mation betweenbiotin and streptavidinor avidinover a broad rangeof loading rates.
In contrast to early studies, which reported fixed values of bond strength [54,55],
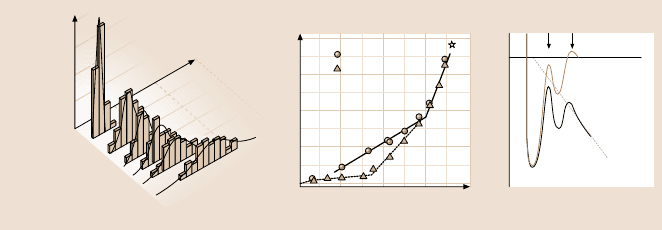
a continuous spectrum of unbinding forces ranging from 5 to 170pN was ob-
tained (Fig. 7.9). Concomitantly, interaction lifetime decreased from about 1 min
to 0.001s, revealing the reciprocal relation between bond strength and lifetime ex-
pected for thermally activated kineticsunder a rising force.Most notably, depending
on the loading rate, unbinding kinetics was dominated by different activation energy
barrier positioned along the force-driven unbinding pathway. Barriers emerged se-
quentially, with the outermost barrier appearing first, each giving rise to a distinct
linear regimein theforce spectrum. Going from one linearregime to the next wasas-
sociated with an abrupt changein slope, indicatingthat a crossoverbetween an outer
7 Molecular Recognition Force Microscopy 295
– (f cos θ)x
200
150
100
50
0
10
6
10
0
10
2
10
4
10
–2
10
4
0.050
0.025
10
0
10
2
10
6
300
200
100
a) b) c)
Force (pN)
Loading rate (pN/s)
AFM
Streptavidin
Avidin
E(x)
x
ts
x
Frequency
Force (pN)
Loading rate
(pN/s)
Fig. 7.9. Unbinding force distributions and energy landscape of a complex molecular bond.
(a) Force histograms of single biotin streptavidin bonds recorded at different loading rates.
The shift in peak location and the increase in width with increasing loading rate is clearly
demonstrated. (b) Dynamic force spectra for biotin streptavidin (open circles) and biotin
avidin (closed triangles). The slopes of the linear regimes mark distinct activation barriers
along the direction of force. (c) Conceptual energy landscape traversed along a reaction co-
ordinate under force. The external force f adds a mechanical potential that tilts the energy
landscape and lowers the barriers. The inner barrier starts to dominate when the outer has
fallen below it due to the applied force (after [38])
to (more) inner barrier had occurred. The position of two of the three barriers iden-
tified in the force spectra was consistent with the location of prominent transition
states revealed by molecular dynamics simulations [48,60]. However, as mentioned
earlier, unbinding is not necessarily confined to a single, well-defined path, and may
take different routes even when directed by an external force. Molecular dynamics
simulations of force-driven unbinding of an antibody antigen complex character-
ized by a highly flexible binding pocket revealed a large heterogeneity of enforced
dissociation pathways [65].
The rolling of leukocytes on activated endothelium is a first step in the emer-
gence of leukocytes out of the blood stream into sites of inflammation. This rolling,
which occursunder hydrodynamicshear forces, is mediatedby selectins, a family of
extended, calcium-dependent lectin receptors present on the surface of endothelial
cells. To fulfill their function, selectins and their ligands exhibit a unique combina-
tion of mechanical properties: they associate rapidly and avidly and can tether cells
over very long distances by their long, extensible structure. In addition, complexes
made between selectins and their ligands can withstand high tensile forces and dis-
sociate in a controllable manner, which allows them to maintain rolling without
being pulled out of the cell membrane.
Fritz et al. [52] used dynamic force spectroscopy to study the interaction be-
tween P-selectin and its leukocyte-expressed surface ligand P-selectin glycoprotein
ligand-1(PSGL-1).Modeling bothintermolecularand intramolecularforces, aswell
as adhesion probability, they were able to obtain detailed information about rupture
forces, elasticity, and the kinetics of the interaction. Complexes were able to with-
stand forces up to 165pN and exhibited a chain-like elasticity with a molecular
296 Peter Hinterdorfer and Ziv Reich
spring constant of 5.3pNnm
−1
and a persistence length of 0.35nm. Rupture forces
and the lifetime of the complexes exhibited the predicted logarithmic dependence
on the loading rate.
An important characteristics of the interaction between P-selectin and PSGL-1,
which is highly relevant to the biological function of the complex, was found by in-
vestigating the dependence of the adhesion probability between the two molecules
on the velocity of the AFM probe. Counterintuitively and in contrast to experiments
with avidin–biotin[54], antibodyantigen [4], or cell adhesion proteoglycans[9], the
adhesion probability between P-selectin and PSGL-1 was found to increase with in-
creasing velocities [52]. This unexpected dependency explains the increase in the
leukocyte tethering probability with increased shear flow observed in rolling exper-
iments. Since the adhesion probability approached 1 at fast pulling velocities, it was
concluded that binding occurs instantaneously as the tip reaches the surface and,
thus, proceeds with a very fast on-rate. The complex also exhibited a fast forced
off-rate. Such fast-on fast-off kinetics is probably important for the ability of leuko-
cytes to rapidly bind and detach from the endothelialcell surface. Likewise,the long
contour length of the complex together with its high elasticity reduces the mechan-
ical loading on the complex upon binding and allows leukocyte rolling even at high
shear rates.
Evans et al. [62] used BFP to study the interaction between PSGL-1 and another
member of theselectin family,L-selectin. The force spectra,obtainedovera rangeof
loading rates extending from 10 to 100,000pNs
−1
, revealed two prominent energy
barriers along the unbinding pathway: an outer barrier, probably constituted by an
array of hydrogen bonds, that impeded dissociation under slow detachment and an
inner, Ca
2+
-dependent barrier that dominated dissociation under rapid detachment.
The observed hierarchy of inner and outer activation barriers was proposed to be
important for multibond recruitment during selectin-mediated function.
Using force clamp AFM [59], bond lifetimes were directly measured as a func-
tion of a constantly applied force. For this, lifetime force relations of P-selectin
complexed to two forms of P-selectin glycoprotein ligand-1 (PSGL-1) and to
G1, a blocking monoclonal antibody against P-selectin, respectively, were deter-
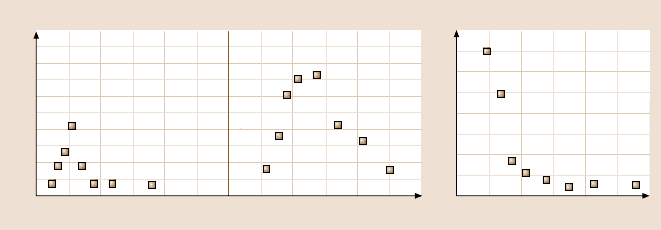
mined [64]. Both monomeric (sPSGL-1) and dimeric PSGL-1 exhibited a biphasic
relationship between lifetime and force in their interaction to P-selectin
(Fig. 7.10a,b). The bond lifetimes initially increased, indicating the presence of
catch bonds. After reaching a maximum, the lifetimes decreased with force, indi-
cating a catch bond. In contrast, the P-selectin/G1 bond lifetimes decreased expo-
nentially with force (Fig. 7.10c), displaying typical slip-bond characteristics that
are well described by the single-energy-barrier Bell model. The curves of life-
time against force for the two forms of PSGL1-1 had similar biphasic shapes
(Fig.7.10a,b),butthe PSGL-1curve(Fig. 7.10b)was shiftedrelativeto thesPSGL-1
curve (Fig. 7.10a), approximately doubling the force and the lifetime. These data
suggestthatthat sPSGL-1formsmonomericbondswith P-selectin,whereasPSGL-1
forms dimericbonds with P-selectin. In agreementwith the studies describedabove,
it was concluded that the use of force-induced switching from catch to slip bonds
7 Molecular Recognition Force Microscopy 297
1.5
1.2
0.9
0.6
0.3
0
020 400406020
2
1.5
1
0.5
0
6040200
a) b)
Mean lifetimes (s)
Force f (pN)
sPSGL-1
c)
PSGL-1 G1
Force f (pN)
Mean lifetimes (s)
Fig. 7.10. Lifetimes of bonds of single-molecular complexes, depending on a constantly ap-
plied force. (a) sPSGL-1/P-selectin: catch bond and slip bond. (b) PSGL-1/P-selectin: catch
bond and slip bond. (c)G1/P-selectin: slip bond only (after [64])
might be physiologicallyrelevant for the tethering and rolling process of leukocytes
on selectins [64].
Baumgartneret al. [57])used AFM toprobe specific trans-interaction forces and
conformational changes of recombinant vascular/enothelial (VE)-cadherin strand
dimers. Vascular endothelial-cadherins (VE-cadherin) are cell surface proteins that
mediate the adhesion of cells in the vascular endothelium through Ca
2+
-dependent
homophilic interactions of their N-terminal extracellular domains. Acting as such
they play an important role in the regulation of intercellular adhesionand communi-
cation in the inner surface of blood vessels. Unlike selectin-mediated adhesion, as-
sociation between trans-interacting VE dimers was slow and independent of probe
velocity, and complexes were ruptured at relatively low forces. These differences
were attributed to the fact that, as opposed to selectins, cadherins mediate adhe-
sion between resting cells. Mechanical stress on the junctions is thus less intense
and high-affinity binding is not required to establish and maintain intercellular ad-
hesion. Determination of the Ca
2+
-dependency of recognition events between tip-
and surface-bound VE-cadherins revealeda surprisingly high K
D
(1.15mM), which
is very close to the free extracellular Ca
2+
concentration in the body. Binding also
revealed a strong dependence on calcium concentrations,giving rise to an unusually
high Hill coefficient of ≈ 5. This steep dependency suggests that local changes of
free extracellular Ca
2+
in the narrow intercellular space may facilitate rapid remod-
eling of intercellular adhesion and permeability.
Nevo et al. [66,67] used single-molecule force spectroscopy to discriminate be-
tween alternative mechanisms of protein activation (Fig. 7.11). The activation of
proteins by other proteins, protein domains, or small ligands is a central process in
biology for signalling pathways, and enzyme activity. Moreover, activation and in-
activation of genes all depend on the switching of proteins between alternativefunc-
tional states. Two general mechanisms have been proposed. The induced-fit model
assigns changes in protein activity to conformational changes triggered by effector
binding. The population-shift model, on the other hand, ascribes these changes to
a redistribution of pre-existing conformational isomers. According to this model,
298 Peter Hinterdorfer and Ziv Reich
50 1000
150
120
90
60
30
0
1000000 10 0001000150
80
60
40
20
100 100001000200 250
2000
nm/s
a)
Loading rate (pN/s)
c)
Loading rate (pN/s)
Force (pN)
–RanBP1
+RanBP1
Force (pN)
b)
–RanBP1
+RanBP1
(pF)
RanGDP
RanGppNHp
Force (pN)
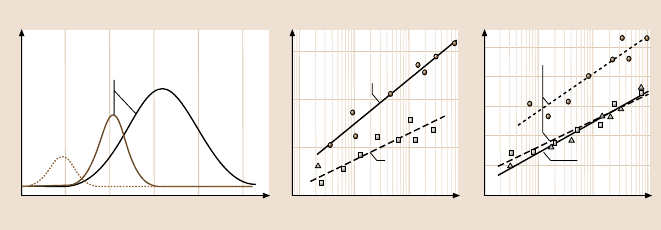
Fig. 7.11. Protein activation revealed by force spectroscopy. Ran and importinβ (impβ)were
immobilized onto the AFM cantilevered tip and mica, respectively, and the interaction force
was measured at different loading rates in the absence or presence of RanBP1, which was
added as a mobile substrate to the solution in the AFM liquid cell. Unbinding force distribu-
tions obtained for impβ-Ran complexes at pulling velocity of 2000 nm/s. Association of impβ
with Ran loaded with GDP (a) or with non-hydrolyzable GTP analogue (GppNHp) (b)gives
rise to uni- or bimodal force distributions, respectively, reflecting the presence of one and
two bound states. (b–c) Force spectra obtained for complexes of impβ with RanGDP or with
RanGppNHp, in the absence (dashed lines)orpresence(solid lines) of RanBP1. The results
indicate that activation of impβ-RanGDP and imp-RanGTP complexes by RanBP1 proceeds
through induced-fit and dynamic population-shift mechanisms, respectively (see text for de-
tails) (after [66,67])
known also as the pre-equilibrium or conformationalselection model, protein struc-
ture is regardedas an ensemble of conformations existing in equilibrium. The ligand
bindsto one of theseconformations,i.e., theone to whichit is most complementary,
thus shifting the equilibrium in favor of this conformation. Discrimination between
the two models of activation requiresthat the distribution of conformationalisomers
in the ensemble is known. Such information, however, is very hard to obtain from
conventional bulk methods because of ensemble averaging.
Using AFM, Nevo and coworkers measured the unbinding forces of two related
protein complexes in the absence or presence of a common effector. The complexes
consisted of the nuclear transport receptor importin β (impβ) and the small GTPase
Ran. The difference betweenthem was the nucleotideboundstate of Ran, whichwas
either guanosine diphosphate (GDP) or guanosine triphosphate (GTP). The effector
molecule was the Ran-binding protein RanBP1. Loaded with GDP, Ran associated
weakly with impβ to form a single bound state characterized by unimodal distri-
butions of small unbinding forces (Fig. 7.11a, dotted line). Addition of RanBP1
resulted in a marked shift of the distribution to higher unbinding forces (Fig. 7.11b,
dotted to solid line). These results were interpreted to be consistent with an induced-
fit mechanism where binding of RanBP1 induces a conformational change in the
complex, which, in turn, strengthens the interaction between impβ and Ran(GDP).
In contrast, association of RanGTP with impβ was foundto lead to alternativebound
states of relatively low and high adhesion strength represented by partially overlap-
ping force distributions (Fig. 7.11a, solid line). When RanBP1 was added to the
7 Molecular Recognition Force Microscopy 299
solution, the higher-strength population, which predominated the ensemble in the
absence of the effector (Fig. 7.11c, dotted lines), was diminished, and the lower-
strength conformation became correspondingly more populated (Fig. 7.11c, solid
line).The meansof the distributions,however,remain unchanged,indicatingthat the
strength of the interaction in the two states of the complex has not been altered by
the effector. These data fit a dynamic population-shift mechanism in which RanBP1
bindsselectivelyto the lower-strengthconformationof RanGTP-impβ,changing the
properties and function of the complex by shifting the equilibrium between its two
states.
The complex between impβ and RanGTP was also used in studies aimed to
measure the energy landscape roughness of proteins. The roughness of the energy
landscapes that describe proteins has numerous effects on their folding and binding
as well as on their behavior at equilibrium, since undulations in the free-energy
surface can attenuate diffusion dramatically. Thus, to understand how proteins fold,
bind and function, one needs to know not only the energy of their initial and final
states, but also the roughness of the energy surface that connects them. However,
for a long time, knowledgeof protein energy-landscaperoughness came solely from
theory and simulations of small model proteins.
Adopting Zwanzig’s theory of diffusion in rough potentials [68], Hyeon and
Thirumalai [69] proposed that the energy-landscape roughness of proteins can be
measuredfrom single-moleculemechanicalunfoldingexperimentsconductedat dif-
ferent temperatures. In particular, their simulations showed that, at constant loading
rate, the most probable force for unfolding increases because of roughness that acts
to attenuate diffusion. Because this effect is temperature dependent, an overall en-
ergy scale of roughness, ε, can be derived from plots of force versus loading rate
acquired at two arbitrary temperatures. Extending this theory to the case of un-
binding, and performing single-molecule force spectroscopy measurements, Nevo
et al. [70] extracted the overall energy scale of roughness ε for RanGTP-impβ.The
results yielded ε>5k
B
T, indicating a bumpy energy surface, which is consistent
with the unusually high structural flexibility of impβ and its ability to interact with
different, structurally distinct ligands in a highly specific manner. This mechanistic
principle may also be applicable to other proteins whose function demands highly
specific and regulated interactions with multiple ligands.
7.6.3 Live Cells and Membranes
Thus far, there have been only a few attempts to apply recognition force spec-
troscopy to cells. In one of the early studies, Lehenkari et al. [71] measured the
unbinding forces between integrin receptors present on the surface of intact cells
and several RGD-containing (Arg-Gly-Asp) ligands. The unbinding forces meas-
ured were foundto be cell- and amino acid sequence-specificand sensitive to the pH
and divalent cation composition of the cellular culture medium. In contrast to short
linear RGDhexapeptides,largerpeptidesandproteins containingthe RGDsequence
showed different binding affinities, demonstrating that the context of the RGD motif
within a protein has considerable influence upon its interaction with the receptor. In
300 Peter Hinterdorfer and Ziv Reich
another study, Chen et al. [72] used AFM to measure the adhesive strength between
concanavalin A (Con A) coupled to an AFM tip and Con A receptors on the surface
of NIH3T3 fibroblasts. Crosslinking of receptors with either glutaraldehyde or 3,3’-
dithio-bis(sulfosuccinimidylproprionate) (DTSSP) led to an increase in adhesion
that was attributed to enhanced cooperativity among adhesion complexes. The re-
sults support the notion that receptor crosslinking can increase adhesion strength by
creating a shift towards cooperative binding of receptors. Pfister et al. [73] investi-
gated the surface localization of HSP60 on stressed and unstressed human umbilical
venous endothelial cells (HUVECs). By detecting specific single-molecule binding
events between the monoclonal antibody AbII-13 tethered to AFM tips and HSP60
molecules on cells, clear evidence was found for the occurrence of HSP60 on the
surface of stressed HUVECs, but not on unstressed HUVECs.
The sidedness and accessibility of protein epitopes of the Na
2+
D-glucose co-
transporter 1 (SGLT1) was probed in intact brush border membranes by a tip-bound
antibody directed against an amino acid sequence close to the glucose binding
site [35]. Binding of glucose and transmembrane transport altered both the bind-
ing probability and the most probable unbinding force, suggesting changes in the
orientation and conformation of the transporter. These studies were extended to live
SGLT1-transfected CHO cells Puntheeranurak et al. [74] Using AFM tips carrying
the substrate 1-β-thio D-glucose, direct evidence could be obtained that, in the pres-
ence of sodium, a sugar binding site appears on the SGLT1 surface. It was shown
that this binding site accepts the sugar residue of the glucoside phlorizin, free d-
Glucose and D-galactose, but not free L-glucose. The data indicate the importance
of stereo-selectivity for sugar binding and transport.
Zhang et al. [63] studied the interaction between leukocyte function-associated
antigen-1(LFA-1) and itscognate ligand,intercellularadhesionmolecule-1(ICAM-
1), which play a crucial role in leukocyte adhesion. The experimental system con-
sisted of an LFA-1-expressing T cell hybridoma attached to the end of the AFM
cantilever and an apposing surface expressing ICAM-1. The force spectra revealed
fast and slow loadingregimes,amounting to a sharp, inner energybarrier and a shal-
low, outer barrier,respectively. Addition of Mg
2+
led to an increase ofthe unbinding
force in the slow loading regime whereas ethylene-diaminetetraacidic acid (EDTA)
suppressed the inner barrier. These results suggest that the dissociation of LFA-
1/ICAM-1 is governed by the outer activation barrier of the complex, while the
ability of the complex to resist a pulling force is determined by the divalent cation-
dependent inner barrier.
7.7 Recognition Imaging
Besides measuring interaction strengths, locating binding sites over biological sur-
faces such as cells or membranes is of great interest. To achieve this goal, force
detection must be combined with high-resolution imaging.
Ludwig et al. [75] used chemical force microscopy to image a streptavidin pat-
tern with a biotinylated tip. An approach–retract cycle was performed at each point
7 Molecular Recognition Force Microscopy 301
of a raster and topography, adhesion, and sample elasticity were extracted from the
local force ramps. This strategy was also used to map binding sites on cells [76,77]
andtodifferentiate between red blood cells of different bloodgroups(A and 0) using
AFM tips functionalized with a group-A-specific lectin [78].
Identification and localization of single antigenic sites was achieved by record-
ing force signals during the scanning of an AFM tip coated with antibodies along
a single line across a surface immobilized with a low density of antigens [4,12].
Using this method, antigens could be localized over the surface with positional ac-
curacy of 1.5nm. A similar configuration used by Willemsen et al. [79] enabled the
simultaneous acquisition of height and adhesion-force images with near-molecular
resolution.
The aforementioned strategies of force mapping either lack high lateral resolu-
tion [75] and/or are much slower [4,12,79] than conventional topographic imaging
since thefrequencyof the force-sensingretract–approachcyclesis limitedby hydro-
dynamic damping. In addition, the ligand needs to be detached from the receptor in
each retract approach cycle, necessitating large working amplitudes (50nm). There-
fore, the surface-boundreceptor is inaccessible to the tip-immobilized ligand on the
tip during most of the time of the experiment. This problem however, should be
overcome with the use of small cantilevers [46] which should increase the speed
for force mapping because the hydrodynamic forces are significantly reduced and
the resonance frequency is higher than that of commercially available cantilevers.
Short cantilevers were recently applied to follow the association and dissociation of
individual chaperonin proteins, GroES to GroEL, in real time using dynamic force
microscopy topography imaging [80].
An imaging method for mapping antigenic sites on surfaces was developed [20]
by combining molecular recognition force spectroscopy [4] with dynamic force mi-
croscopy (DFM) [25,81]. In DFM, the AFM tip is oscillated across a surface and
the amplitude reduction arising from tip–surface interactions is held constant by
a feedback loop that lifts or lowers the tip according to the detected amplitude sig-
nal. Since the tip contacts the surface only intermittently, this technique provides
very gentle tip–surface interactions and the specific interaction of the antibody on
the tip with the antigen on the surface can be used to localize antigenic sites for
recording recognition images. The AFM tip is magnetically coated and oscillated
by an alternating magnetic field at very small amplitudes while being scanned along
the surface. Since the oscillation frequencyis more than a hundred times faster than
typical frequencies in conventional force mapping, the data acquisition rate is much
higher. This method was recently extended to yield fast, simultaneous acquisition
of two independent maps, i.e. a topography image and a lateral map of recognition
sites, recorded with nm resolution at experimental times equivalent to normal AFM
imaging [82–84].
Topographyand recognitionimageswere simultaneouslyobtained (TRECimag-
ing) using a special electronic circuit (PicoTrec, Molecular Imaging, Tempe, AZ)
(Fig.7.12a).Maxima (U
up
) andminima(U
down
) of eachsinusoidalcantileverdeflec-
tion period were depicted in a peak detector, filtered, and amplified. Direct-current
302 Peter Hinterdorfer and Ziv Reich
a)
40123 nm
100 nm 100 nm
Oscillation
Scan Direction
40123 nm
b)
Pico
TREC
Recognition
image
Topography
image
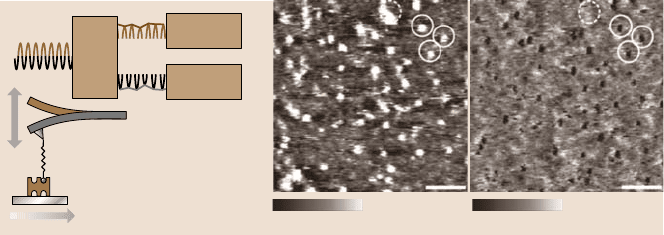
Fig. 7.12. Simultaneous topography and recognition (TREC) imaging (a) Principle. The can-
tilever oscillation is split into lower and upper parts, resulting in simultaneously acquired
topography and recognition images. (b) Avidin was electrostatically adsorbed to mica and
imaged with a biotin-tethered tip. A good correlation between topography (left image, bright
spots) and recognition (right image, dark spots) was found (solid circles). Topographical
spots without recognition denote structures lacking specific interaction (dashed circle). Scan
size was 500 nm (after [84])
(DC) offset signals were used to compensate for the thermal drifts of the cantilever.
U
up
and U
down
were fed into the AFM controller, with U
down
driving the feedback
loop to record the height (i.e. topography) image and U
up
providing the data for
constructing the recognition image (Fig. 7.12a). Since we used cantilevers with low
Q-factor (≈ 1 in liquid) driven at frequencies below resonance the two types of in-
formation were independent. In this way, topography and recognition image were
recorded simultaneously and independently.
The circuit was applied to mica containing singly distributed avidin molecules
using a biotinylated AFM tip [84]. The sample was imaged with an antibody-
containing tip, yielding the topography (Fig. 7.12b, left image) and the recogni-
tion image (Fig. 7.12b, right image) at the same time. The tip oscillation amplitude
(5nm) waschosen to beslightlysmaller thanthe extendedcrosslinkerlength (8nm),
so that both the antibodyremainedbound whilepassing a bindingsite and thereduc-
tion of the upwards deflection was significant compared to the thermal noise. Since
the spring constant of the polymeric crosslinker increases nonlinearly with the tip–
surface distance (Fig. 7.5), the binding force is only sensed close to full extension
of the crosslinker (given at the maxima of the oscillation period). Therefore, the
recognition signals were well separated from the topographic signals arising from
the surface, both in space (Δz ≈ 5 nm) and time (half oscillation period ≈ 0.1ms).
The bright dots, with a height of 2–3nm and diameter of 15–20nm, that are
visible in the topography image (Fig. 7.12b, left image) represent single avidin
molecules stably adsorbed onto the flat mica surface. The recognition image shows
black dots at positions of avidin molecules (Fig. 7.12b, right image) because the
oscillation maxima are lowered due to the physical avidin–biotin connection estab-
lished during recognition. Spatial correlation between the lateral positions of the
avidin molecules obtained in the topography image and the recognition signals of