Bhushan B. Nanotribology and Nanomechanics: An Introduction
Подождите немного. Документ загружается.

1032 B. Bhushan et al.
from a DI water sessile droplet (∼ 5 µL) using a microsyringe. The advancing con-
tact angle was measured by adding additional water to the sessile droplet (∼ 5µL)
using the microsyringe. The contact angle hysteresis was calculated by the differ-
ence between the measured advancing and receding contact angles. The tilt angle
was measured by a simple stage tilting experiment with the droplets of 5 µLvol-
ume [18,19]. All measurements were made by five different points for each sample
at 22 ± 1°C and 50 ± 5% RH. The measurements were reproducible to within ± 3°.
For surface roughness, an optical profiler (NT-3300, Wyko Corp., Tuscon, AZ)
was used for different surface structures [16–19,32, 69]. A greater Z-range of the
optical profiler of 2 mm is a distinct advantage over the surface roughness meas-
urements using an AFM which has a Z-range of 7µm, but it has a maximum lat-
eral resolution of approximately 0.6µm [13,14].Experimentswere performed using
three different radii tips to study the effect of scale dependence. Large radii atomic
force microscopy (AFM) tips were primarily used in this study. Borosilicate ball
with 15µm radius and silica ball with 3.8µm radius were mounted on a gold-coated
triangular Si
3
N
4
cantilever with a nominal spring constant of 0.58Nm
−1
. A square
pyramidal Si
3
N
4
tip with nominal radius 30–50nm on a triangular Si
3
N
4
cantilever
with a nominal spring constant of 0.58Nm
−1
was used for smaller radius tip. Adhe-
sive force was measured using the single point measurement of a force calibration
plot [13–15].
Measurement of Droplet Evaporation
Droplet evaporation was observed and recorded by a digital camcorder (Sony,
DCRSR100) with a 10 X optical and 120 X digital zoom for every run of the ex-
periment. Then the decrease in the diameter of the droplets with time was deter-
mined [68,69]. The resolution of the camcorder was 0.03s per frame. An objective
lens placed in front of the camcorder during recording gave a total magnification of
between 10 to 20 times. Droplet diameter as small as few hundred microns could be
measured with this method. Droplets were gently deposited on the substrate using
a microsyringe and the whole process of evaporationwas recorded. The evaporation
starts right after the deposition of the droplets. Images obtained were analyzed us-
ingImagetool
software(Universityof TexasHealth Science Center)for thecontact
angle. To find dust trace remaining after droplet evaporation, an optical microscope
with a CCD camera (Nikon, Optihot-2) was used. All measurements were made in
a controlled environment at 22±1
◦
C and 45±5% RH [68,69].
Measurement of Contact Angle Using ESEM
A Philips XL30 ESEM equipped with a Peltier cooling stage was used to study
smaller droplets [69]. ESEM uses a gaseous secondary electron detector (GSED)
for imaging. The ESEM column is equipped with a multistage differential pressure-
pumping unit. The pressure in the upper part is about 10
−6
to 10
−7
Torr, but the
pressure of about 1 to 15 Torr can be maintained in the observation chamber. When
19 Lotus Effect: Roughness-Induced Superhydrophobic Surfaces 1033
the electron beam (primary electrons) ejects secondaryelectrons from the surface of
the sample, the secondary electrons collide with gas molecules in the ESEM cham-
ber, which in turn acts as a cascade amplifier, delivering the secondary electron
signal to the positively biased GSED. The positively charged ions are attracted to-
ward the specimen to neutralize the negative charge producedby the electron beam.
Therefore,the ESEM can be used to examine electrically isolated specimens in their
natural state. In ESEM, adjusting the pressure of the water vapor in the specimen
chamber and the temperature of the cooling stage will allow the water to condense
on the sample in the chamber. For the measurement of the static and dynamic con-
tact angles on patterned surfaces, the video images were recorded. The voltage of
the electron beam was 15 kV and the distance of the specimen from the final aper-
ture was about 8mm. If the angle of observation is not parallel to the surface, the
electron beam is notparallel to the surface but inclined at an angle, this will produce
a distortion in the projection of the droplet profile. A mathematical model to calcu-
late the real contact angle from the ESEM images was used to correct the tilting of
the surfaces during imaging [30,69].
19.4.2 Micro- and Nanopatterned Polymers
Jung and Bhushan [67] studied two types of polymers: poly(methyl methacry-
late) (PMMA) and polystyrene (PS). PMMA and PS were chosen because they
are widely used in MEMS/NEMS devices. Both hydrophilic and hydrophobic sur-
faces can be produced by using these two polymers, as PMMA has polar (hy-
drophilic)groupswith high surfaceenergy whilePS has electricallyneutral andnon-
polar(hydrophobic) groups with low surface energy. Furthermore, a PMMA struc-
ture can be made hydrophobic by treating it appropriately, for example, by coating
with a hydrophobic self-assembled monolayer (SAM).
Four types of surface patterns were fabricated from PMMA: a flat film, low as-
pect ratio asperities (LAR, 1:1 height-to-diameter ratio), high aspect ratio asperities
(HAR, 3:1 height-to-diameter ratio), and a replica of the lotus leaf (the lotus pat-
tern). Two types of surface patterns were fabricated from PS: a flat film and the
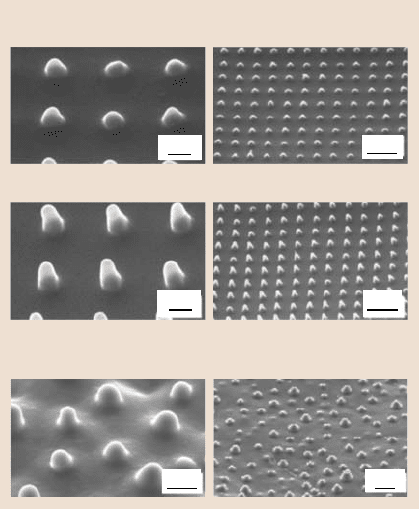
lotus pattern. Figure 19.17 shows SEM images of the two types of nanopatterned
structures, LAR and HAR, and the one type of micropatterned structure, lotus pat-
tern,all on a PMMAsurface[31,67]. Both micro-andnanopatternedstructureswere
manufacturedusing soft lithography.For nanopatternedstructures,PMMA film was
spin-coated on the silicon wafer. A UV cured mold (PUA mold) with nanopatterns
of interest was made which enables one to create sub-100nm patterns with high
aspect ratio [36]. The mold was placed on the PMMA film and a slight pressure
of ∼10 g/cm
2
(∼1 kPa) was applied and annealed at 120°C. Finally, the PUA mold
was removed from PMMA film. For micropatterned structures, polydimethylsilox-
ane (PDMS) mold was first made by casting PDMS against a lotus leaf following
by heating. As shown in Fig. 19.17, it can be seen that only microstructuresexist on
the surface of lotus pattern [67].
1034 B. Bhushan et al.
Nanopatterns
200 mn 1mμ
1mμ200 mn
Micropatterns
30 mμ10 mμ
PMMA low aspect ratio (LAR)
PMMA high aspect ratio (HAR)
PMMA Lotus replica
Fig. 19.17. Scanning elec-
tron micrographs of the two
nanopatterned polymer sur-
faces (shown using two mag-
nifications to see both the
asperity shape and the asper-
ity pattern on the surface) and
the micropatterned polymer
surface (Lotus pattern, which
has only microstructures on
the surface) [31,67]
Since PMMA by itself is hydrophilic, in order to obtain a hydrophobic sam-
ple, a self-assembledmonolayer(SAM) of perfluorodecyltriethoxysilane(PFDTES)
was deposited on the sample surfaces using vapor phase deposition technique.
PFDTES was chosen because of its hydrophobic nature. The deposition conditions
for PFDTES were 100°C temperature, 400 Torr pressure, 20 min deposition time
and 20 min annealing time. The polymer surface was exposed to an oxygen plasma
treatment (40 W, O
2
187 Torr, 10 s) prior to coating [21]. The oxygen plasma treat-
ment is necessary to oxidize any organic contaminants on the polymer surface and
to also alter the surface chemistry to allow for enhanced bonding between the SAM
and the polymer surface.
Contact Angle Measurements
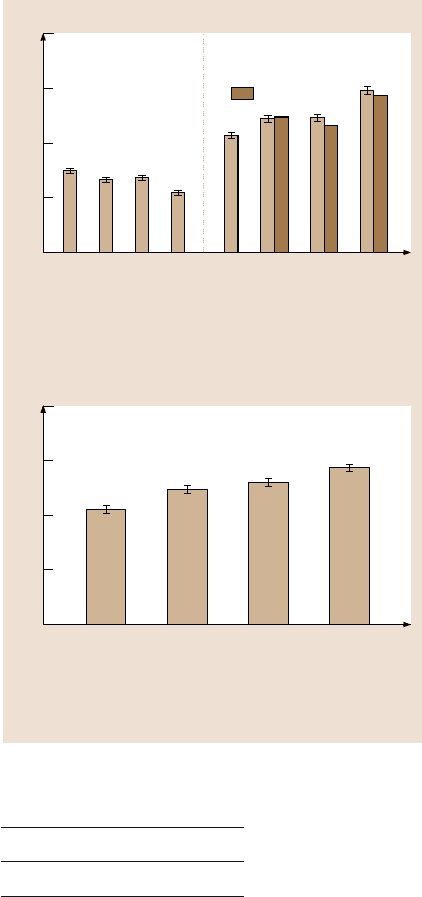
Jung and Bhushan [67] measured the static contact angle of water with the pat-
terned PMMA and PS structures; see Fig. 19.18. Since the Wenzel roughness factor
is the parameter that often determines wetting behavior, the roughness factor was
calculated and it is presented in Table 19.5 for various samples. The data show that
contact angle of the hydrophilic materials decreases with an increase in the rough-
ness factor, as predicted by the Wenzel model. When the polymers were coated with
PFDTES, the film surface became hydrophobic.Figure 19.18also shows the contact
angle for various PMMA samples coated with PFDTES. For a hydrophobicsurface,
the standard Wenzel model predicts an increase of contact angle with roughness
19 Lotus Effect: Roughness-Induced Superhydrophobic Surfaces 1035
30
60
90
120
150
Calculated
Contact angle (deg)
30
60
90
120
150
PS film
Hydrophilic Hydrophobic
Hydrophobic
PS Lotus
PFDTES on PS film
PFDTES on PS Lotus
Contact angle (deg)
PMMA film
PMMA Lotus
PMMA LAR
PMMA HAR
PFDTES on PMMA film
PFDTES on PMMA Lotus
PFDTES on PMMA LAR
PFDTES on PMMA HAR
Fig. 19.18. Contact angles for
various patterned surfaces on
PMMA and PS polymers [67]
Table 19.5. Roughness factor for micro- and nanopatterned polymers [67]
LAR HAR Lotus
R
f
2.1 5.6 3.2
1036 B. Bhushan et al.
factor, which is what happens in the case of patterned samples. The calculated val-
ues of contact angle for various patterned samples based on the contact angle of the
smooth film and Wenzel equation are also presented. The measured contact angle
values for the lotus pattern were comparable with the calculated values, whereas
for the LAR and HAR patterns they are higher. It suggests that nanopatterns benefit
from air pocket formation. For the PS material, the contact angle of the lotus pattern
also increased with increased roughness factor.
Scale Dependence on Adhesive Force
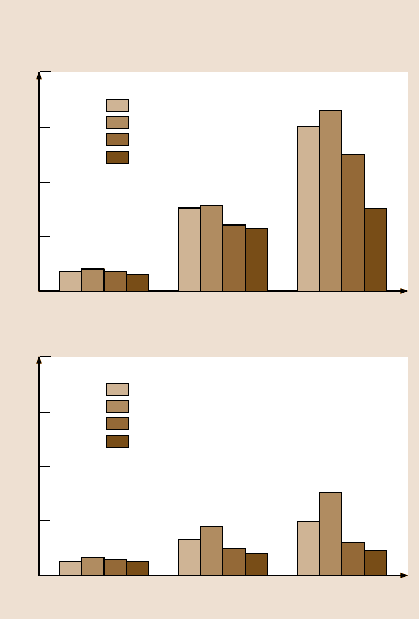
Jung and Bhushan [67] found that scale-dependenceof adhesion and friction forces
are important for this study because the tip/surface interface area changes with size.
Themeniscusforce willchange dueto eitherchangingtip radius,the hydrophobicity
of the sample, or the number of contact and near-contacting points. Figure 19.19
shows the dependence of the tip radius and hydrophobicityon the adhesiveforce for
PMMA and PFDTES coated on PMMA [67]. When the radius of the tip is changed,
the contact angle of the sample is changed, and asperities are added to the sample
PFDTES on PMMA film
PFDTES on PMMA Lotus
Adhesive force (nN)
100
200
300
400
0
PFDTES on PMMA LAR
Tip radius
PFDTES on PMMA HAR
50 mn
PMMA film
PMMA Lotus
Adhesive force (nN)
PMMA LAR
Tip radius
3.8 mμ 15 mμ
PMMA HAR
100
200
300
400
0
50 mn 3.8 mμ 15 mμ
PMMA polymers with different surface roughness patterns
(22 °C, 50 % RH)
Fig. 19.19. Scale dependent
adhesive force for various
patterned surfaces measured
using AFM tips of various
radii [67]
19 Lotus Effect: Roughness-Induced Superhydrophobic Surfaces 1037
surface, the adhesive force will change due to the change in the meniscus force and
the real area of contact.
The two plots in Fig. 19.19 show the adhesive force on a linear scale for the
different surfaces with varying tip radius. The left bar chart in Fig. 19.19 is for
hydrophilic PMMA film, Lotus pattern, LAR, and HAR, and shows the effect of
tip radius and hydrophobicity on adhesive force. For increasing radius, the adhesive
force increases for each material. With a larger radius, the real area of contact and
the meniscus contribution increase, resulting in the increased adhesion. The right
bar chart in Fig. 19.19 shows the resultsfor PFDTES coatedon eachmaterial. These
samplesshowthe same trendsas the film samples,but the increasein adhesionis not
as dramatic. The hydrophobicity of PFDTES on material reduces meniscus forces,
which in turn reduces adhesion from the surface. The dominant mechanism for the
hydrophobic material is real area of contact and not meniscus force, whereas with
hydrophilic material there is a combination of real area of contact and meniscus
forces [67].
19.4.3 Micropatterned Si Surfaces
Micropatterned surfaces produced from a single-crystalsilicon (Si) by electrolytho-
graphy and coated with a self-assembled monolayer (SAM) were used by Jung and
Bhushan [68,69] in their study. Silicon has traditionally been the most commonly
used structural material for micro/nanocomponents. A Si surface can be made hy-
drophobic by coating with a SAM. One of purposes of this investigation was to
study the transition from the Cassie–Baxter to Wenzel regimes by changing the dis-
tance between the pillars. To create patterned Si, two series of nine samples each
were fabricated using photolithography [6]. Series 1 had 5 µm diameter and 10µm
height flat-top, cylindrical pillars with different pitch values (7, 7.5, 10, 12.5, 25,
37.5, 45, 60, and 75)µm, and Series 2 has 14µm diameter and 30 µm height flat-top,
cylindrical pillars with different pitch values (21, 23, 26, 35, 70, 105, 126, 168, and
210)µm. The pitch is the spacing between the centers of two adjacent pillars. The
SAM of 1, 1, −2, 2,-tetrahydroperfluorodecyltrichlorosilane(PF
3
) was deposited on
the Si sample surfaces using vapor phase deposition technique [6]. PF
3
was chosen
because of the hydrophobic nature of the surface. The thickness and rms roughness
of the SAM of PF
3
were 1.8nmand0.14nm, respectively [71].
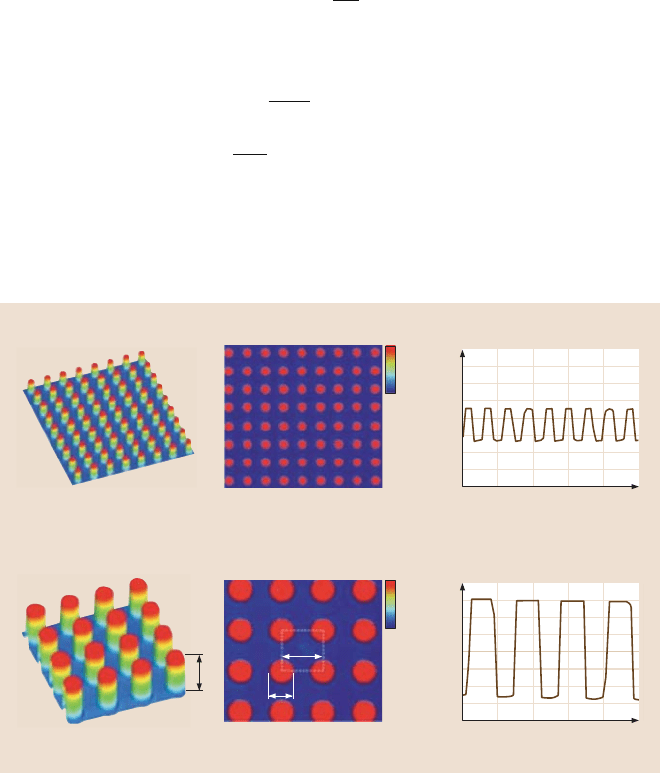
An optical profiler was used to measure the surface topography of the patterned
surfaces[18,19,69].One sampleeach fromthe two serieswas chosento characterize
the surfaces. Two different surface height maps can be seen for the patterned Si in
Fig. 19.20. In each case, a 3-D map and a flat map along with a 2-D profile in a given
location of the flat 3-D map are shown. A scan size of 100µm × 90 µm was used to
obtain a sufficient amount of pillars to characterize the surface but also to maintain
enough resolution to get an accurate measurement.
The images found with the optical profiler show the flat-top, cylindrical pillars
on the Si surface are distributed on the entire surface in a square grid with different
pitch values. Sample in two series had the same values of Wenzel roughness factors
1038 B. Bhushan et al.
(R
f
= 1+ πDH/P
2
), so that the Cassie–Baxter and Wenzel theoretical modelspredict
exactly the same series of contact angle values for all two series of nine samples.
Contact Angle Relationships for a Geometry of Flat-Top, Cylindrical Pillars
Let us consider a geometry of flat-top, cylindrical pillars of diameter D, height H,
and pitch P, distributed in a regular square array as shown in Fig. 19.20. For the
special caseof thedroplet size muchlargerthan P (of interestin thisstudy),a droplet
contacts the flat-top of the pillars forming the composite interface, and the cavities
are filled with air. For this case, f
LA
= 1−
πD
2
4P
2
= 1− f
SL
. Further assume that the flat
tops are smooth with R
f
= 1. The contact angles for the Wenzel and Cassie–Baxter
regimes are given by (19.6) and (19.9) [18].
Wenzel: cosθ =
1+
πDH
P
2
cosθ
0
(19.23)
Cassie–Baxter: cosθ =
πD
2
4P
2
(
cosθ
0
+ 1
)
−1 . (19.24)
Geometrical parameters of the flat-top, cylindrical pillars in series 1 and 2 are
used for calculating the contact angle for the above-mentioned two cases. Fig-
ure 19.21 shows the plot of the predicted values of the contact angle as a function of
20
0
–20
Height ( m)μ
Optical profiler surface height maps of patterned Si
0
100 mμ0
10 mμ
0
20
0
–20
0 20 100
Height ( m)μ
(m)μ
40 60 80
0 20 100
(m)μ
40 60 80
100 mμ
90 mμ
100 mμ
90 mμ
90 mμ
H
14 m diameter, 30 m height, 26 m pitch pillarsμμμ
5 m diameter, 10 m height, 10 m pitch pillarsμμμ
D
P
0
100 mμ0
30 mμ
0
90 mμ
Fig. 19.20. Surface height maps and 2-D profiles of the patterned surfaces using an optical
profiler. [18]
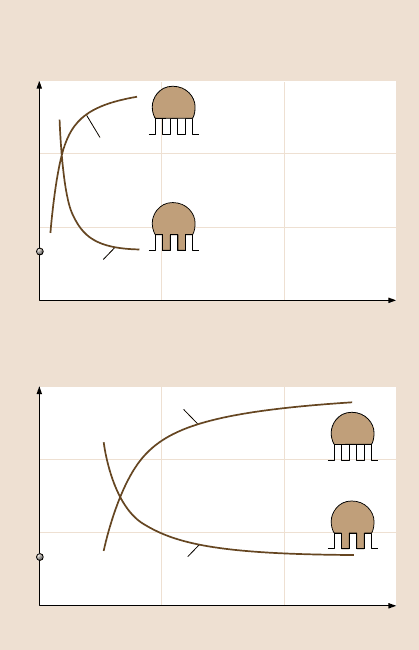
19 Lotus Effect: Roughness-Induced Superhydrophobic Surfaces 1039
Pitch ( m)μ
Pitch ( m)μ
0
Calculated static contact angle
14 m diameter, 30 m height pillarsμμ
5 m diameter, 10 m height pillarsμμ
180
150
120
90
50 100 150
Wenzel’s equation
Cassie and Baxter’s equation
0
180
150
120
90
50 100 150
Wenzel’s equation
Cassie and Baxter’s equation
Static contact angle (deg)
Static contact angle (deg)
Fig. 19.21. Calculated static
contact angle as a function
of geometric parameters for
agivenvalueofθ
0
using the
Wenzel and Cassie–Baxter
equations for two series of
the patterned surfaces with
different pitch values [18]
pitch between the pillars forthe two cases. The Wenzel and Cassie–Baxter equations
present two possible equilibrium states for a water droplet on the surface. This indi-
cates that there is a critical pitch belowwhich the composite interface dominates and
above which the homogeneousinterface dominates the wetting behavior. Therefore,
one needs to find the critical point that can be used to design the superhydrophobic
surfaces. Furthermore, even in cases where the liquid droplet does not contact the
bottom of the cavities, the water droplet can be in a metastable state and can become
unstable and with the transition from the Cassie–Baxter to Wenzel regime occurring
if the pitch is large.
Curvature-based Cassie-Wenzel Transition Criteria
A stable composite interface is essential for the successful design of superhy-
drophobic surfaces. However, the composite interface is fragile and it may trans-
form into the homogeneous interface. What triggers the transition between the
regimes remains a subject of arguments, although a number of explanations have

1040 B. Bhushan et al.
been suggested. Nosonovsky and Bhushan [100] have studied destabilizing factors
for the composite interface and found that convex surface (with bumps) leads to
a stable interface and high contact angle. Also, they have been suggested the ef-
fects of droplet’s weight and curvature among the factors which affect the transi-
tion.
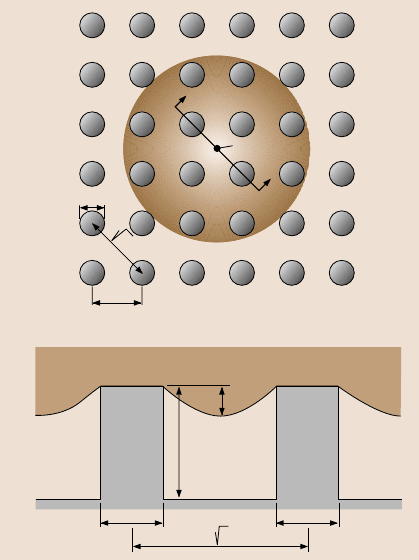
Bhushan and Jung [18,19] and Jung and Bhushan [68,69] investigated the effect
of droplet curvature on the Cassie-Wenzel regime transition. First, they considered
a small water droplet suspended on a superhydrophobicsurface consisting of a reg-
ular array of circular pillars with diameter D, height H, and pitch P as shown in
Fig. 19.22. The local deformation for small droplets is governed by surface effects
rather than gravity. The curvature of a droplet is governed by the Laplace equa-
tion, which relates the pressure inside the droplet to its curvature [2]. Therefore, the
curvature is the same at the top and at the bottom of the droplet [79, 101]. For the
patterned surface considered here, the maximum droop of the droplet occurs in the
center of the square formed by the four pillars as shown in Fig. 19.22a. Therefore,
the maximum droop of the droplet (δ) in the recessed region can be found in the
middle of two pillars which are diagonally across as shown in Fig. 19.22b, which is
(
√
2P−D)
2
/(8R). If the droop is much greater than the depth of the cavity,
√
2P−D
2
/R ≥ H (19.25)
then the droplet will just contact the bottom of the cavities between pillars, resulting
into the transition from the Cassie–Baxter to Wenzel regime. Furthermore, in the
case of large distances between the pillars, the liquid-air interface can easily be
destabilized due to dynamic effects, such as surface waves that are formed at the
liquid-air interface due to the gravitational or capillary forces. This leads to the
formation of the homogeneous solid-liquid interface. However, whether the droplet
droop or other mechanisms dominate the transition, remains to be investigated.
Contact Angle Measurements
The initial experiment performed with 1 mm in radius (5 µL volume) on the pat-
terned Si coated with PF
3
was to determine the static contact angle [18,19,68,69].
The contact angles on the prepared surfaces are plotted as a function of pitch be-
tween the pillars in Fig. 19.23a. A dotted line represents the transition criteria range
obtained using (19.25). The flat Si coated with PF
3
showed the static contact angle
of 109°. As the pitch increases up to 45 µm of series 1 and 126µmofseries2,the
staticcontact angle firstincreases graduallyfrom 152°to 170°.Then, the contactan-
gle starts decreasing sharply. Initial increase with an increase of pitch has to do with
more open air space present which increases the propensity of air pocket formation.
In the series 1, the value predicted from the curvature transition criteria (19.25) is
a little higher than the experimental observations. However, in the series 2, there is
a good agreement between the experimental data and the theoretically predicted by
Jung and Bhushan [68,69] values for the Cassie–Wenzel transition.
19 Lotus Effect: Roughness-Induced Superhydrophobic Surfaces 1041
Section A–A
b)
Maximum droop of droplet
D
P
2P
δ
H
2P
D D
a)
A
A
Fig. 19.22. Asmallwa-
ter droplet suspended on
a superhydrophobic surface
consisting of a regular array
of circular pillars. (a) Plan
view. The maximum droop of
droplet occurs in the center
of square formed by four pil-
lars. (b) Side view in section
A-A. The maximum droop of
droplet (δ) can be found in the
middle of two pillars which
are diagonally across [68,69]
Figure 19.23b shows hysteresis and tilt angle as a function of pitch between the
pillars [18,19]. The flat Si coated with PF
3
showed a hysteresis angle of 34° and tilt
angle of 37°. The patterned surfaces with low pitch increase the hysteresis and tilt
angles compared to the flat surface due to the effect of sharp edges on the pillars,
resulting into pinning [97]. Hysteresis for a flat surface can arise from roughness
and surface heterogeneity. For a droplet moving down on the inclined patterned
surfaces, the line of contact of the solid, liquid and air will be pinned at the edge
point until it will be able to move,resulting into increasing hysteresis and tilt angles.
Figure 19.24 shows droplets on patterned Si with 5µm diameter and 10µm height
pillars with different pitch values. The asymmetrical shape of the droplet signifies
pinning. The pinning on the patterned surfaces can be observed as compared to the
flat surface. The patterned surface with low pitch (7 µm) has more the pinning than
the patterned surface with high pitch (37.5µm), because the patterned surface with
low pitch has more sharp edges contacting with a droplet.
For various pitch values, hysteresis and tilt angles show the same trends with
varying pitch between the pillars. After an initial increase as discussed above, they
gradually decrease with increasing pitch (due to reduced number of sharp edges)
and show an abrupt minimum in the value which has the highest contact angle. The
lowest hysteresis and tilt angles are 5° and 3°, respectively, which were observed
