ASM Metals HandBook Vol. 17 - Nondestructive Evaluation and Quality Control
Подождите немного. Документ загружается.

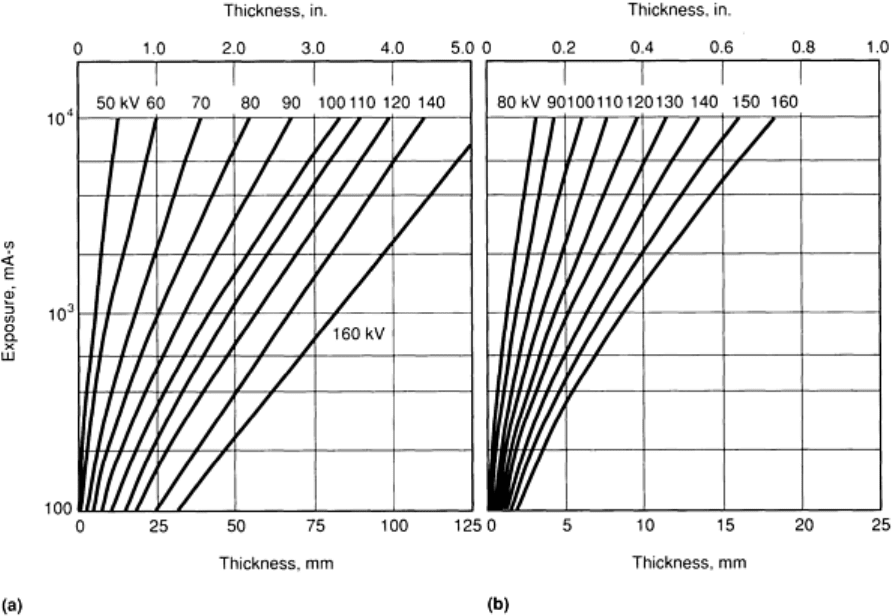
Fig. 40
Typical radiographic exposure charts for (a) aluminum and (b) steel for a film density of 2.0 without
screens that relate exposure to
thickness of testpieces for several values of tube voltage. Charts for aluminum
and steel were prepared specifically for an Andrex 160-kV directional x-ray machine, using a source-to-
film
distance of 910 mm (36 in.) and Industrex AA film (Eastman Kodak) de
veloped in a manual process for 7 min
in PIX developer (Picker).
Although published exposure charts are acceptable guides for equipment selection, more accurate charts that are prepared
under normal operating conditions are recommended for each x-ray machine. A simple method for preparing accurate
exposure charts is as follows:
1. Make a series of radiographs of a calibrated multiple-
thickness step wedge, using several different
values of exposure at each of several different tube voltage settings
2. Process t
he exposed films together under conditions identical to those that will be used for routine
application
3.
From the several densities corresponding to different thicknesses, determine which density (and
thickness) corresponds exactly with the density desired
for routine application. This step must be done
with a densitometer because no other method is accurate. If the desired density does not appear on the
radiograph, the thickness corresponding to the desired density can be found by interpolation
4. Using the thickness determined in step 3 and the tube voltage (kilovoltage) and exposure (milliamp-
second or milliampmin) corresponding to that piece of film, plot the relation of thickness to exposure on
semilogarithmic paper with exposure on the logarithmic scale
5. Draw lines of constant tube voltage through the corresponding points on the graph
The resulting chart will be similar to those in Fig. 40, but will be accurate for the x-ray machine, type of film, and film
development technique that were used. Different charts should be prepared for different film types, both with and without
screens.
Charts prepared as described above will be strictly accurate only for testpieces of uniform thickness. Some adjustment in
exposure or source-to-film distance will have to be made for the more usual circumstances involving testpieces of
nonuniform thickness.
Latitude charts can sometimes be used to help determine the correct exposure when the thickness of a testpiece varies
within the area of coverage. Latitude is a range of metal thickness that produces a specific range of density in the
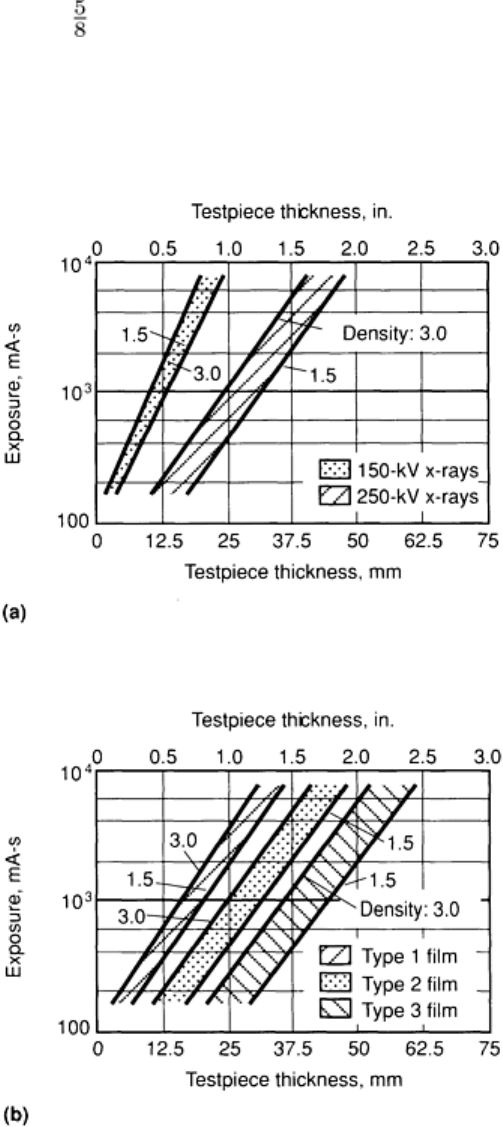
processed film for a given combination of radiation spectrum, source-to-film distance, and exposure. The bands in Fig. 41
are latitude curves for the inspection of steel testpieces using x-rays from a 250-kV x-ray machine. As shown in Fig.
41(a), increasing the tube voltage not only decreases the exposure needed to radiograph a section of given nominal
thickness but also increases the range of testpiece thickness that is satisfactorily recorded on the radiograph. For example,
at a nominal steel thickness of 15 mm ( in.), about 2200 mA-s exposure is needed to produce a satisfactory image on
type 2 film with 150-kV x-rays; the image will have satisfactory density for a range of thickness from about 14 to 18 mm
(0.57 to 0.70 in.). On the other hand, when 250-kV x-rays are used, an equivalent image can be produced on type 2 film
with only about 220 mA-s exposure, and thicknesses from about 13 to 20 mm (0.50 to 0.78 in.) can be recorded with
satisfactory density.
Fig. 41 Latitude curves for the radiographic inspection of steel at film densities ranging from 1.5
to 3.0. (a)
Effect of tube voltage on latitude of a type 2 radiographic film. (b) Effect of film type on latitude for radiography
using 250-kV x-rays. Curves were prepared from data obtained using a 250-kV x-ray machine, 910-mm (36-
in.) source-to-film distance, and 0.25 mm (0.010 in.) thick lead screens.
Films were processed using a
standardized technique.
Alternatively, latitude charts for different types of film can be used to determine the ranges of thickness covered by each
type at a given exposure (Fig. 41b). The difference in latitude for different types of film is one basis for the use of
multiple-film techniques. For example, if a steel testpiece is radiographed using 250-kV x-rays and a film holder loaded
with one sheet each of types 1, 2, and 3 film, then a range of testpiece thickness of 13 to 40 mm (0.5 to 1.6 in.) can be
recorded with a single exposure of 600 mA-s. Each of the films is viewed and interpreted separately for the range of
thickness corresponding to its optimum density range. For thicknesses corresponding to gaps between optimum density
ranges for the different films, enough contrast and detail usually exist in one or both of the films on either side of the gap
to yield a satisfactory image.
When filters are used or when other variations in technique are introduced, further adjustments in exposure or source-to-
film distance will have to be made. In fact, if large numbers of a given part are to be inspected, it is usually worthwhile to
make a series of radiographs of a representative testpiece using different tube voltages and different exposures. From the
results of these experiments a standard setup and exposure can be established.
When there is only one opportunity to inspect a part for which there is no established standard technique or when
circumstances will not permit experimentation, one of several alternative techniques can be used. For example, replicate
radiographs can be made using different values of one or more of the following: tube voltage, tube current, exposure time,
source-to-film distance, or film speed. Alternatively, film holders can be loaded with two or more sheets of film, either of
the same type or of different types; the resulting radiographs can be viewed both as double-film and single-film images to
obtain wider latitude. The latter technique, using two or more sheets of film, is especially useful when there are large
variations in testpiece thickness. Sometimes, it can be advantageous to adopt the technique for routine applications.
Another method involves making duplicate radiographs with and without a filter or with and without lead screens. In such
cases, exposure time and tube current will have to be varied to compensate for either beam attenuation with a filter or the
combined effects of filtration and intensification with lead screens.
Exposure charts apply only to the material of which the step wedge was composed. Most often, this is a standard material
such as aluminum or steel. However, exposure charts for a standard material can be used to determine exposure factors
for other materials by applying radiographic equivalence factors such as those listed in Table 5. First, the exposure is
derived from the exposure chart as if the part were actually made out of the standard material. The exposure so derived is
then multiplied by the radiographic equivalence factor from Table 5. For example, if a 13 mm ( in.) thick part made of
titanium is to be radiographed using 150-kV x-rays without screens, the exposure for a 13 mm ( in.) thick part made of
steel can be determined from the exposure chart in Fig. 40(b). That exposure would be 4000 mA-s for a source-to-film
distance of 910 mm (36 in.). From Table 5, the radiographic equivalence of titanium for 150-kV x-rays is 0.45. Thus, for
150-kV x-rays and a source-to-film distance of 910 mm (36 in.), the exposure for the titanium part would be 0.45 times
4000 mA-s, or 1800 mA-s. A reasonable exposure for this part would be 2 min (120 s) at 15-mA tube current.
In addition to exposure charts, nomograms or specially constructed slide rules are often used for calculating radiographic
exposures. These devices can be constructed using the same type of information as that used in constructing exposure
charts. The main advantage of these devices is speed in making a calculation, which can reduce setup time and produce
economic benefits.
Gamma-ray exposure charts are constructed in a manner similar to the exposure charts used in determining x-ray
exposures. Instead of expressing the exposure in milliampere-seconds, -ray exposures are expressed in curie-hours or
curie-minutes. To use a -ray exposure chart, the source strength must be known. Source strength decreases
exponentially with time, and each radioactive isotope had a characteristic half-life. This behavior can be used to
determine the strength of a radioactive source at any one time, provided its strength at one time is known. (Normally,
source manufacturers provide the source strength as of a given date along with each new source). A graph of source
strength versus time is constructed as described in the following paragraph.
On the logarithmic scale of semilogarithmic graph paper, plot the known source strength. (For convenience, the date
when the determination of source strength was made should be noted.) Divide the linear scale into convenient units of
time (with the known source strength corresponding to zero time), extending the scale at least one half-life. At the time
corresponding to one half-life, plot a point corresponding to half of the known source strength that was plotted at zero
time. Draw a straight line between the two points, extending the line as far beyond the second point as desired. This line
represents the source strength at any time; if desired, the linear scale may now be renumbered using dates, so that at any
time the source strength corresponding to a given date can be seen at a glance.
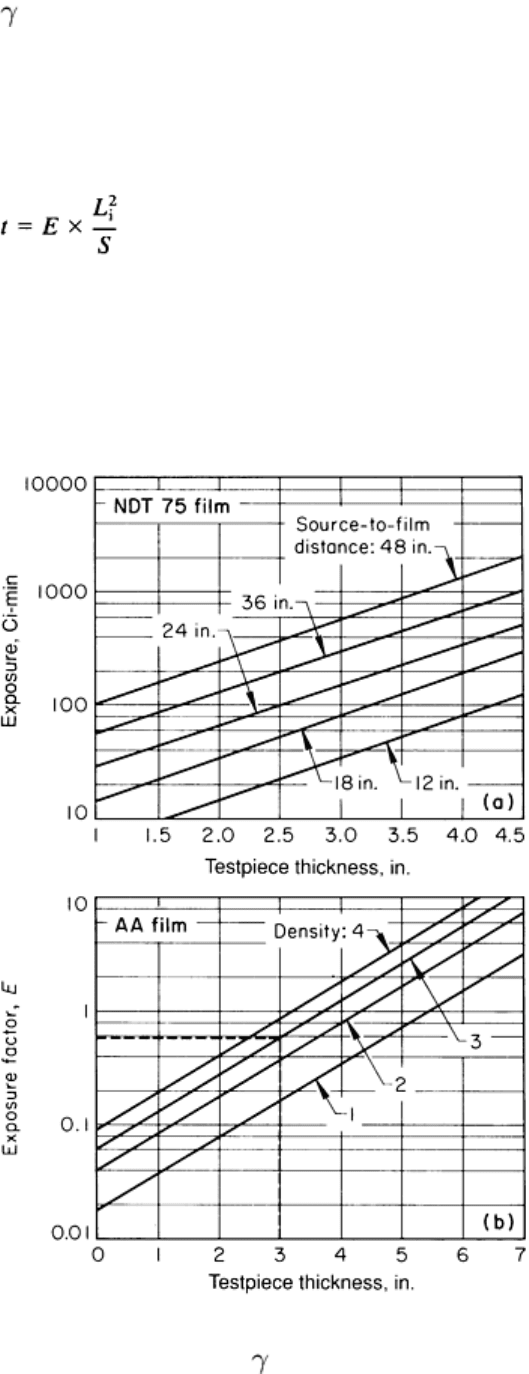
Figure 42 shows two types of -ray exposure charts for cobalt-60 radiation and testpieces of steel, gray iron, or ductile
iron. In Fig. 42(a), exposure in curie-minutes to produce an average photographic density of 2.0 is read directly for each
combination of testpiece thickness and source-to-film distance. Exposure time is determined by dividing exposure
determined from the chart by the source strength determined as outlined in the preceding paragraph. In Fig. 42(b), an
exposure factor is read directly for each combination of testpiece thickness and desired photographic density. The
exposure time is calculated from:
(Eq 18)
where t is the exposure time in minutes, E is the exposure factor, L
i
is the source-to-film distance (in inches), and S is the
source strength (in curies). For example, if it is desired to radiograph a 3 in. thick steel testpiece on Industrex AA film
with a photographic density of 3.0 and if a 15-Ci cobalt-60 source is to be used at a source-to-film distance of 12 in., then
the corresponding exposure factor is 0.58 (dashed line, Fig. 42), and from Eq 18, the exposure time is t = 0.58 × 12
2
/15 =
5.6 min.
Fig. 42 Two types of exposure chart for computing -ray exposures that apply to Co-
60 radioisotopes and
steel, gray iron, or ductile iron testpieces. (a) Exposure in curie-
minutes to produce a photographic density of
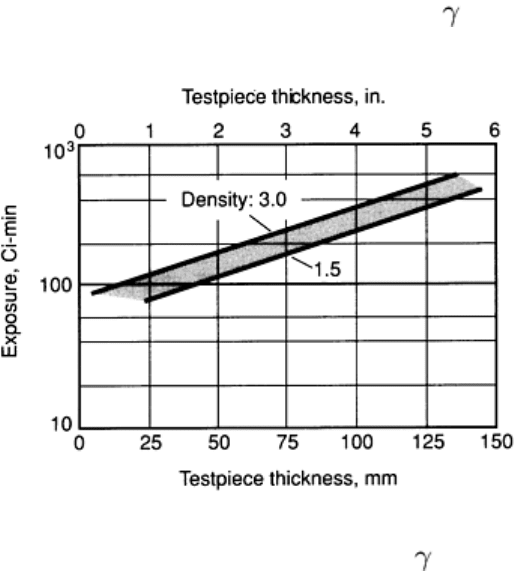
2.0 on NDT 75 film (DuPont) as a function of testpiece thickness for various source-to-
film distances. (b)
Exposure factor, E,
for Industrex AA film (Eastman Kodak) as a function of testpiece thickness; four lines of
constant photographic density are shown.
As with x-ray exposures, latitude charts such as the one shown in Fig. 43 can be used to determine the range of thickness
that can be recorded with a given exposure. By comparing Fig. 43 with Fig. 41, it can be seen that the latitude of type 2
film with cobalt-60 radiation is almost four times the latitude of type 2 film with 250-kV x-rays. Also, as with x-ray
exposures, nomograms or slide rules can be constructed to simplify calculation of -ray exposures.
Fig. 43 Latitude curve for radiographic inspection of steel using Co-60 -
rays to produce a film density range
of 1.5 to 3.0. Curve is for type 2 film exposed at a source-to-
film distance of 810 mm (32 in.) and with 0.25
mm (0.010 in.) thick lead screens both front and back.
Selection of View
The view selected for the radiography of a testpiece is a major factor that controls the ability to detect certain types of
flaws. In some circumstances, although flaws are detected, the selected view presents an unsatisfactory or distorted
picture of the relationship of the flaws to testpiece shape. For example, a crack in the fillet of a T-shape section of a
casting or in a weld in a T-shape weldment is most likely to be revealed when the radiation is directed along the bisector
of the angle between the legs of the section, because most cracks in such a location run perpendicular to the surface
midway between the legs of the T. When the radiation is directed at an equal angle to both legs, it is most likely to be
parallel to any crack that is present, which is the most favorable orientation for revealing cracks. With this orientation,
however, there is no distinct line of demarcation between the sections of different thickness, and the portions of the
testpiece that have the greatest object-to-detector distance will be recorded with a considerable degree of unsharpness and
distortion.
Radiographic Shadows. As discussed in the section on "Principles of Shadow Formation" in this article, radiographic
images can be compared to the shadows formed when a beam of light is interrupted by an opaque object. The difference
between shadows and radiographic images is that in the umbra of a shadow there is a complete absence of radiation from
the light source, while in the umbral region of a radiograph the amount of radiation that falls on the image conversion
medium depends mainly on the absorption characteristics of the testpiece. Ordinarily, only the umbral region of a
radiograph is of interest because it is only in this region that internal features of the testpiece are revealed.
When a section of the testpiece contains a discontinuity that is essentially planar, such as a crack or cold shut, the planar
discontinuity will be revealed only when the radiation is parallel or nearly parallel to that discontinuity (Fig. 44a). Such a
discontinuity can be revealed as a difference in absorption compared to the surrounding material only when the radiation
impinges on the edge of the discontinuity, as shown at left in the actual setup in Fig. 44(a). In all other orientations, such
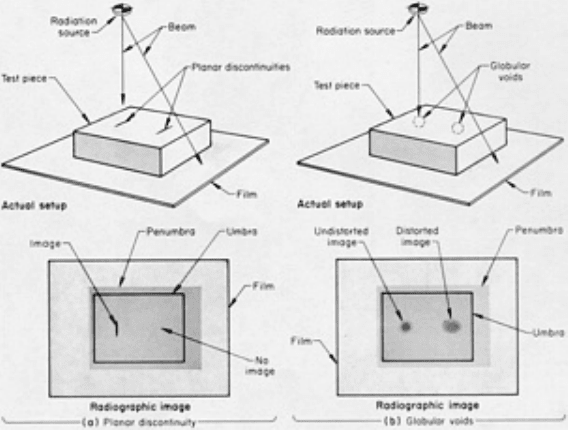
as that shown at right in the actual setup in Fig. 44(a), the effective thickness of the testpiece is the same, whether in the
region of the planar discontinuity or not, and there is no difference in absorption.
Fig. 44
Effect of direction of radiation beam on the appearance of (a) planar discontinuities (such as cracks or
cold shuts) and (b) globular voids. See text for discussion.
When a section of the testpiece contains a flaw that is spherical in shape, such as a globular void or inclusion, the flaw
will be revealed regardless of viewing direction. However, as shown in Fig. 44(b), the shape of a void will be undistorted
only when it is aligned with the portion of the radiation beam that is perpendicular to the plane of the recording medium.
Distortion is less of a problem for long source-to-detector distances and small testpieces than for short source-to-detector
distances or large testpieces.
The size of almost all spherical flaws is difficult to assess. The thickness of a spherical flaw is greatest along a line
through the center of the flaw and decreases to nil at the outer edge. Correspondingly, the thickness of the surrounding
material is at least at the center of the spherical flaw. Thus, for example, the amount of radiation passing through the
testpiece is greatest in the shadow of the center of a void. Progressively outward from the center, the image of the void
will grow gradually less dense as the effective thickness of the void grows smaller, and finally the image of the void will
fade into the image of the surrounding material. Images of spherical flaws are more distinct and true in size when the
flaws account for a substantial portion of the thickness of the section or when the features have absorption characteristics
that are markedly different from those of the matrix. Also, the image will be larger than the flaw itself, less distinct, and
more likely to be distorted the farther the flaw is above the plane of the image conversion medium.
Figure 45 shows the effect of viewing direction on the image of a solid block of material. When the center of the block is
aligned with the central beam and one side of the block rests on the image conversion medium (in this case, film as shown
in setup 1 in Fig. 45), the central region of the image presents an undistorted view of the lower surface of the block.
Surrounding the undistorted region is a region representing an enlarged view of the upper portion of the block, and
surrounding this region is the penumbra. When the block is tilted onto one edge but still aligned with the central beam
(setup 2, in Fig. 45), the entire image is distorted and is surrounded by a distorted penumbra. When the block rests on the
film but the radiation beam is inclined to both the block and the film (setup 3, Fig. 45), only the image of the lower
surface of the block remains undistorted. The remainder of the image is enlarged or otherwise distorted; the greater the
object-to-detector distance, the greater the enlargement or distortion. The penumbra is enlarged or distorted similarly to
the way the image is affected.
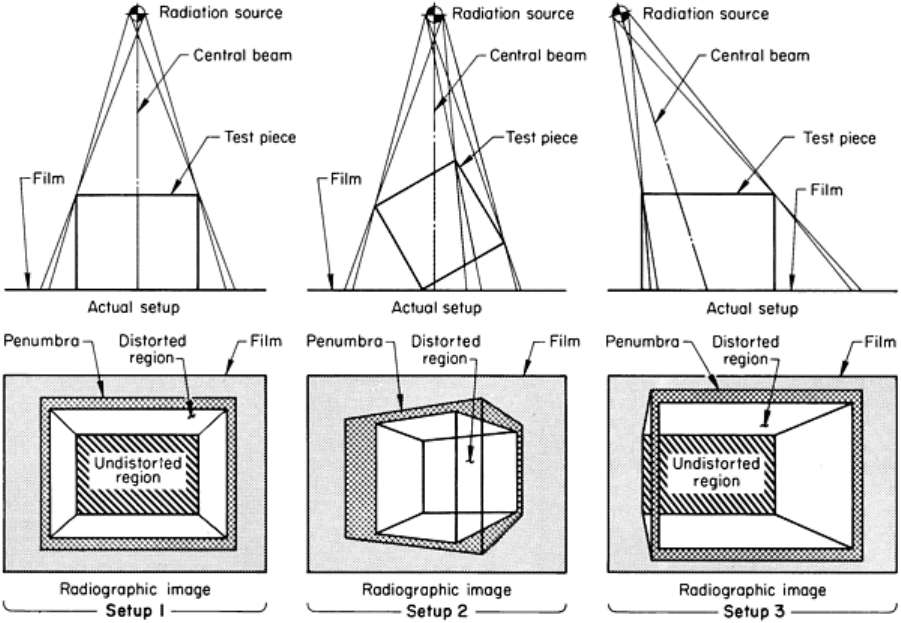
Fig. 45 Effect of viewing direction on the radiographic image of a solid block of material.
See text for
discussion.
It is important to understand that almost all radiographic images are somewhat distorted in size or shape or both, as
compared to the actual features they represent. When viewing or interpreting radiographs, the individual features in the
image should be recognized as projected shadows of the actual features in the testpiece.
Inspection of Simple Shapes
It is usually best to direct the radiation at right angles to a surface, along a path that presents minimum thickness to the
radiation. This not only increases the radiation intensity reaching the detector but, more important, also ensures that any
internal feature (except for a planar feature that is not parallel to the radiation beam) will generate the greatest subject
contrast. Obviously, for a flaw of a given size, the difference between the amount of radiation transmitted through the
material in the area of the flaw and the amount transmitted through an adjacent area will be greater if the flaw occupies a
greater portion of the testpiece thickness.
When the presence of planar discontinuities (cracks) is suspected, radiation must be directed essentially parallel to the
expected crack plane, regardless of testpiece thickness in that direction. In film radiography, any increased inspection cost
resulting from increased exposure time is well justified because only a view parallel to the crack plane will reveal a crack.
Flat plates have the simplest shape and are usually inspected by radiography as an integral part of a more complex
assembly or component. The most favorable direction for viewing a flat plate is one in which the radiation impinges
perpendicular to the surface of the plate and penetrates the shortest dimension. The image is produced with minimum
distortion and with maximum sensitivity and resolution of internal features.
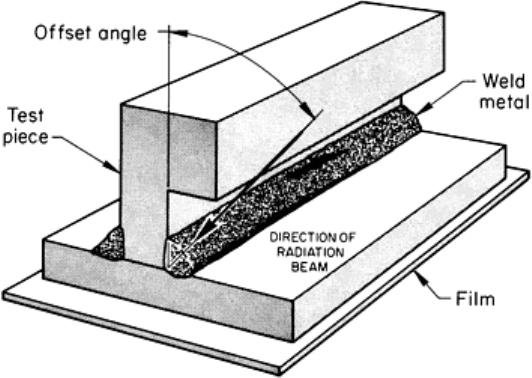
When inspecting a difficult-to-reach region of a complex-shape part, it may be necessary to avoid superimposing the
image of one section on another, by selecting a viewing direction other than 90° for a flat-plate section, as shown in Fig.
46 with film as the conversion medium. Nevertheless, except when there is a good reason to do otherwise, it is always
desirable to use a viewing direction as close to 90° as possible. Except in the most unusual circumstances, views parallel
or nearly parallel to the plate surface should be avoided. These views give severely reduced resolution of detail, a high
degree of image distortion, and an excessively low level of radiation intensity transmitted through the testpiece.
Fig. 46 Use of offset radiation beam to avoid superimposing image of one section of a complex-
shape part on
another when inspecting difficult-to-reach regions
When large areas are being radiographed, they should be inspected as a series of radiographs, each one overlapping the
area of coverage of all adjacent radiographs. Use of a relatively short source-to-detector distance and multiple,
overlapping radiographs is frequently more satisfactory than a single large radiograph. The long source-to-detector
distance necessary to avoid the type of distortion illustrated in Fig. 44 and 45 reduces the intensity of transmitted radiation
and may require frame summing in real-time radiography or longer exposures in film radiography. In film radiography,
the longer exposures of the single-exposure technique may make the single-exposure technique uneconomical as
compared to a multiple-exposure technique.
Curved plates are most satisfactorily inspected using views similar to those for flat plates. For optimum resolution of
detail, the image conversion plane should be shaped to conform with that of the back surface of the curved plate. If the
curved plate has its convex side toward the incident radiation, it is usually advantageous to minimize distortion by making
multiple radiographs with reduced individual areas of coverage. If the curved plate has its concave side toward the
incident radiation, a distortion-free image can be achieved by placing the source at the center of the radius of curvature. In
this latter case, there is no angular limit to the area that can be inspected in a single radiograph, except for any limitations
imposed by the directionality of the radiation field. Frequently, this technique is used for the on-site radiography of large-
diameter pipes. The source is placed on the centerline of the pipe, and simultaneous exposures are made on one or more
films wrapped around the outside of the pipe. The entire circumference is inspected with one shot because the source
emits equal amounts of radiation in all directions.
This panoramic technique can also be used for the simultaneous inspection or exposure of several small parts. In a
panoramic exposure, testpieces are placed in a circle around a source that emits equal radiation intensity in all directions.
Separate films are placed behind each testpiece, and all are exposed at one time.
Solid cylinders can be inspected either by a longitudinal view, which is generally satisfactory only for short large-
diameter cylinders, or by a transverse view, which is most satisfactory for relatively small-diameter cylinders. If the
cylinder is neither short nor small in diameter, either view poses problems to the radiographer. However, in such cases,
the transverse view is usually satisfactory.
The thickness of a cylindrical testpiece varies across a diametral plane in a similar manner as for a sphere, being thickest
in the center and progressively thinning out to nil thickness at the edges. Edge definition is relatively good for light-metal
cylinders less than about 50 mm (2 in.) in diameter and for heavy-metal cylinders less than about 25 mm (1 in.) in
diameter. When the diameter of the cylinder exceeds these values, multiple radiographs using different tube voltages are
usually needed to increase the latitude (or dynamic range) of the inspection. In real-time radiography, image processing
can also increase the latitude for inspecting the inner and outer portions of the cylinder. In film radiography, double-film
techniques can also correct for the inevitable overexposure of the outer portions of the image. An alternative technique is
to make a radiograph at the proper exposure for all but the outer portions of the image, then rotate the cylinder 90° and
make a second radiograph at the same exposure.
Sometimes, section-equalizing techniques are helpful in film (or paper) radiography. In a section-equalizing technique,
the outer edges of the cylinder, where the section is thinnest, are built up to present a greater radiographic density to the x-
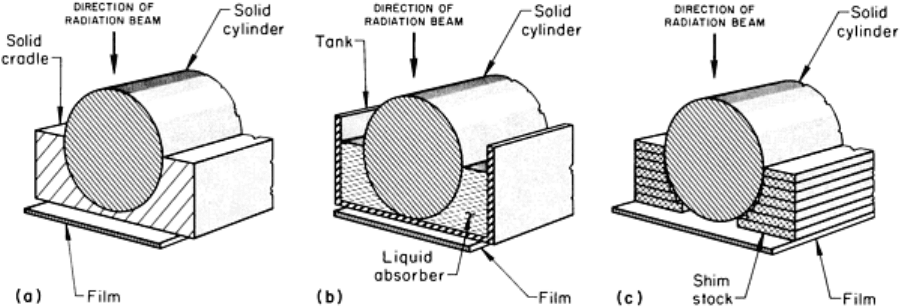
rays. Close-fitting solid cradles, liquid absorbers, or many layers of shim stock--all having radiographic absorption
characteristics equivalent to those of the cylinder--are alternative means of equalizing radiographic density (Fig. 47).
Regardless of the form of the absorber, it is placed in contact with the cylinder around one-half of the circumference, as
shown in Fig. 47. The effect of a section-equalizing technique is to reduce the subject contrast by about one-half. This is
usually sufficient to ensure that the entire image of the cylinder will have a photographic density within the range that can
be interpreted correctly.
Fig. 47
Three alternative methods of equalizing radiographic density to avoid overexposure of the image of
thinner portions of a solid cylinder. The solid cradle (a), liquid a
bsorber (b), and shim stock (c) have
radiographic absorption characteristics equivalent to those of the cylinder.
Because the probable orientation of planar discontinuities is difficult to define for cylinders, it is good practice to make
more than one radiograph, rotating the cylinder equal amounts between them. Two radiographs, 90° apart, would be
considered a minimum number.
In general, hollow cylinders (or tubular sections) present fewer problems to the radiographer than solid cylinders. For
example, in hollow cylinders or tubular sections, there is much less subject contrast because of the nonabsorbing cavity in
the center. The inspection of hollow cylinders is discussed in the section "Inspection of Tubular Sections" in this article.
Inspection of Complex Shapes
The inspection of complex shapes most often requires multiple exposures, usually with different viewing directions. The
selection of view for each exposure depends primarily on the shape of the section of the testpiece to be inspected with that
exposure and the probable orientation of suspected flaws. In principle, the view should be chosen with the objectives of
minimizing geometric unsharpness and of reducing the image to a simple shape for easy interpretation. A small variation
in testpiece thickness is desirable because this will highlight subject contrast due to flaws. However, the use of high-
energy sources, multiple radiographs with different radiation energy levels, or double-film techniques with a single view
can circumvent most problems arising from excessive material-thickness variations over a given area of coverage. The
following example illustrates the use of three different views to obtain complete coverage of a cast stainless steel
impeller.
Example 2: Three-View, Nine-Shot Inspection of a Large Cast CF-8M Stainless Steel
Impeller.
A large impeller cast from CF-8M stainless steel (Fig. 48) was specified to be radiographically inspected in accordance
with ASTM E 94, E 1030, and E 142, using the standard radiographs of ASTM E 186 and E 446 as a reference for
acceptance. The impeller was to be inspected in the as-cast, center-bored condition; specified image quality with plaque
penetrameters was 2-2T.
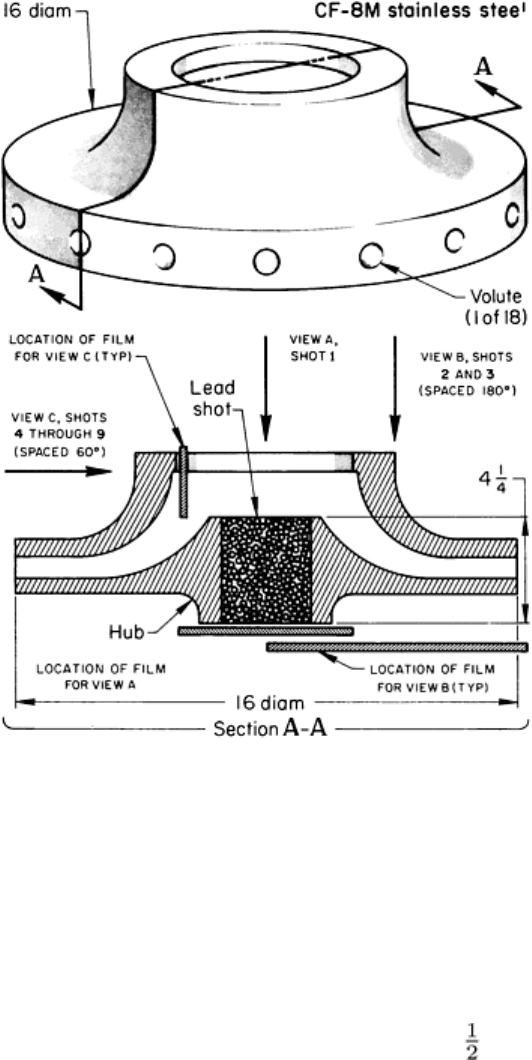
Fig. 48 Cast CF-
8M stainless steel impeller that required three different viewing directions and nine separate
shots to provide complete coverage in radiographic inspection. Dimensions given in inches
Three different views were chosen to provide complete coverage of the impeller. These are shown in Fig. 48 as view A,
selected to inspect the hub (a hollow cylinder) with a single shot; view B, using two shots with each providing coverage
of half of the 18 volutes in the impeller; and view C, using six shots with each providing coverage of the thicker section
of three volutes in a direction that is perpendicular to view B.
View A presented certain problems, namely, the high absorption of the 115 mm (4 in.) thick hub, which required high-
intensity radiation of relatively high energy for adequate penetration, and the bore area along the central axis, which
allowed incident radiation to impinge directly on the film and favored undercut because of side scattering along the
cylindrical wall of the bore. The hub could not be radiographed in a radial plane because of excessive interference by the
surrounding volutes, so the bore was filled with lead shot to absorb the direct radiation in this region and to eliminate
undercut.
All radiographs were made with a source-to-film distance of 1.5 in (5 ft), and 1-MV x-rays were used from a source
having an 8 mm (0.3 in.) focal-spot size. Shot 1 (view A) was made with 3.0 mA tube current and 4.7-min exposure time
on a 180 × 430 mm (7 × 17 in.) double film of NDT 75 (DuPont). Shots 2 and 3 (view B) were made with 1.0-mA tube
current and 2.2-min exposure time on three 350 × 430 mm (14 × 17 in.) films of different types--one sheet each of NDT
45 (DuPont), Industrex M, and Industrex AA (Eastman Kodak). Shots 4 to 9 (view C) were made with 1.0-mA tube
current and 2.5-min exposure time on 125 × 175 mm (5 × 7 in.) double films of Industrex M (Eastman Kodak). Lead
screens, 0.13 mm (0.005 in.) thick, were used both front and back.
