Askeland D.R., Fulay P.P. Essentials of Materials Science & Engineering
Подождите немного. Документ загружается.

9-38 What is the di¤erence between fusion welding,
brazing, and soldering?
9-39 What is a heat a¤ected by zone?
9-40 Explain why, while using low intensity heat
sources, the strength of the material in a weld re-
gion can be reduced.
Design Problems
g
9-41 When two 1.25-cm-thick copper plates are joined
using an arc-welding process, the fusion zone
contains dendrites having a SDAS of 0.006 cm.
However, this process produces large residual
stresses in the weld. We have found that residual
stresses are low when the welding conditions
produce a SDAS of more than 0.02 cm. Design a
process by which we can accomplish low residual
stresses. Justify your design.
9-42 Design an e‰cient risering system for the casting
shown in Figure 9-26. Be sure to include a sketch
of the system, along with appropriate dimensions.
9-43 An aluminum casting is to be injected into a steel
mold under pressure (die casting). The casting is
essentially a 30-cm-long, 5-cm-diameter cylinder
with a uniform wall thickness, and it must have
a minimum tensile strength of 276 MPa. Based
on the properties given in Figure 9-10, design the
casting and process.
9-44 Baseball Bat Materials. What sort of new mate-
rials can you suggest for making baseball bats?
Think about the specific strength of the materials,
their ability to withstand impact, and corrosion.
Also, assume that the goal is to be able to allow a
player hitting the ball as far as possible, and this
means that springback or the trampoline e¤ect
will be important.
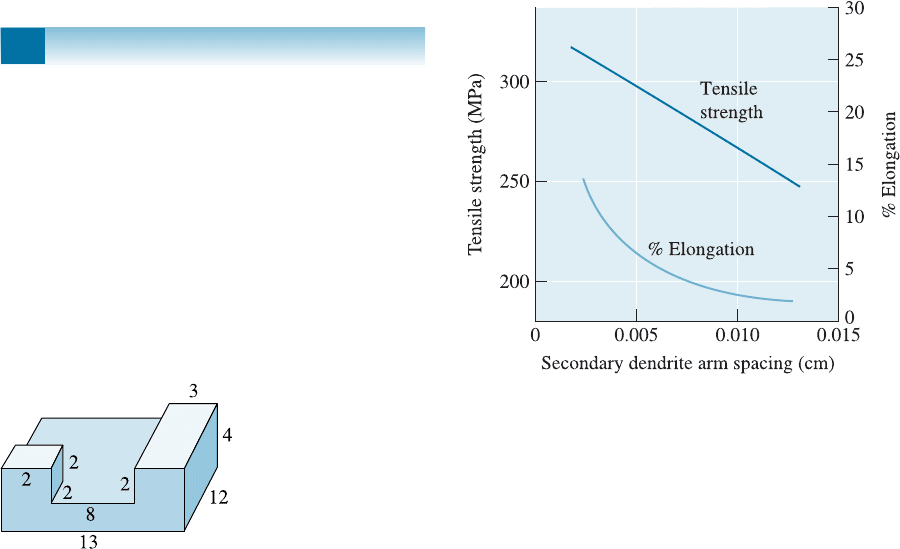
Figure 9-26 Casting to be risered (for Problem 9-42).
Figure 9-10 (Repeated for Problem 9-43) The effect
of the secondary dendrite arm spacing on the
properties of an aluminum casting alloy.
C H A P TE R 9 Principles and Applications of Solidification290

10
Solid Solutions and Phase
Equilibrium
Have You Ever Wondered?
9 Is it possible for the solid, liquid, and gaseous forms of a material to coexist?
9 How ice skaters m ove so easily on ice?
9 When an alloy known as brass solidifies, which element solidifies first—copper or zinc?
The yield strength of metallic materials can in-
crease if more obstacles for dislocation motion
are created. In this chapter, we beg in to explore
the formation of a solid solution in metallic and
ceramic systems. A solid solution is a solid mate-
rial in which atoms or ions of elements constitut-
ing it are dispersed uniformly. The mechanical
and other properties of materials can be controlled
by creating point defects, such as substitutional
and interstitial atoms. In metallic materials, the
point defects disturb the atomic arrangement in
the crystalline material and interfere with the
291

movement of dislocations or slip. The point de-
fects, therefore, cause a metallic material to be
solid-solution strengthened.
The introduction of alloying elements or impurities,
during processing, changes the composition of the ma-
terial and influences its solidification behavior. In this
chapter, we examine this effect by introducing the con-
cept of an equilibrium phase diagram. For now, we
consider a ‘‘phase’’ as a unique form in which a mate-
rial exists. We will define the term ‘‘phase’’ more pre-
cisely later in this chapter. A phase diagram depicts the
stability of different phases for a set of elements (e.g., Al
and Si). From the phase diagram, we can predict how a
material will solidify under equilibrium conditions. We
can also predict what phases will be expected to be
thermodynamically stable and in what concentrations
such phases should be present.
Therefore, the major objectives of this chap-
ter are to explore:
1. the formation of solid solutions;
2. the effects of solid-solution formation on
the mechanical properties on metallic
materials;
3. the conditions under which solid sol-
utions can form;
4. the development of some basic ideas
concerning phase diagrams; and
5. the solidification process in simple alloys.
10-1 Phases and the Phase Diagram
In most applications of engineered metallic materials, we use alloys rather than pure
elements. We define an ‘‘alloy’’ as a material that exhibits properties of a metallic ma-
terial and is made from multiple elements. A plain carbon steel is an alloy of iron (Fe)
and carbon (C). Corrosion-resistant stainless steels are alloys that usually contain iron
(Fe), carbon (C), chromium (Cr), nickel (Ni), and some other elements. Similarly, there
are alloys based on aluminum (Al), copper (Cu), cobalt (Co), nickel (Ni), titanium (Ti),
zinc (Zn), and zirconium (Zr). There are two types of alloys: single-phase alloys and
multiple-phase alloys. In this chapter, we will examine the behavior of single-phase
alloys. As a first step, let’s define a ‘‘phase’’ and determine how the phase rule helps us
to determine the state—solid, liquid, or gas—in which a pure material exists.
A phase can be defined as any portion, including the whole, of a system which is
physically homogeneous within itself and bounded by a surface so that it is mechan-
ically separable from any other portions. For example, water has three phases—liquid
water, solid ice, and steam. A phase has the following characteristics:
1. the same structure or atomic arrangement throughout;
2. roughly the same composition and properties throughout; and
3. a definite interface between the phase and any surrounding or adjoining phases.
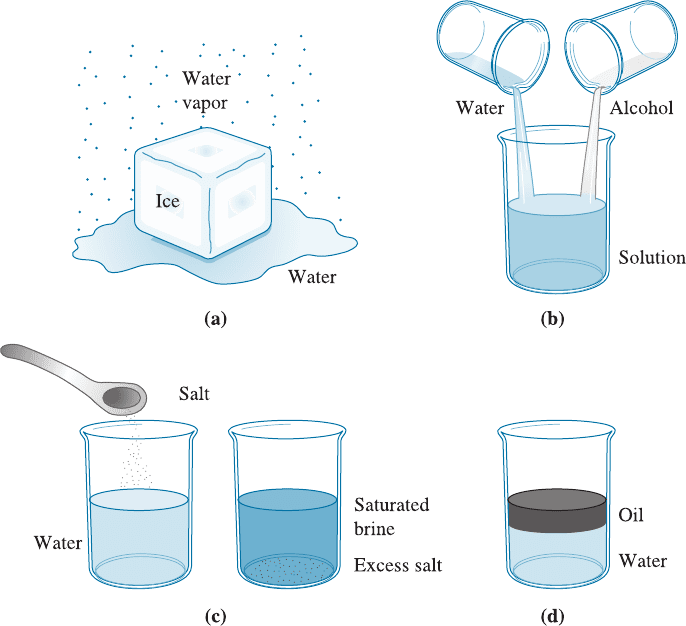
For example, if we enclose a block of ice in a vacuum chamber [(Figure 10-1(a)],
the ice begins to melt and some of the water vaporizes. Under these conditions, we have
three phases coexisting: solid H
2
O, liquid H
2
O, and gaseous H
2
O. Each of these forms
of H
2
O is a distinct phase; each has a unique atom ic arrangement, unique properties,
and a definite boundary between each form. Although, in this case the phases have
identical compositions.
C H APT ER 1 0 Solid Solutions and P hase Equilibrium292
Josiah Willard Gibbs developed the phase rule in 1875–1876. It describes the rela-
tionship between the number of components and the number of phases for a given sys-
tem and the conditions that may be allowed to change (e.g., temperature, pressure,
etc.). It has the general form:
2 þ C ¼ F þ P ðwhen temperature and pressure both can varyÞð10-1Þ
A useful mnemonic (something that will allow you to remember) for the Gibbs phase
rule is to start with a numeric and follow with the rest of the terms alphabetically (i.e.,
C, F, and P) using all positive signs. In the phase rule, C is the number of chemically
independent components, usually elements or compounds, in the system; F is the num-
ber of degrees of freedom, or the number of variables (such as temperature, pressure, or
composition), that are allowed to change independently without changing the number
of phases in equilibrium; and P is the number of phases present (please do not confuse
P with ‘‘pressure.’’) The constant ‘‘2’’ in Equation 10-1 implies that both the temper-
ature and pressure are allowed to change. The term ‘‘chemically independent’’ refers to
the number of di¤erent elements or compounds needed to specify a system. For exam-
ple, wa ter (H
2
O) is considered as a one component system, since the concentrations of
H and O in H
2
O cannot be independently varied.
Figure 10-1 Illustration of phases and solubility: (a) The three forms of water—gas, liquid,
and solid—are each a phase. (b) Water and alcohol have unlimited solubility. (c) Salt and
water have limited solubility. (d) Oil and water have virtually no solubility in each other.
10-1 Phases and the Phase Diagram 293
It is important to note that the Gibbs phase rule assumes thermodynamic equili-
brium and, more often than not in materials processing, we encounter conditions in
which equilibrium is not maintained. Therefore, you should not be surprised to see that
the number and compositions of phases seen in practice are dramatically di¤erent from
those predicted by the Gibbs phase rule.
Note that phases do not always have to be solid, liquid, and gaseous forms of a
material. An element, such as iron (Fe), can exist in FCC and BCC crystal structures.
These two solid forms of iron are two di¤erent phases of iron that will be stable at dif-
ferent temperatures and pressure conditions. Similarly, ice, itself, can exist in several
crystal structures. Carbon can exist in many forms (e.g., graphite or diamond). These
are only two of the many possible phases of carbon.
As an example of the use of the phase rule, let’s consider the case of pure magne-
sium (Mg). Figure 10-2 shows a unary (C ¼ 1) phase diagram in which the lines divide
the liquid, solid, and vapor phases. This unary phase diagram is also called a pressure-
temperature or P-T diagram. In the unary phase diagram, there is only one component;
in this case, magnesium (Mg). Depending on the temperature and pressure, however,
there may be one, two, or even three phases present simultaneo usly: solid magnesium,
liquid magnesium, and magnesium vapor. Note that at atmospheric pressure (one at-
mosphere, given by the dashed line), the intersection of the lines in the phase diagram
give the usual melting and boiling temperatures for magnesium. At very low pressures,
a solid such as magnesium (Mg) can sublime, or go directly to a vapor form without
melting when it is heated.
Suppose we have a combination of pressure and temperature that put us at point A
in the phase diagram (Figure 10-2). At this point, all magnesium is liquid. The number
of phases is one (liquid). The phase rule tells us that there are two degrees of freedom.
From Equation 10-1:
2 þ C ¼ F þ P; therefore; 2 þ 1 ¼ F þ 1 ði:e:; F ¼ 2Þ
What does this mean? Within limits, as seen in Figure 10-2, we can change the pressure,
the temperature, or both, and still be in an all-liquid portion of the diagram. Put an-
other way, we must fix both the temperature and the pressure to know precisely where
we are in the liquid portion of the diagram.
Consider point B, the boundary between the solid and liquid portions of the dia-
gram. The number of components, C, is still one, but at point B, the solid and liquid
coexist, or the number of phases P is two. From the phase rule Equation 10-1,
2 þ C ¼ F þ P; therefore; 2 þ 1 ¼ F þ 2 ði:e:; F ¼
1Þ
or there is only one degree of freedom. For example, if we change the temperature, the
pressure must also be adjusted if we are to stay on the boundary where the liquid and
solid coexist. On the other hand, if we fix the pressure, the phase diagram tells us the
temperature that we must have if solid and liquid are to coexist.
Finally, at point X, solid, liquid, and vapor coexist. While the number of compo-
nents is still one, there are three phases. The number of degrees of freedom is
2 þ C ¼ F þ P; therefore; 2 þ 1 ¼ F þ 3 ði:e:; F ¼ 0Þ
Now we have no degrees of freedom; all three phases coexist only if both the temper-
ature and the pressure are fixed. A point on the phase diagram at which the solid, liq-
uid, and gaseous phases coexist under equilibrium conditions is the triple point . In the
following example, we see how some of these ideas underlying the Gibbs phase rule can
be applied.
C H APT ER 1 0 Solid Solutions and P hase Equilibrium294
EXAMPLE 10-1
Design of an Aerospace Component
Because magnesium (Mg) is a low-density material (r
Mg
¼ 1:738 g/cm
3
), it has
been suggested for use in an aerospace vehicle intended to enter the outer space
environment. Is this a good design?
SOLUTION
In space the pressure is very low. Even at relatively low temperatures, solid
magnesium can begin to change to a vapor, causing metal loss that could
Figure 10-2
(a) Schematic unary phase diagram
for magnesium, showing the melting
and boiling temperatures at one
atmosphere pressure. (b) Pressure-
temperature phase diagram for
germanium (Ge), ct (4): body-
centered tetragonal lattice with four
atoms per unit cell, fcc (8): face
centered diamond cubic with eight
atoms per unit cell (i.e., diamond
cubic structure). (Source: D. Young,
Phase Diagrams of the Elements.
1991, Publisher: University of
California Press, Berkeley, p. 106.)
10-1 Phases and the Phase Diagram 295

damage a space vehicle. In addition, solar radiation could cause the vehicle to
heat, increasing the rate of magnesium loss.
A low-density material with a higher boiling point (and, therefore, lower
vapor pressure at any given temperature) might be a better choice. At atmos-
pheric pressure, aluminum boils at 2494
C and beryllium (Be) boils at 2770
C,
compared with the boiling temperature of 1107
C for magnesium. Although
aluminum and beryllium are somewhat denser than magnesium, either might
be a better design. Given the toxic e¤ects of Be and many of its compounds
when in powder form, we may want to consider aluminum first.
Other factors to consider: In load-bearing applications, we should not only
look for density but also for relative strength. Therefore, the ratio of Young’s
modulus to density or yield strength to density could be a better parameter to
compare di¤erent materials. In this comparison, we will have to be aware that
yield strength, for example, depends strongly on microstructure. Also, the
strength of aluminum can be enhanced using aluminum alloys, while keeping
the density about the same.
These materials and some composites may make a good choice. Other
factors such as oxidation during reentry into Earth’s atmosphere may be ap-
plicable and will also have to be considered.
If you examine the P-T diag ram for water, you will notice how the melting tem-
perature of ice decreases with increasing pressure. This is rather unusual. It has been
suggested that one of the reasons why skaters can skate on ice is that the pressure from
their skates actually melts the ice, thus maintaining a layer of water. This, however, has
been shown not to be an important factor. Instead, a phenomenon known as ‘‘surface
melting’’ of ice has been shown to be the main factor in providing a lubricating film of
water allowing the skater to move easily across the ice.
10-2 Solubility and Solid Solutions
Often, it is beneficial to know how much of each material or component we can com-
bine without producing an additional phase. When we begin to combine di¤erent com-
ponents or materials, as when we add alloying elements to a metal, solid or liquid, so-
lutions can form. For example, when we add sugar to water, we form a sugar solution.
When we di¤use a small number of phosphorus (P) atoms into single crystal silicon (Si),
we produce a solid solution of P in Si. In other words, we are interested in the solubility
of one material into another (e.g., sugar in water, copper in nickel, phosphorus in
silicon, etc.).
Unlimited Solubility Suppose we begin with a glass of water and a glass of alcohol.
The water is one phase, and the alcohol is a second phase. If we pour the water into the
alcohol and stir, only one phase is produced [Figure 10-1(b)]. The glass contains a sol-
ution of water and alcohol that has unique prope rties and composition. Water and
alcohol are soluble into each other. Furthermore, they display unlimited solubility.
Regardless of the ratio of water and alcohol, only one phase is produced when they are
mixed together.
C H APT ER 1 0 Solid Solutions and P hase Equilibrium296
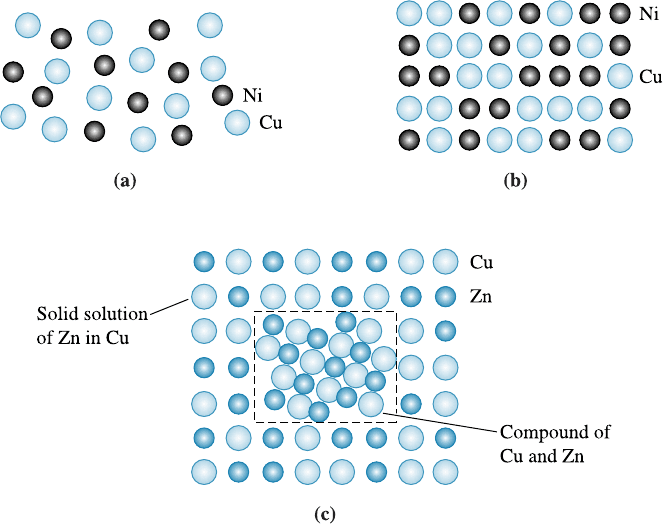
Similarly, if we were to mix any amounts of liquid copper and liquid nickel, only
one liquid phase would be produced. This liquid alloy has the same composition and
properties everywhere [Figure 10-3(a)], because nickel and copper have unlimited liquid
solubility.
If the liquid copper-nickel alloy solidifies and cools to room temperature while
maintaining thermal equilibrium, only one solid phase is produced. After solidification,
the copper and nickel atoms do not separate but, instead, are randomly located within
the FCC crystal structure. Within the solid phase, the structure, properties, and com-
position are uniform and no interface exists between the copper and nickel atoms.
Therefore, copper and nickel also have unlimited solid solubility. The solid phase is a
solid solution of copper and nickel [Figure 10-3(b)].
A solid solution is not a mixture. A mixture contains more than one type of phase
whose characteristics are retained when the mixture is formed. In contrast to this, the
components of a solid solution completely dissolve in one another and do not retain
their individual characteristics.
An example of a ceramic system forming a solid solution is that of barium titanate
(BaTiO
3
) and strontium titanate (SrTiO
3
), which are compounds found in the BaO-
TiO
2
-SrO ternary system.
Limited Solubility When we add a small quantity of salt (one phase) to a glass of
water (a second phase) and stir, the salt dissolves completely in the water. Only one
phase—salty water or brine—is found. However, if we add too much salt to the water,
the excess salt si nks to the bottom of the glass [Figure 10-1(c)]. Now we have two phases
Figure 10-3 (a) Liquid copper and liquid nickel are completely soluble in each other. (b) Solid
copper-nickel alloys display complete solid solubility, with copper and nickel atoms occupying
random lattice sites. (c) In copper-zinc alloys containing more than 30% Zn, a second phase
forms because of the limited solubility of zinc in copper.
10-2 Solubility and Solid Solutions 297
in equilibrium with one another—water that is saturated with salt plus excess solid salt.
We find that salt or sugar have a limited solubility in water.
If we add a small amount of liquid zinc to liquid copper, a single liquid solution is
produced. When that copper-zinc solution cools and solidifies, a single solid solution
having an FCC structure results, with copper and zinc atoms randomly located at the
normal lattice points. However, if the liquid solution contains more than about 30% Zn
freezes, some of the excess zinc atoms combine with some of the copper atoms to form
a CuZn compound [Figure 10-3(c)]. Two solid phases now coexist: a solid solution of
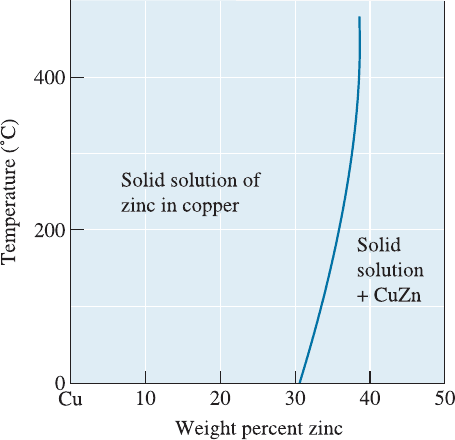
copper saturated with about 30% Zn plus a CuZn compound. The solubility of zinc in
copper is limited. Figure 10-4 shows a portion of the Cu-Zn phase diagram illustrating
the solubility of zi nc in copper at low temperatures. The solubility increases with in-
creasing temperature. This is similar to how we can dissolve more sugar or salt in water
by increasing the temperature.
In the extreme case, there may be almost no solubility of one material in another.
This is true for oil and water [Figure 10-1(d)] or for copper-lead (Cu-Pb) alloys. Note that
even though materials do not dissolve into one another they can be dispersed into one
another. For example, oil-like phases and aqueous liquids can be mixed, often using
surfactants (soap-like molecules), to form emulsions. Immiscibility, or lack of solubili ty,
is seen in many molten, and solid ceramic and metallic materials.
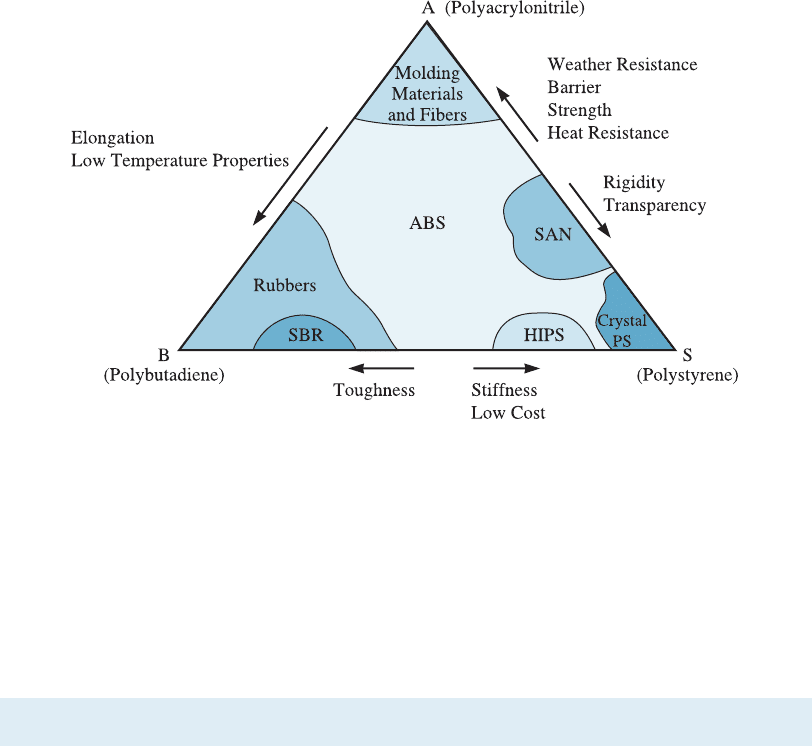
Polymeric Systems We can process polymeric materials to enhance their usefulness
using a concept similar to the formation of solid solutions in metallic and ceramic sys-
tems. We can form materials that are known as copolymers that consist of di¤erent
monomers. For example, acrylonitrile (A), butadiene (B), and styrene (S) monomers
can be made to react to form a copolymer known as ABS. This resul tant copolymer is
similar to a solid solution in that it has the functionalities of the three monomers from
which it is derived, blending their properties. Similar to the Cu-Ni or BaTiO
3
-SrTiO
3
solid solutions, we will not be able to separate out the acrylonitrile, butadiene, or styr-
ene from an ABS plastic. Injection molding is used to convert ABS into telephones,
helmets, steering wheels, small appliance cases, and other products. Figure 10-5 illus-
trates the properties of di¤erent copolymers in the ABS system. Note that this is not a
phase diagram. This means the phases formed may not be thermodynamically stable.
Figure 10-4
The solubility of zinc in copper.
The solid line represents the
solubility limit; when excess zinc
is added, the solubility limit is
exceeded and two phases coexist.
C H APT ER 1 0 Solid Solutions and P hase Equilibrium298
Dylark
TM
is another example of a copolymer. It is formed using maleic anhydride and
a styrene monomer. The Dylark
TM
copolymer, with carbon black for UV protection,
reinforced with fiberglass, and toughened with rubber, is used for instrument panels in
many automobiles (Chapter 16).
10-3 Conditions for Unlimited Solid Solubility
In order for an alloy system (e.g., copper-nickel) to have unlimited solid solubility,
certain conditions must be satisfied. These conditions, the Hume-Rothery rules, are as
follows:
1. Size factor: The atoms or ions must be of similar size, with no more than a 15%
di¤erence in atomic radius, in order to minimize the lattice strain (i.e., to minimize, at
an atomic level, the deviations caused in interatomic spacing).
2. Crystal structure: The materials must have the same crystal structure; otherwise,
there is some point at which a trans ition occurs from one phase to a second phase with
a di¤erent structure.
3. Valence : The ions must have the same valence; otherwise, the valence electron
di¤erence encourages the formation of compounds rather than solutions.
4. Electronegativity: The atoms must have approximately the same electronega-
tivity. Electronegativity is the a‰nity for electrons (Chapter 2). If the electronegativities
di¤er significantly, compounds form—as when sodium and chlorine atoms combine to
form sodium chloride.
Hume-Rothery’s conditions must be met, but they are not necessarily su‰cient, for
two metals (e.g., Cu and Ni) or compounds (e.g., BaTiO
3
-SrTiO
3
) to have unlimited
solid solubility.
Figure 10-5 Diagram showing how the properties of copolymers formed in the ABS system
vary. This is not a phase diagram. (Source: Strong, A. Brent, Plastics: Materials and Processing,
2nd, > 2000. Electronically reproduced by permission of Pearson Education, Inc., Upper
Saddle River, New Jersey.)
10-3 Conditions for Unlimited Solid Solubility 299