Askeland D.R., Fulay P.P. Essentials of Materials Science & Engineering
Подождите немного. Документ загружается.

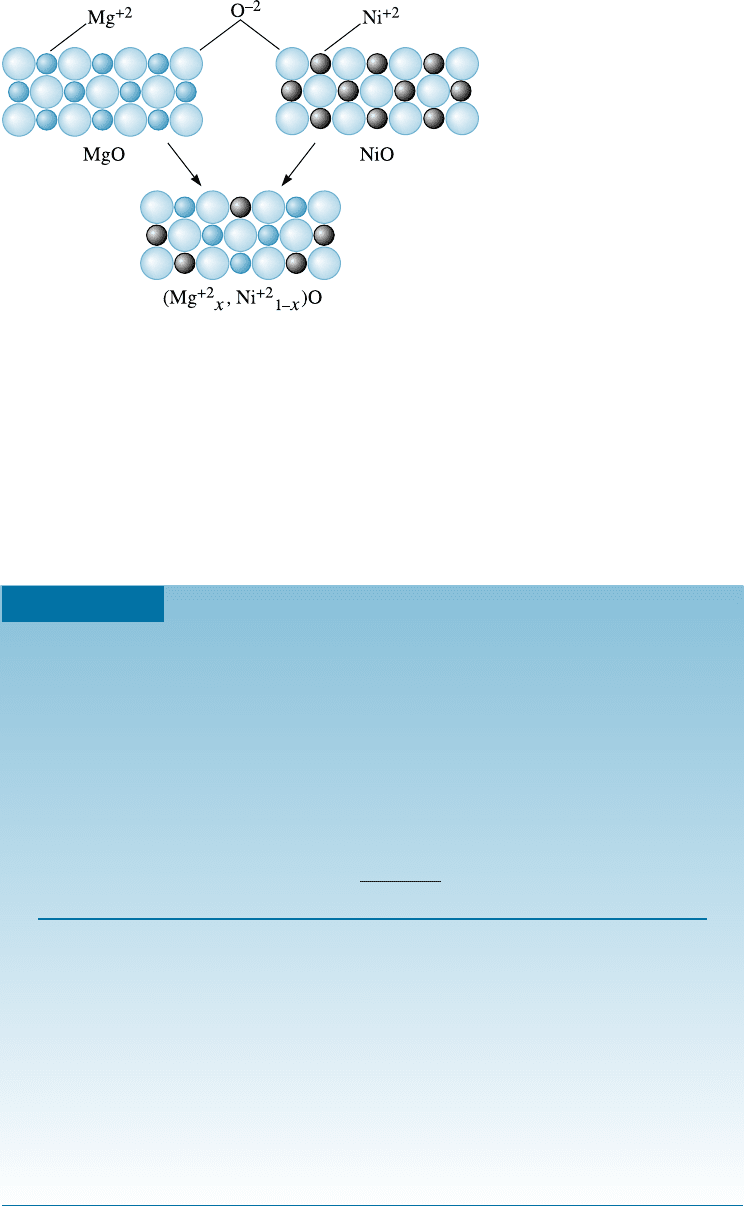
Figure 10-6 shows schematically the two-dimensional structures of MgO and NiO.
The Mg
þ2
and Ni
þ2
ions are similar in size and valence and, consequently, can replace
one another in a sodium chloride (NaCl) crystal structure (Chapter 3), forming a com-
plete series of solid solutions of the form (Mg
þ2
x
Ni
þ2
1x
)O, where x ¼ the mole frac-
tion of Mg
þ2
or MgO.
The solubility of interstitial atoms is always limited. Interstitial atoms are much
smaller than the atoms of the host element, thereby violating the first of Hume-
Rothery’s conditions.
Figure 10-6
MgO and NiO have similar
crystal structures, ionic radii,
and valences; thus the two
ceramic materials can form
solid solutions.
EXAMPLE 10-2 Ceramic Solid Solutions of MgO
NiO can be added to MgO to produce a solid solution. What other ceramic
systems are likely to exhibit 100% solid solubility with MgO?
SOLUTION
In this case, we must consider oxide additives that have metal cations with the
same valence and ionic radius as the magnesium cations. The valence of the
magnesium ion is þ2 and its ionic radius is 0.66 A
. From Appendix B, some
other possibilities in which the cation has a valence of þ2 include the following:
r (A)
""
r
ion
Cr
Mg
B2
r
Mg
B2
##
D100%
Crystal Structure
Cd
þ2
in CdO r
Cd
þ2
¼ 0:97 47 NaCl
Ca
þ2
in CaO r
Ca
þ2
¼ 0:99 50 NaCl
Co
þ2
in CoO r
Co
þ2
¼ 0:72 9 NaCl
Fe
þ2
in FeO r
Fe
þ2
¼ 0:74 12 NaCl
Sr
þ2
in SrO r
Sr
þ2
¼ 1:12 70 NaCl
Zn
þ2
in ZnO r
Zn
þ2
¼ 0:74 12 NaCl
The percent di¤erence in ionic radii and the crystal structures are also
shown and suggest that the FeO-MgO system will probably display unlimited
solid solubility. The CoO and ZnO systems also have appropriate radius ratios
and crystal structures.
C H APT ER 1 0 Solid Solutions and P hase Equilibrium300
10-4 Solid-Solution Strengthening
In metallic materials, one of the important e¤ects of solid-solution formation is the re-
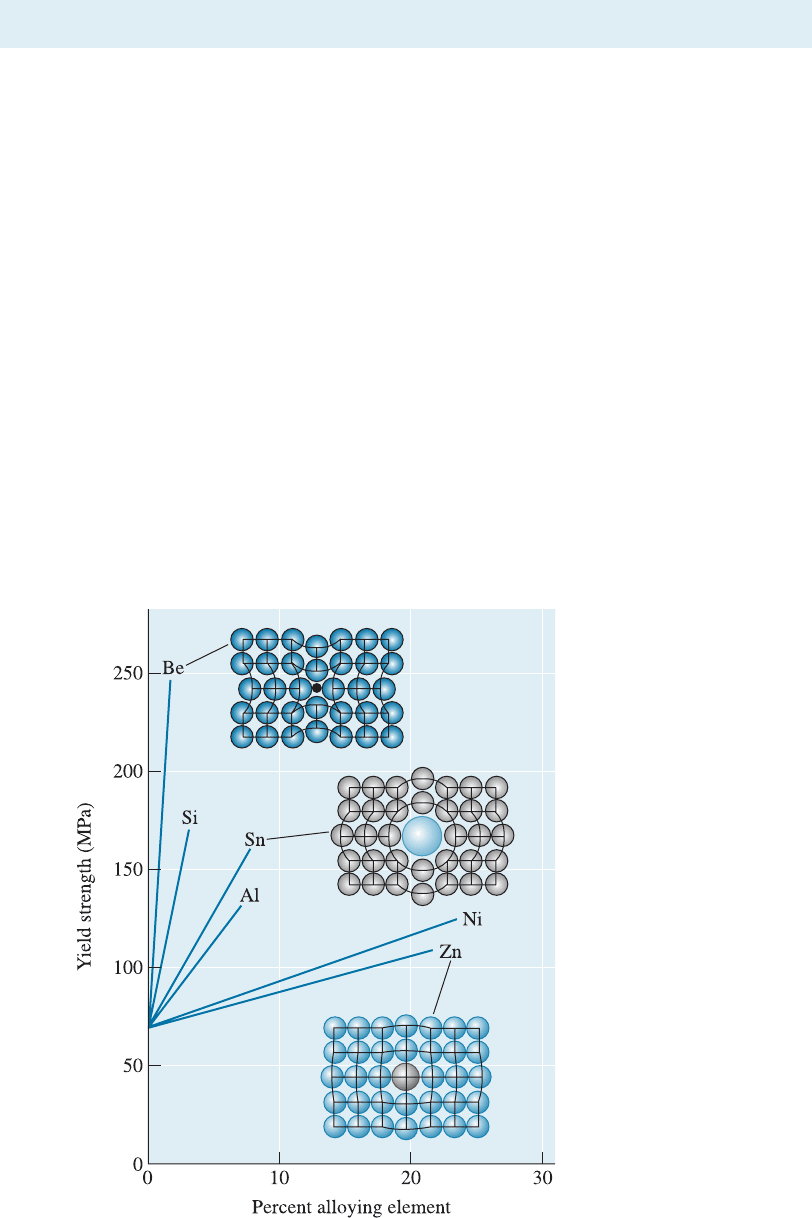
sultant solid-solution strengthening (Figure 10-7). This strengthening, via solid-solution
formation, is caused by increased resistance to dislocation motio n. This is one of the
important reasons why brass (Cu-Zn alloy) is stronger than pure copper. Similarly
small levels of carbon strengthen iron. We will learn later that carbon also plays an-
other role in additional strengthening of steels by forming iron carbide (Fe
3
C) and
other phases (Chapt er 12). Jewelry could be made out of pure gold or silver. However,
pure gold and pure silver are extremely soft and malleable and the jewelry pieces made
will not retain their shape. This is also why jewelers add copper to gold or silver.
In the copper-nickel (Cu-Ni) system, we intentionally introduce a solid substitu-
tional atom (nickel) into the original crystal structure (copper). The copper-nickel alloy
is stronger than pure copper. Similarly, if less than 30% Zn is added to copper, the zinc
behaves as a substitutional atom that strengthens the copper-zinc alloy, as compared
with pure copper.
Recall from Chapter 7 that the strength of ceramics is mainly dictated by the dis-
tribution of flaws; solid-solution formation does not have a strong e¤ect on the me-
chanical properties. This is similar to why strain hardening was not much of a factor
in enhan cing the strength of ceramics or semiconductors such as silicon (Chapter 8). As
discussed before, solid-solution formation in ceramics and semiconductors (such as Si,
GaAs, etc.) has considerable influence on their magnetic, optical, and dielectric prop-
Figure 10-7
The effects of several
alloying elements on the
yield strength of copper.
Nickel and zinc atoms are
about the same size as
copper atoms, but beryllium
and tin atoms are much
different from copper
atoms. Increasing both
atomic size difference and
amount of alloying element
increases solid-solution
strengthening.
10-4 Solid-Solution Strengthening 301

erties. The following discussion related to mechanical properties, therefore, applies
mainly to metallic materials.
Degree of Solid-Solution Strengthening The degree of solid-solution strengthening
depends on two factors. First, a large di¤erence in atomic size between the original
(host or solvent) atom and the added (guest or solute) atom increases the strengthening
e¤ect. A larger size di¤erence produces a greater disruption of the initial crystal struc-
ture, making slip more di‰cult (Figure 10-7).
Second, the greater the amount of alloying element added, the greater the strength-
ening e¤ect (Figure 10-7). A Cu-20% Ni alloy is stronger than a Cu-10% Ni alloy.
Of course, if too much of a large or small atom is added, the solubility limit may be
exceeded and a di¤erent strengthening mechanism, dispersion strengthening, may come
in to play. In dispersion strengthening, the interface between the host phase and guest
phase resists dislocation motion and contributes to strengthening. This mechanism is
discussed further in Chapter 11.
EXAMPLE 10-3
Solid-Solution Strengthening
From the atomic radii, show whether the size di¤erence between copper atoms
and alloying atoms accurately predicts the amount of strengthening found in
Figure 10-7.
SOLUTION
The atomic radii and percent size di¤erence are shown below:
Metal
Atomic Radius
(A)
rCr
Cu
r
Cu
D100%
Cu 1.278 0
Zn 1.332 þ4.2
Al 1.432 þ12.1
Sn 1.509 þ18.1
Ni 1.243 2.7
Si 1.176 8.0
Be 1.143 10.6
For atoms larger than copper—namely, zinc, aluminum, and tin—
increasing the size di¤erence increases the strengthening e¤ect. Likewise for
smaller atoms, increasing the size di¤erence increases strengthening.
Effect of Solid-Solution Strengthening on Properties The e¤ects of solid-solution
strengthening on the properties of a metallic material include the following (Figure 10-8):
1. The yield strength, tensile strength, and hardness of alloys are greater than those
of the pure metals. This is one reason why we most often use alloys rather than pure
metals. For example, small concentrations of Mg are added to aluminum to provide
higher strength to the aluminum alloys used in making aluminum beverage cans.
C H APT ER 1 0 Solid Solutions and P hase Equilibrium302
2. Almost always, the ductility of the alloy is less than that of the pure metal. Only
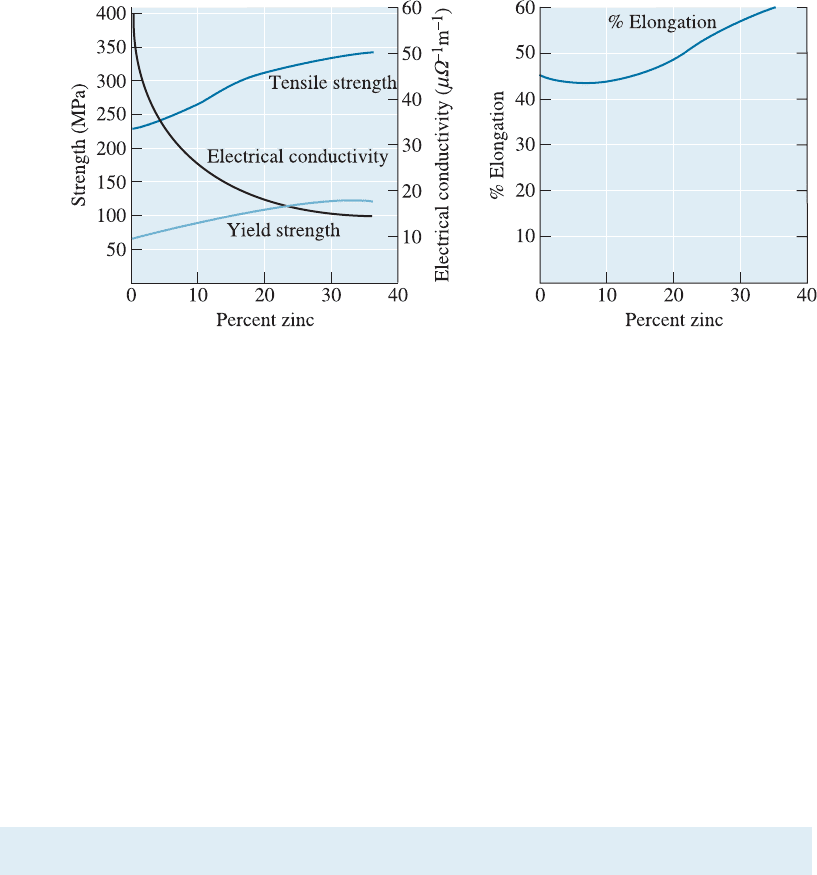
rarely, as in copper-zinc alloys (Figure 10-8), does solid-solution strengthening increase
both strength and ductility.
3. Electrical conductivity of the alloy is much lower than that of the pure metal.
This is because electrons get more scattered o¤ the atoms of the alloying elements.
Solid-solution strengthening of copper or aluminum wires used for transmission of
electrical power is not recommended because of this pronounced e¤ect. Electrical con-
ductivity of many alloys, although lower than that of pure metals, is often more stable
as a function of temperature.
4. The resistance to creep, or loss of strength at elevated temperatures, is improved
by solid-solution strengthening. High temperatures do not cause a catastrophic change
in the properties of solid-solution-strengthened alloys. Many high-temperature alloys,
such as those used for jet engines, rely partly on extensive solid-solution strengthening.
10-5 Isomorphous Phase Diagrams
A phase diagram shows the phases and their compositions at any combination of
temperature and alloy composition. When only two elements or two compounds are
present in a material, a binary phase diagram can be constructed. Isomorphous binary
phase diagrams are found in a number of metallic and ceramic systems. In the isomor-
phous systems, which include the copper-nickel and NiO-MgO systems [Figure 10-9(a)
and (b)], only one solid phase forms; the two components in the system display com-
plete solid solubility. As shown in the phase diagrams for CaO SiO
2
-SrO SiO
2
, and
thallium-lead (Tl-Pb) systems, it is possible to have phase diagrams show a minimum or
maximum point, respectively [Figure 10-9(c) and (d)]. Notice the x-axis scale can rep-
resent either mole% or weight% of one of the components. We can also plot atomic% or
mole fraction of one of the components. Also, notice that the CaO-SiO
2
and SrO-SiO
2
diagram could be plotted as a ternary phase diagram. A ternary phase diagram is a phase
Figure 10-8 The effect of additions of zinc to copper on the properties of the solid-solution-
strengthened alloy. The increase in % elongation with increasing zinc content is not typical of
solid-solution strengthening.
10-5 Isomorphous Phase Diagrams 303
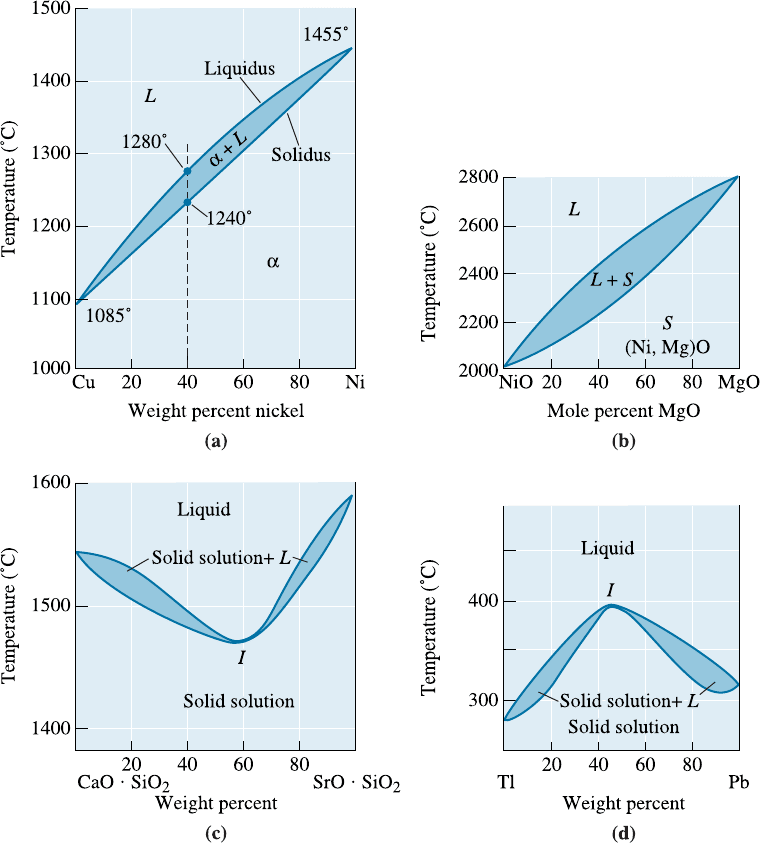
diagram for systems consisting of three components. Here, we represent it as a pseudo-
binary diagram (i.e., we assume that this is a diagram that represents phase equilibria
between CaO SiO
2
and SrO SiO
2
). In a pseudo-binary diagram, we represent equi-
libria between three or mor e components using two compounds. Ternary phase diagrams
are often encountered in ceramic and metallic systems.
Recently, considerable developments also have occurred in the development of
phase diagrams using computer databases containing thermodynamic properties of dif-
ferent elements and compounds.
Figure 10-9 (a) The equilibrium phase diagrams for the Cu-Ni and NiO-MgO systems. (b) The
liquidus and solidus temperatures are shown for a Cu-40% Ni alloy. (c) and (d) Systems with
solid solution maxima and minima. (Source: Adapted from Introduction to Phase Equilibria,by
C.G. Bergeron, and S.H. Risbud. Copyright > 1984 American Ceramic Society. Adapted by
permission.)
C H APT ER 1 0 Solid Solutions and P hase Equilibrium304

Liquidus and Solidus Temperatu res We define liquidus temperature as the tempera-
ture above which a material is completely liquid. The upper curve in Figure 10-9(a)
represents the liquidus temperatures for copper-nickel alloys of di¤erent compositions.
We must heat a copper-nickel alloy above the liquidus tempe rature to produce a com-
pletely liquid alloy that can then be cast into a useful shape. The liquid alloy begins to
solidify when the temperature decreases to the liquidus temperature. For the Cu-40%
Ni alloy in Figure 10-9(a), the liquidus temperature is 1280
C.
The solidus temperature for the copper-nickel alloys is the temperature below which
the alloy is 100% solid. The lower curve in Figure 10-9(a) represents the solidus tem-
peratures for Cu-Ni alloys of di¤erent compositions. A copper-nickel alloy is not
completely solid until the material cools below the solidus temperature. If we use
a copper-nickel alloy at high temperatures, we must be sure that the service tempera-
ture is below the solidus so that no melting occurs. For the Cu-40% Ni alloy in Figure
10-9(a), the solidus temperature is 1240
C.
Copper-nickel alloys melt and freeze over a range of temperatur es between the liq-
uidus and the solidus. The temperature di¤erence between the liquidus and the solidus
is t he freezing range of the alloy. Within the freezing range, two phases coexist: a liquid
and a solid. The solid is a solution of copper and nickel atoms and is desig nated as the a
phase. For the Cu-40% Ni alloy in Figure 10-9(a), the freezing range is 1280 1240 ¼
40
C. Note that pure metals solidify at a fixed temperature (i.e., the freezing range is
zero degrees).
Phases Present Often we are interested in which phases are present in an alloy at a
particular temperature. If we plan to make a casting, we must be sure that the metal is
initially all liquid; if we plan to heat treat an alloy component, we must be sure that
no liquid forms during the process. Di¤erent solid phases have di¤erent properties. For
example, BCC Fe (indicated as a phase on the iron carbon phase diagram) is magnetic.
However, FCC iron (indicated as g phase on the Fe-C diagram) is not.
The phase diagram can be treated as a road map; if we know the coordinates—
temperature and alloy com position—we can determine the phases present, assuming we
know that thermodynamic equilibrium exists. There are many examples of technologi-
cally important situations where we do not want equilibrium phases to form.
The following two examples illustrate the applications of some of these concepts.
EXAMPLE 10-4
NiO-MgO Isomorphous System
From the phase diagram for the NiO-MgO binary system [Figure 10-9(b)], de-
scribe a composition that can melt at 2600
C but will not melt when placed
into service at 2300
C.
SOLUTION
The material must have a liquidus temperature below 2600
C, but a solidus
temperature above 2300
C. The NiO-MgO phase diagram [Figure 10-9(b)]
permits us to design an appropriate composition.
To identify a composition with a liquidus temperature below 2600
C, there
must be less than 65 mol% MgO in the refractory. To identify a composition
with a solidus temperature above 2300
C, there must be at least 50 mol% MgO
present. Consequently, we can use any composition between 50 mol% MgO
and 65 mol% MgO.
10-5 Isomorphous Phase Diagrams 305
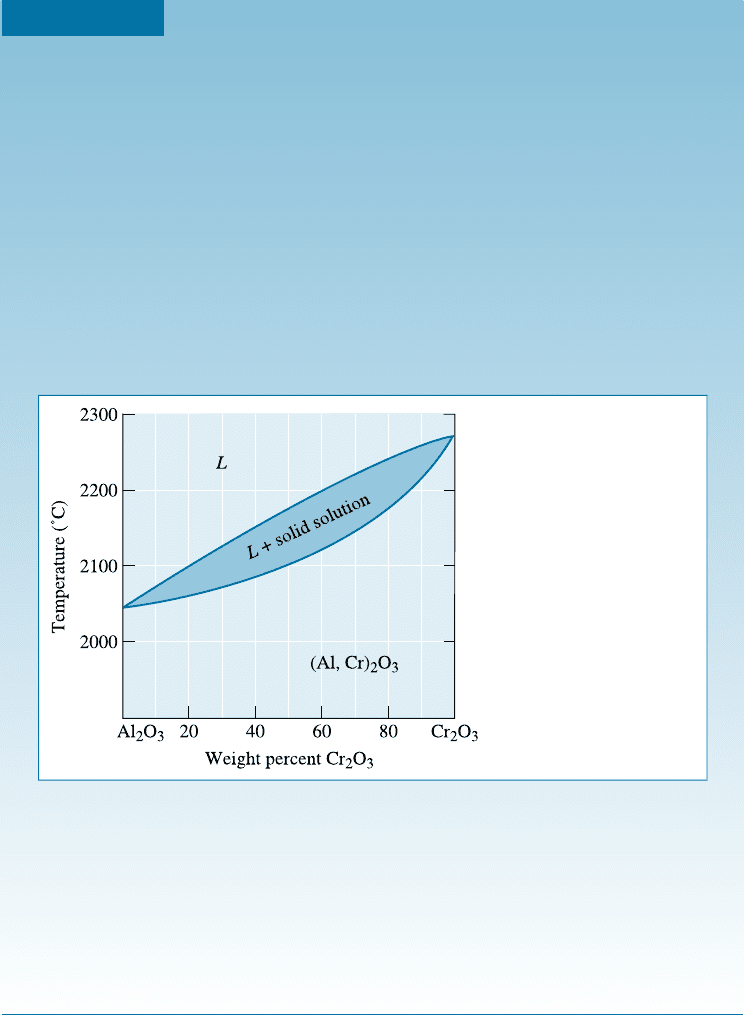
EXAMPLE 10-5 Design of a Composite Material
One method to improve the fracture toughness of a ceramic material (Chap-
ter 7) is to reinforce the ceramic matrix with ceramic fibers. A materials de-
signer has suggested that Al
2
O
3
could be reinforced with 25% Cr
2
O
3
fibers,
which would interfere with the propagation of any cracks in the alumina. The
resulting composite is expected to operate under load at 2000
C for several
months. Criticize the appropriateness of this design.
SOLUTION
Since the composite will operate at high temperatures for a substantial period
of time, the two phases—the Cr
2
O
3
fibers and the Al
2
O
3
matrix—must not
react with one another. In addition, the composite must remain solid to at least
2000
C. The phase diagram in Figure 10-10 permits us to consider this choice
for a composite.
Pure Cr
2
O
3
, pure Al
2
O
3
, and Al
2
O
3
-25% Cr
2
O
3
have solidus temperatures
above 2000
C; consequently, there is no danger of melting any of the con-
stituents. However, Cr
2
O
3
and Al
2
O
3
display unlimited solid solubility. At
the high service temperature, 2000
C, Al
3þ
ions will di¤use from the matrix
into the fiber, replacing Cr
3þ
ions in the fibers. Simultaneously, Cr
3þ
ions will
replace Al
3þ
ions in the matrix. Long before several months have elapsed,
these di¤usion processes cause the fibers to completely dissolve into the matrix.
With no fibers remaining, the fracture toughness will again be poor.
Figure 10-10
The Al
2
O
3
-Cr
2
O
3
phase diagram
(for Example 10-5).
Composition of Each Phase For each phase we can speci fy a composition, expressed
as the percentage of each element in the phase. Usually the composition is expressed in
weight percent (wt%). When only one phase is present in the alloy or a ceramic solid
solution, the composition of the phase equals the overall composition of the material. If
the original composition of a single phase alloy or ceramic material changes, then the
composition of the phase must also change.
C H APT ER 1 0 Solid Solutions and P hase Equilibrium306

However, when two phases, such as liquid and solid, coexist, their compositions
di¤er from one another and also di¤er from the original overall composition. In this
case, if the original composition changes slightly, the composition of the two phases is
una¤ected, provided that the temperature remains constant.
This di¤erence is explained by the Gibbs phase rule. In this case, unlike the example
of pure magnesium (Mg) described earlier, we keep the pressure fixed (e.g., one atmo-
sphere), which is normal for binary phase diagrams. The phase rule given by Equation
10-1 can be rewritten as:
1 þ C ¼ F þ P ðfor constant pressureÞð10-2Þ
where, again, C is the number of independent chemical components, P is the number of
phases (not pressure), and F is the number of degrees of freedom. We now use number
1 instead of number 2 because we are holding the pressure constant. This reduces the
number of degrees of freedom by 1. The pressure is typically, although not necessarily,
one atmosphere. In a binary system, the number of components C is two; the degrees of
freedom that we have include changing the temperature and changing the composition
of the phases present. We can apply this form of the phase rule to the Cu-Ni system, as
shown in Example 10-6.
EXAMPLE 10-6
Gibbs Rule for Isomorphous Phase Diagram
Determine the degrees of freedom in a Cu-40% Ni alloy at (a) 1300
C,
(b) 1250
C, and (c) 1200
C. Use Figure 10-9(a).
SOLUTION
This is a binary system (C ¼ 2) with components Cu and Ni. We will assume
constant pressure. Therefore, Equation 10-2 (1 þ C ¼ F þ P) can be used as
follows:
(a) At 1300
C, P ¼ 1, since only one phase (liquid) is present; C ¼ 2, since
both copper and nickel atoms are present. Thus:
1 þ C ¼ F þ P 9 1 þ 2 ¼ F þ 1orF ¼ 2
We must fix both the temperature and the composition of the liquid phase to
completely describe the state of the copper-nickel alloy in the liquid region.
(b) At 1250
C, P ¼ 2, since both liquid and solid are present; C ¼ 2, since
copper and nickel atoms are present. Now:
1 þ C ¼ F þ P 9 1 þ 2 ¼ F þ 2orF ¼ 1
If we fix the temperature in the two-phase region, the compositions of the two
phases are also fixed. Or, if the composition of one phase is fixed, the temper-
ature and composition of the second phase are automatically fixed.
(c) At 1200
C, P ¼ 1, since only one phase, solid, is present; C ¼ 2, since
both copper and nickel atoms are present. Again,
1 þ C ¼ F þ P 9 1 þ 2 ¼ F þ 1orF ¼ 2
and we must fix both temperature and composition to completely describe the
state of the solid.
10-5 Isomorphous Phase Diagrams 307
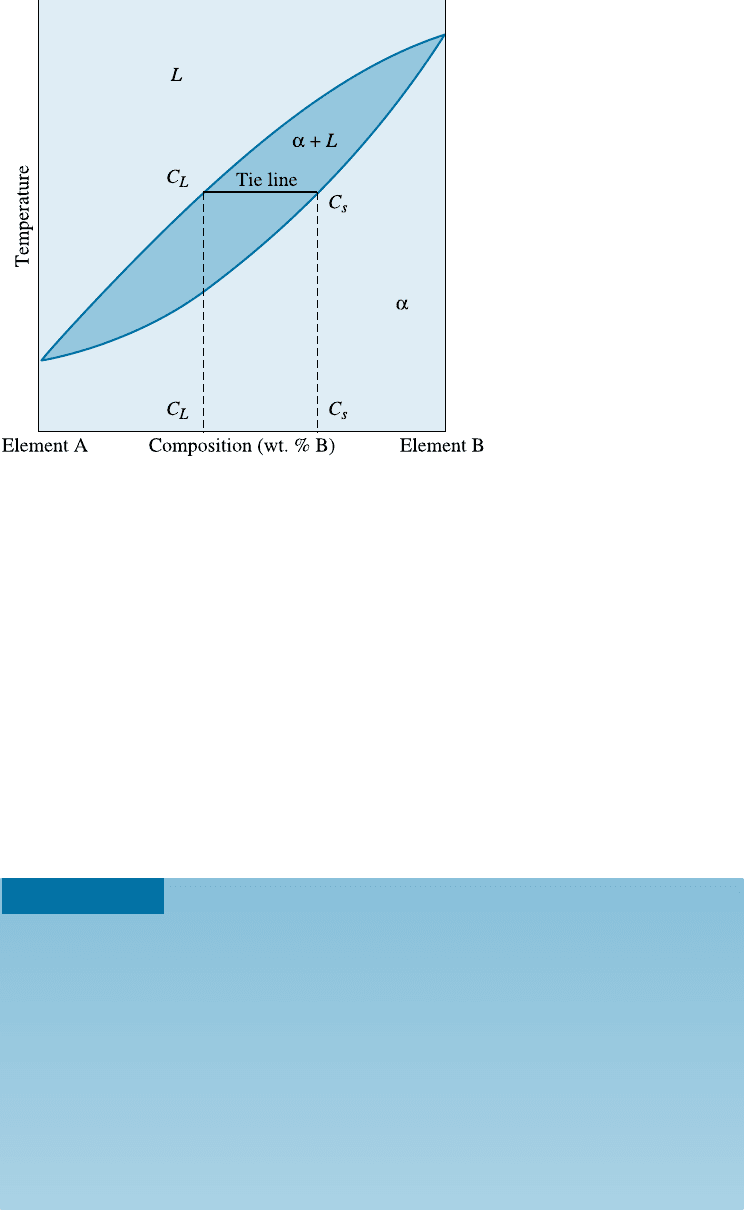
Because there is only one degree of freedom in a two-phase region of a binary
phase diagram, the compositions of the two phases are always fixed when we specify the
temperature. This is true even if the overall composition of the alloy changes. There-
fore, we can use a tie line to determine the composition of the two phases. A tie line is a
horizontal line within a two-phase region drawn at the temperature of interest (see
Figure 10-11). In an isomorphous system, the tie line connects the liquidus and solidus
points at the specified temperature. The ends of the tie line represent the compositions
of the two phases in equilibrium. Tie lines are not used in single-phase regions because
we do not have two phases to ‘‘tie’’ in.
For any alloy with overall or bulk composition lying between c
L
and c
S
, the com-
position of the liquid is c
L
and the composition of the solid a is c
S
.
The following example illustrates how the concept of the tie line is used to determine
the composition of di¤erent phases in equilibrium.
Figure 10-11
A hypothetical binary phase
diagram between two
elements A and B. When an
alloy is present in a two-
phase region, a tie line at the
temperature of interest fixes
the composition of the two
phases. This is a conse-
quence of the Gibbs phase
rule, which provides only one
degree of freedom.
EXAMPLE 10-7 Compositions of Phases in Cu-Ni Phase Diagram
Determine the composition of each phase in a Cu-40% Ni al loy at 1300
C,
1270
C, 1250
C, and 1200
C. (See Figure 10-12.)
SOLUTION
The vertical line at 40% Ni represents the overall composition of the alloy:
9
1300
C: Only liquid is present. The liquid must contain 40% Ni, the overall
composition of the alloy.
9
1270
C: Two phases are presen t. A horizontal line within the a þ L field
is drawn. The endpoint at the liquidus, which is in contact with the liquid
region, is at 37% Ni. The endpoint at the solidus, which is in contact with the
C H APT ER 1 0 Solid Solutions and P hase Equilibrium308
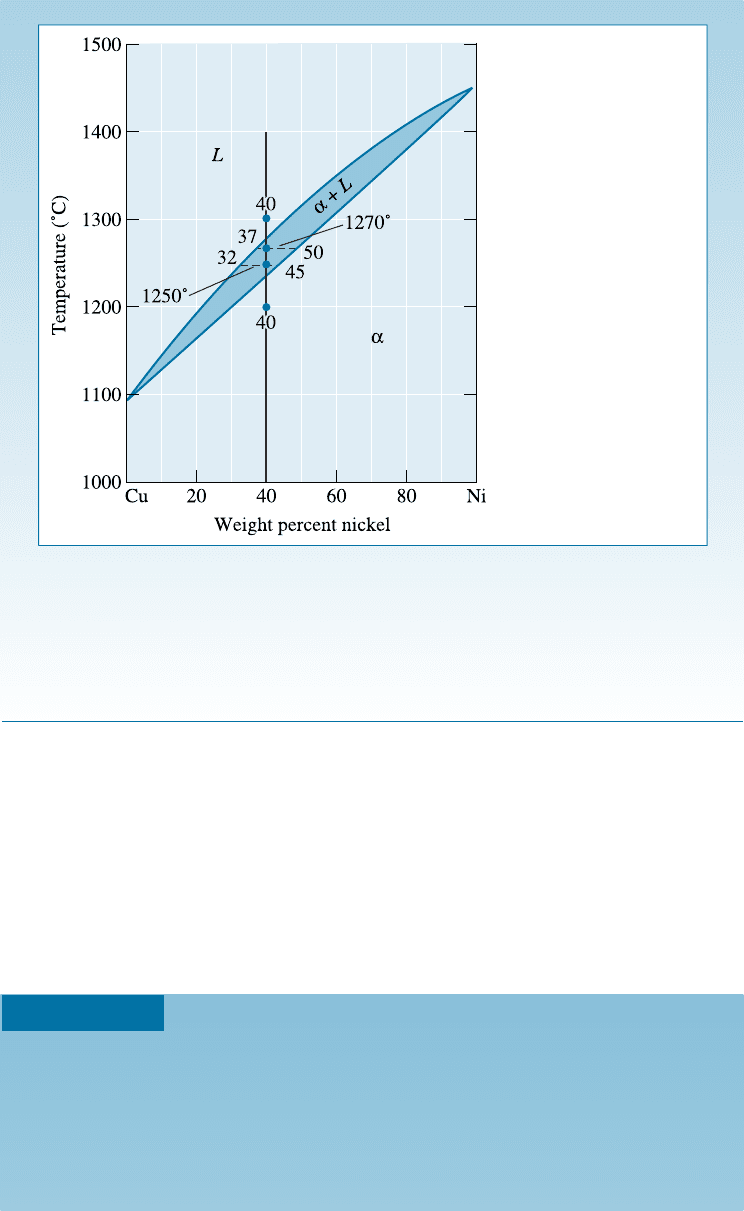
a region, is at 50% Ni. Therefore, the liquid contains 37% Ni and the solid
contains 50% Ni.
9
1250
C: Again two phases are present. The tie line drawn at this temperature
shows that the liquid contains 32% Ni and the solid contains 45% Ni.
9
1200
C: Only solid a is present, so the solid must contain 40% Ni.
Figure 10-12
Tie lines and phase
compositions for a
Cu-40% Ni alloy at
several temperatures
(for Example 10-7).
In Example 10-7, we find that the solid a contains more nickel than the overall al-
loy and the liquid L contains more copper than the original alloy. Generally, the higher
melting point element (in this case, nickel) is concentrated in the first solid that forms.
Amount of Each Phase (the Lever Rule) Lastly, we are interested in the relative
amounts of each phase present in the alloy. These amounts are normally expressed as
weight percent (wt%). We express absolute amounts of di¤erent phases in units of mass
or weight (grams, kilograms, pounds, etc.). The following example illustrates the ra-
tionale for the lever rule.
EXAMPLE 10-8
Application of Lever Rule
Calculate the amounts of a and L at 1250
C in the Cu-40% Ni alloy shown in
Figure 10-13.
SOLUTION
Let’s say that x ¼ mass fraction of the alloy that is solid a. Since we have only
two phases, the balance of nickel must be in the liquid phase (L). Thus, the
10-5 Isomorphous Phase Diagrams 309