Yung Y.L., DeMore W.B. Photochemistry of Planetary Atmospheres
Подождите немного. Документ загружается.

376
Photochemistry
of
Planetary
Atmospheres
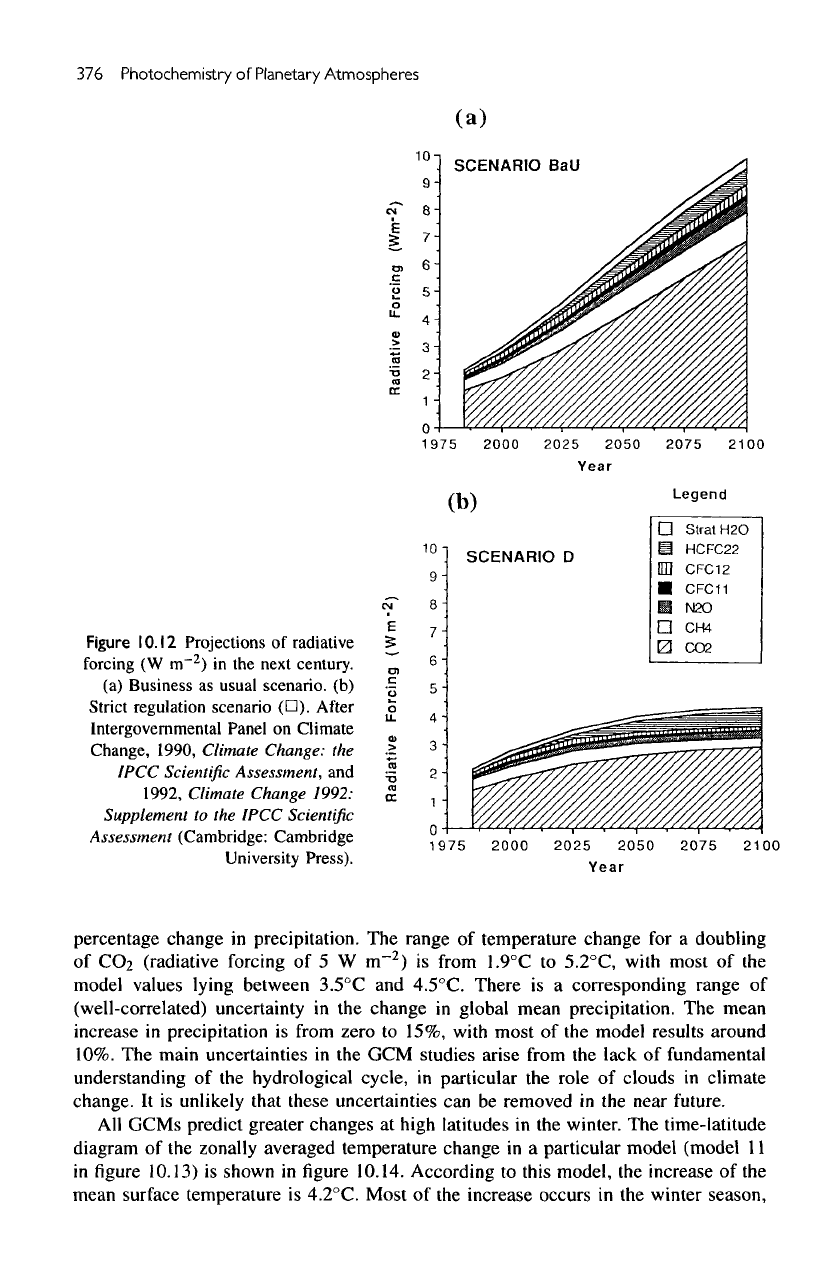
Figure
10.12
Projections
of
radiative
forcing
(W
nrT
2
)
in the
next
century.
(a)
Business
as
usual
scenario,
(b)
Strict
regulation scenario
(D).
After
Intergovernmental
Panel
on
Climate
Change, 1990, Climate Change:
the
IPCC
Scientific
Assessment,
and
1992, Climate Change 1992:
Supplement
to the
IPCC
Scientific
Assessment
(Cambridge: Cambridge
University
Press).
(a)
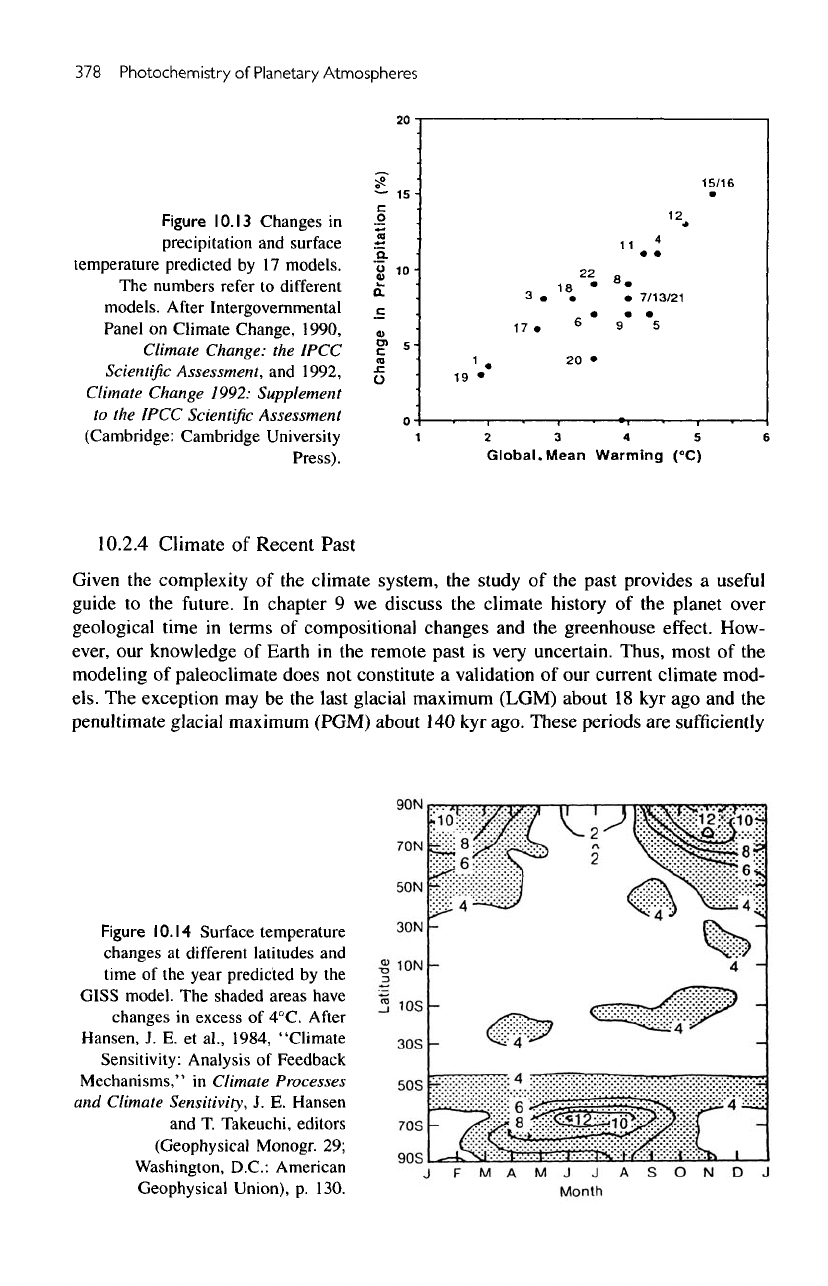
percentage change
in
precipitation.
The
range
of
temperature change
for a
doubling
of
CO
2
(radiative forcing
of 5 W
m"
2
)
is
from 1.9°C
to
5.2°C,
with
most
of the
model values
lying
between
3.5°C
and
4.5°C.
There
is a
corresponding range
of
(well-correlated) uncertainty
in the
change
in
global mean precipitation.
The
mean
increase
in
precipitation
is
from
zero
to
15%,
with
most
of the
model results around
10%.
The
main uncertainties
in the GCM
studies arise
from
the
lack
of
fundamental
understanding
of the
hydrological
cycle,
in
particular
the
role
of
clouds
in
climate
change.
It is
unlikely
that these uncertainties
can be
removed
in the
near
future.
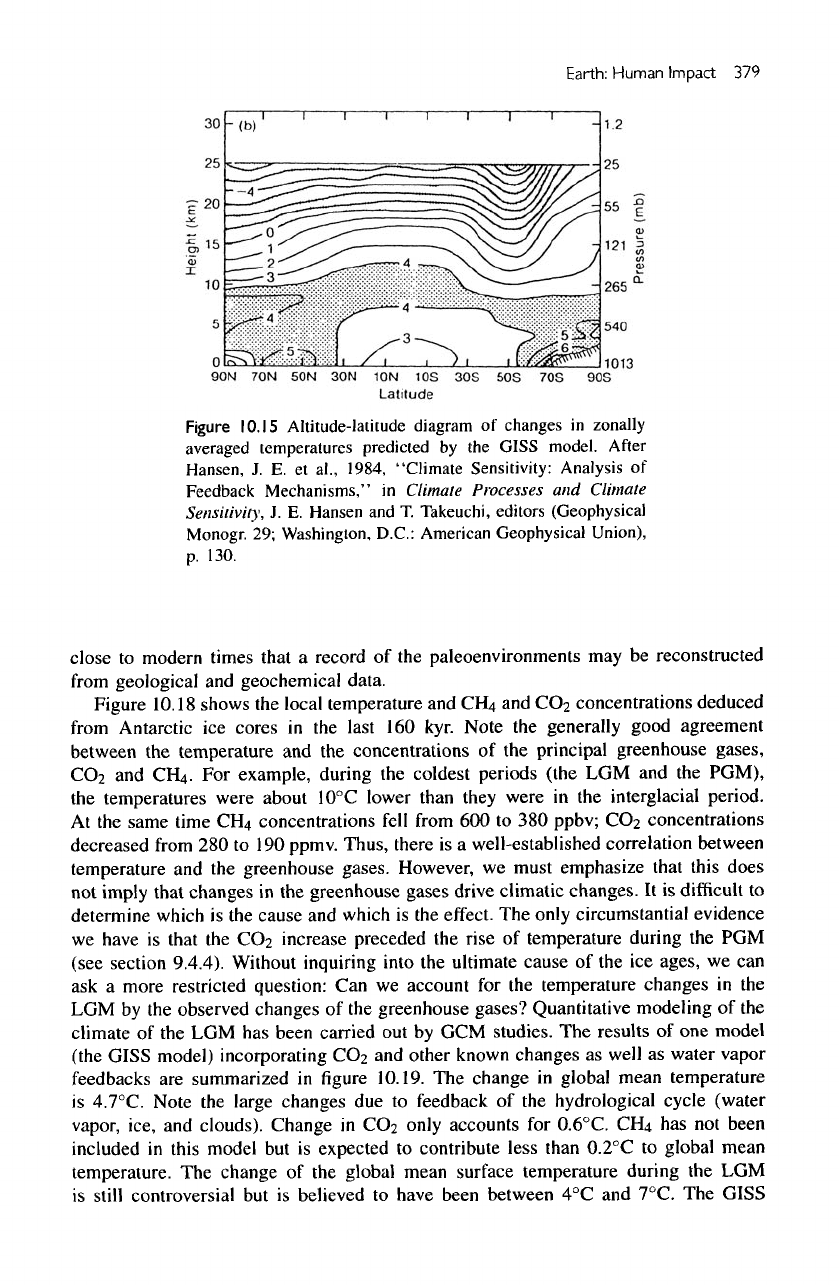
All
GCMs predict greater changes
at
high
latitudes
in the
winter.
The
time-latitude
diagram
of the
zonally averaged temperature change
in a
particular
model
(model
11
in
figure
10.13)
is
shown
in
figure
10.14. According
to
this
model,
the
increase
of the
mean surface temperature
is
4.2°C.
Most
of the
increase occurs
in the
winter season,
Earth: Human Impact
377
(C)
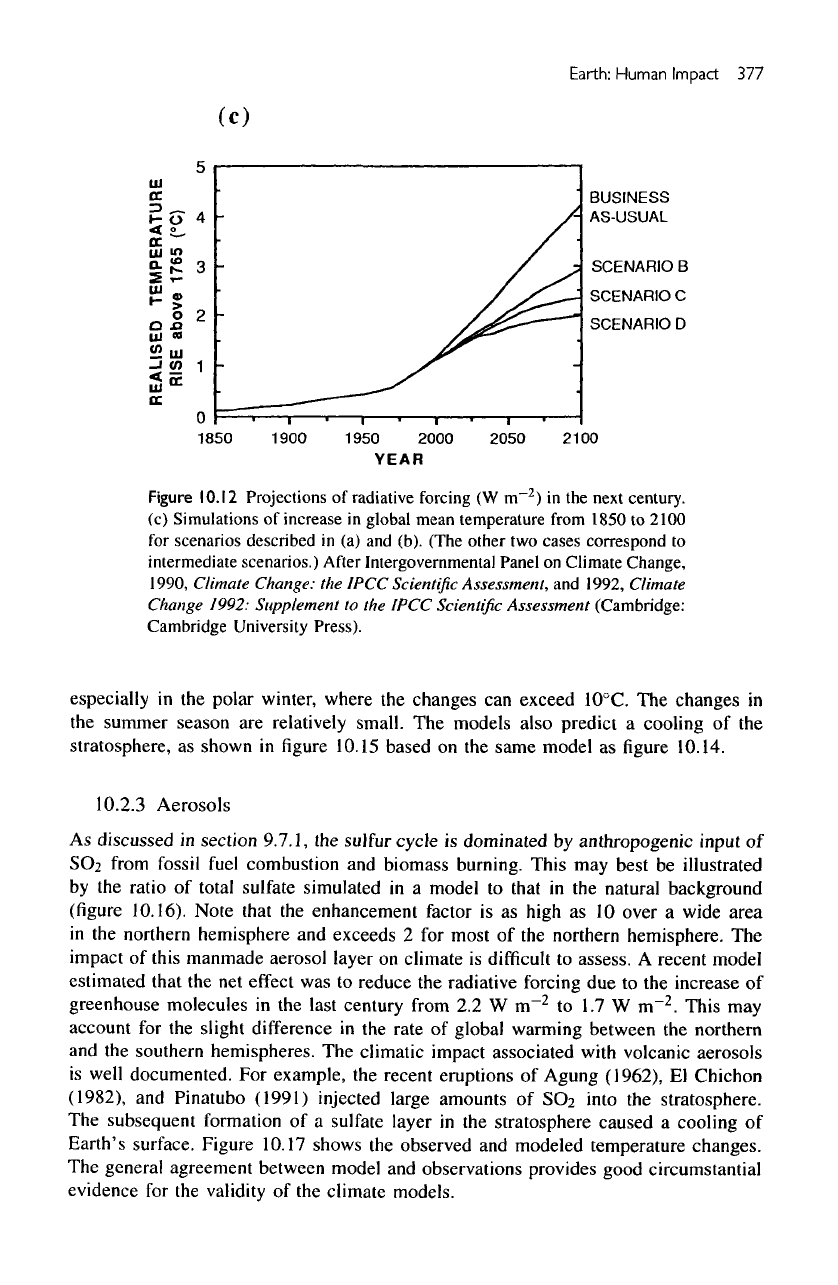
Figure
IO.I2
Projections
of
radiative forcing
(W
m
2
)
in the
next
century,
(c)
Simulations
of
increase
in
global
mean temperature from
1850
to
2100
for
scenarios
described
in (a) and
(b). (The
other
two
cases
correspond
to
intermediate
scenarios.) After Intergovernmental Panel
on
Climate
Change,
1990,
Climate
Change:
the
IPCC
Scientific
Assessment,
and
1992,
Climate
Change
1992:
Supplement
to the
IPCC Scientific
Assessment
(Cambridge:
Cambridge University
Press).
especially
in the
polar winter, where
the
changes
can
exceed
10°C.
The
changes
in
the
summer season
are
relatively small.
The
models
also
predict
a
cooling
of the
stratosphere,
as
shown
in
figure
10.15 based
on the
same
model
as
figure 10.14.
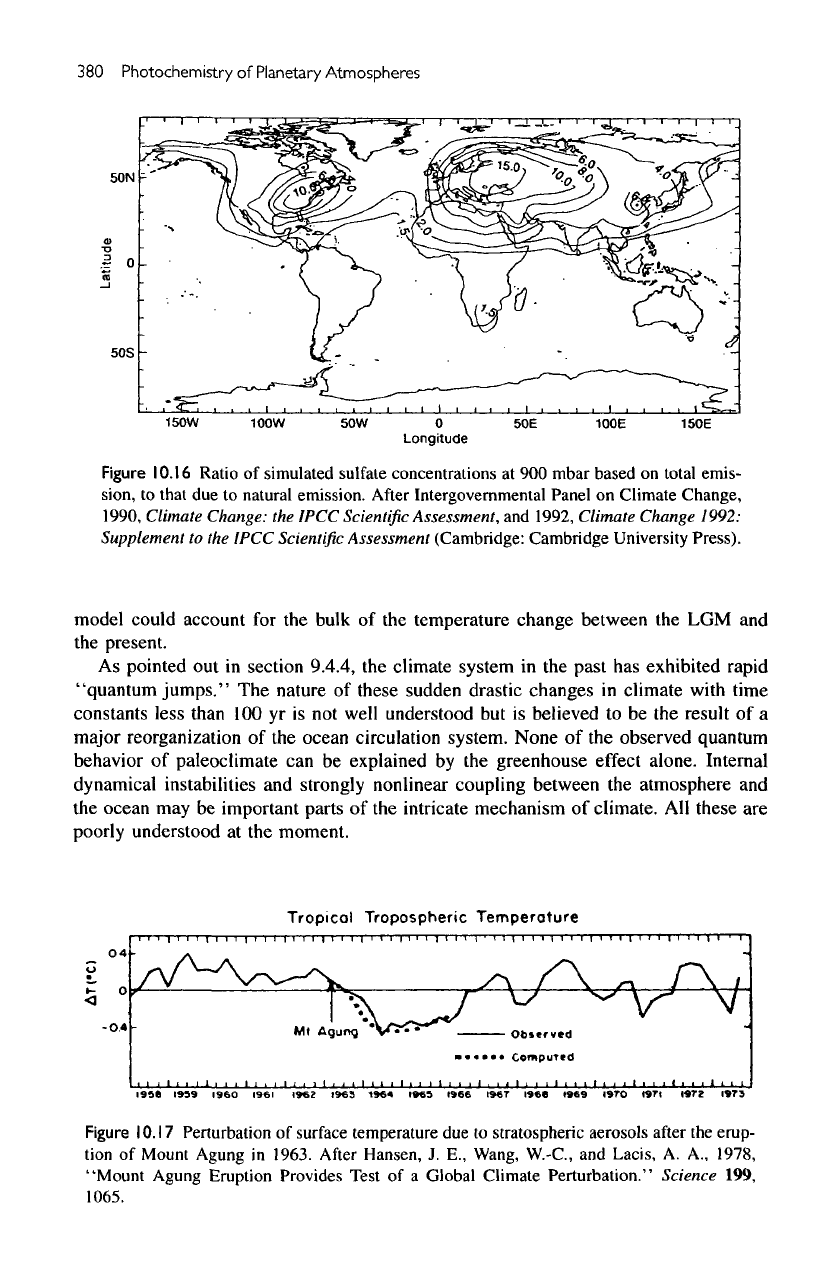
10.2.3
Aerosols
As
discussed
in
section
9.7.1,
the
sulfur
cycle
is
dominated
by
anthropogenic
input
of
SO2
from fossil
fuel
combustion
and
biomass burning. This
may
best
be
illustrated
by
the
ratio
of
total sulfate simulated
in a
model
to
that
in the
natural background
(figure
10.16).
Note
that
the
enhancement factor
is as
high
as 10
over
a
wide
area
in
the
northern hemisphere
and
exceeds
2 for
most
of the
northern hemisphere.
The
impact
of
this
manmade aerosol layer
on
climate
is
difficult
to
assess.
A
recent model
estimated
that
the net
effect
was to
reduce
the
radiative forcing
due to the
increase
of
greenhouse molecules
in the
last century from
2.2 W
m~
2
to 1.7 W
m~
2
.
This
may
account
for the
slight
difference
in the
rate
of
global warming between
the
northern
and
the
southern hemispheres.
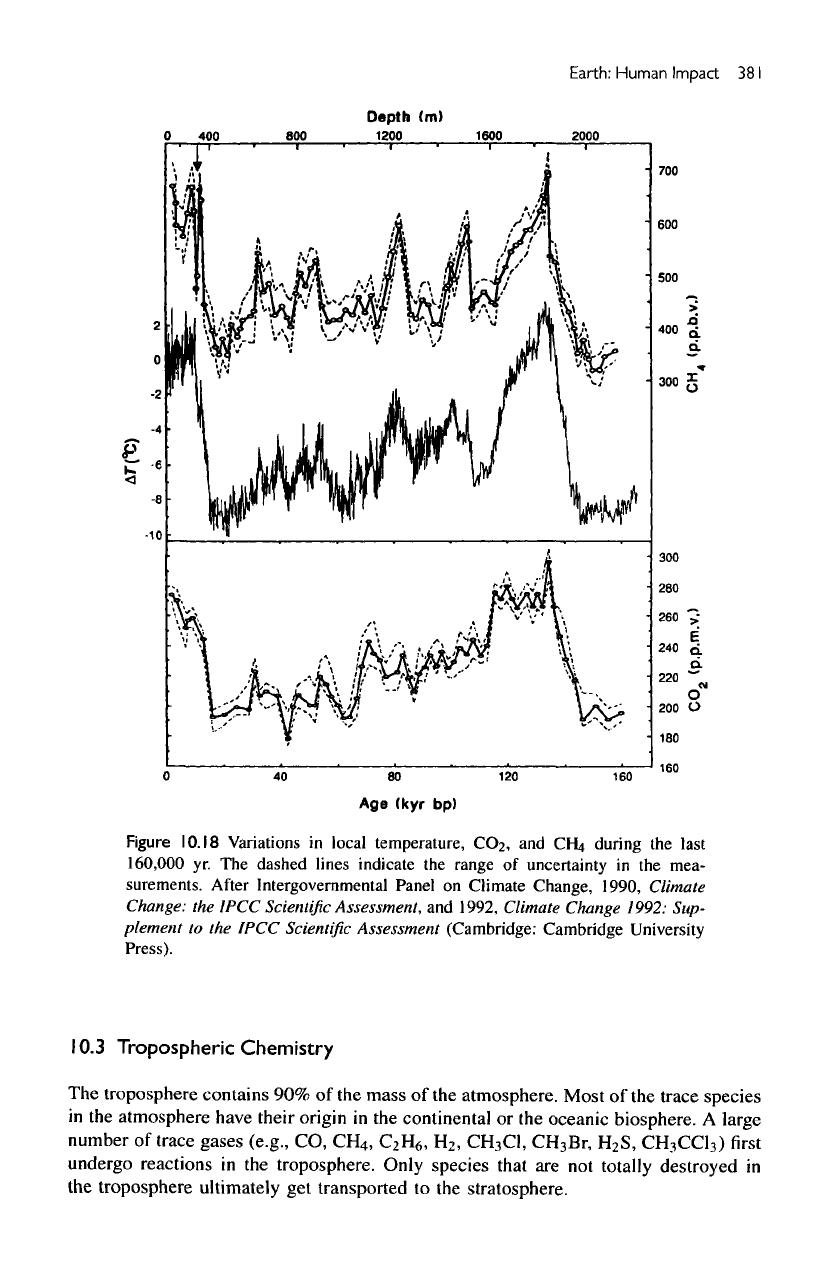
The
climatic impact
associated
with volcanic
aerosols
is
well documented.
For
example,
the
recent
eruptions
of
Agung
(1962),
El
Chichon
(1982),
and
Pinatubo (1991) injected large amounts
of
SO
2
into
the
stratosphere.
The
subsequent formation
of a
sulfate
layer
in the
stratosphere caused
a
cooling
of
Earth's surface. Figure 10.17 shows
the
observed
and
modeled temperature changes.
The
general agreement between model
and
observations provides
good
circumstantial
evidence
for the
validity
of the
climate models.
378
Photochemistry
of
Planetary
Atmospheres
Figure
10.13
Changes
in
precipitation
and
surface
temperature
predicted
by 17
models.
The
numbers
refer
to
different
models.
After
Intergovernmental
Panel
on
Climate
Change,
1990,
Climate
Change:
the
IPCC
Scientific
Assessment,
and
1992,
Climate
Change
1992:
Supplement
to the
IPCC
Scientific
Assessment
(Cambridge:
Cambridge
University
Press).
10.2.4
Climate
of
Recent
Past
Given
the
complexity
of the
climate system,
the
study
of the
past provides
a
useful
guide
to the
future.
In
chapter
9 we
discuss
the
climate history
of the
planet over
geological time
in
terms
of
compositional changes
and the
greenhouse
effect.
How-
ever,
our
knowledge
of
Earth
in the
remote past
is
very uncertain. Thus, most
of the
modeling
of
paleoclimate
does
not
constitute
a
validation
of our
current climate mod-
els.
The
exception
may be the
last glacial maximum (LGM) about
18 kyr ago and the
penultimate glacial maximum (PGM)
about
140 kyr
ago.
These
periods
are
sufficiently
Figure
10.14
Surface
temperature
changes
at
different
latitudes
and
time
of the
year
predicted
by the
GISS
model.
The
shaded
areas
have
changes
in
excess
of
4°C.
After
Hansen,
J. E. et
al.,
1984,
"Climate
Sensitivity:
Analysis
of
Feedback
Mechanisms,"
in
Climate
Processes
and
Climate
Sensitivity,
J. E.
Hansen
and
T.
Takeuchi,
editors
(Geophysical
Monogr.
29;
Washington,
D.C.:
American
Geophysical
Union),
p.
130.
Earth:
Human
Impact
379
Figure
I
O.I
5
Altitude-latitude
diagram
of
changes
in
zonally
averaged temperatures predicted
by the
GISS
model.
After
Hansen,
J. E. el
al.,
1984, "Climate
Sensitivity:
Analysis
of
Feedback Mechanisms,"
in
Climate Processes
and
Climate
Sensitivity,
J. E.
Hansen
and T.
Takeuchi, editors (Geophysical
Monogr.
29;
Washington, D.C.: American Geophysical Union),
p.
130.
close
to
modern times that
a
record
of the
paleoenvironments
may be
reconstructed
from
geological
and
geochemical data.
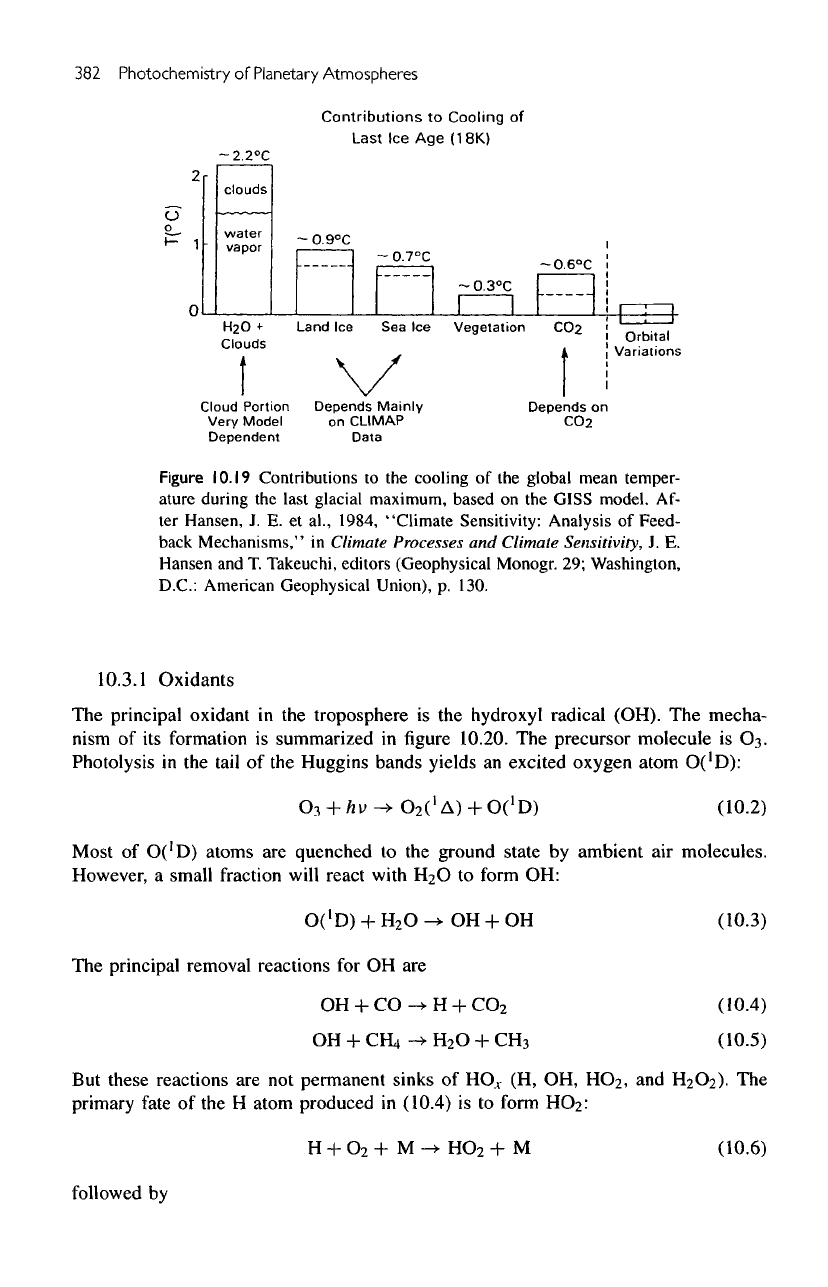
Figure
10.18
shows
the
local temperature
and CH4 and
CC>2
concentrations deduced
from
Antarctic
ice
cores
in the
last
160
kyr.
Note
the
generally
good
agreement
between
the
temperature
and the
concentrations
of the
principal
greenhouse
gases,
CO2
and
CH
4
.
For
example, during
the
coldest periods (the
LGM and the
PGM),
the
temperatures were about 10°C lower than they were
in the
interglacial period.
At the
same time
CH
4
concentrations
fell
from
600 to 380
ppbv;
CC>2
concentrations
decreased
from
280 to
190
ppmv.
Thus, there
is a
well-established correlation between
temperature
and the
greenhouse
gases.
However,
we
must emphasize
that
this
does
not
imply that
changes
in the
greenhouse
gases
drive climatic
changes.
It is
difficult
to
determine
which
is the
cause
and
which
is the
effect.
The
only circumstantial evidence
we
have
is
that
the
COa
increase preceded
the
rise
of
temperature during
the PGM
(see section
9.4.4).
Without
inquiring
into
the
ultimate cause
of the ice
ages,
we can
ask
a
more restricted question:
Can we
account
for the
temperature changes
in the
LGM by the
observed changes
of the
greenhouse
gases?
Quantitative modeling
of the
climate
of the LGM has
been
carried
out by GCM
studies.
The
results
of one
model
(the
GISS
model) incorporating
CC>2
and
other known changes
as
well
as
water vapor
feedbacks
are
summarized
in
figure
10.19.
The
change
in
global mean temperature
is
4.7°C.
Note
the
large changes
due to
feedback
of the
hydrological cycle (water
vapor, ice,
and
clouds). Change
in
CC«2
only accounts
for
0.6°C.
CH
4
has not
been
included
in
this
model
but is
expected
to
contribute less
than
0.2°C
to
global mean
temperature.
The
change
of the
global mean surface temperature during
the LGM
is
still
controversial
but is
believed
to
have been between
4°C
and
7°C.
The
GISS
380
Photochemistry
of
Planetary
Atmospheres
Figure
I
O.I
6
Ratio
of
simulated sulfate concentrations
at 900
mbar
based
on
total
emis-
sion,
to
that
due to
natural
emission.
After
Intergovernmental Panel
on
Climate Change,
1990, Climate Change:
the
IPCC
Scientific
Assessment,
and
1992,
Climate Change
1992:
Supplement
to the
IPCC
Scientific
Assessment (Cambridge: Cambridge University
Press).
model could account
for the
bulk
of the
temperature change between
the LGM and
the
present.
As
pointed
out in
section
9.4.4,
the
climate system
in the
past
has
exhibited rapid
"quantum
jumps."
The
nature
of
these sudden drastic changes
in
climate with time
constants
less than
100 yr is not
well understood
but is
believed
to be the
result
of a
major
reorganization
of the
ocean circulation system. None
of the
observed quantum
behavior
of
paleoclimate
can be
explained
by the
greenhouse
effect
alone. Internal
dynamical
instabilities
and
strongly nonlinear coupling between
the
atmosphere
and
the
ocean
may be
important parts
of the
intricate mechanism
of
climate.
All
these
are
poorly
understood
at the
moment.
Figure
10.17
Perturbation
of
surface temperature
due to
stratospheric
aerosols
after
the
erup-
tion
of
Mount
Agung
in
1963.
After
Hansen,
J. E.,
Wang, W.-C.,
and
Lacis,
A.
A.,
1978,
"Mount Agung Eruption Provides Test
of a
Global Climate Perturbation." Science
199,
1065.
Earth:
Human
Impact
381
Figure
10.18
Variations
in
local
temperature,
CO
2
,
and
CH4
during
the
last
160,000
yr. The
dashed
lines
indicate
the
range
of
uncertainty
in the
mea-
surements.
After
Intergovernmental
Panel
on
Climate
Change, 1990, Climate
Change:
the
IPCC
Scientific
Assessment,
and
1992, Climate Change 1992: Sup-
plement
to the
IPCC
Scientific
Assessment (Cambridge: Cambridge
University
Press).
10.3
Tropospheric Chemistry
The
troposphere contains
90% of the
mass
of the
atmosphere. Most
of the
trace species
in
the
atmosphere have
their
origin
in the
continental
or the
oceanic biosphere.
A
large
number
of
trace
gases
(e.g.,
CO,
CH
4
,
Q>H
6
,
H
2
,
CH
3
C1,
CH
3
Br,
H
2
S,
CH
3
CC1
3
)
first
undergo
reactions
in the
troposphere. Only species
that
are not
totally
destroyed
in
the
troposphere ultimately
get
transported
to the
stratosphere.
382
Photochemistry
of
Planetary
Atmospheres
Figure
10.19
Contributions
to the
cooling
of the
global mean temper-
ature
during
the
last glacial maximum, based
on the
GISS
model.
Af-
ter
Hansen,
J. E. et
al.,
1984,
"Climate
Sensitivity: Analysis
of
Feed-
back
Mechanisms,"
in
Climate Processes
and
Climate Sensitivity,
i. E.
Hansen
and T.
Takeuchi, editors (Geophysical Monogr.
29;
Washington,
D.C.: American Geophysical Union),
p.
130.
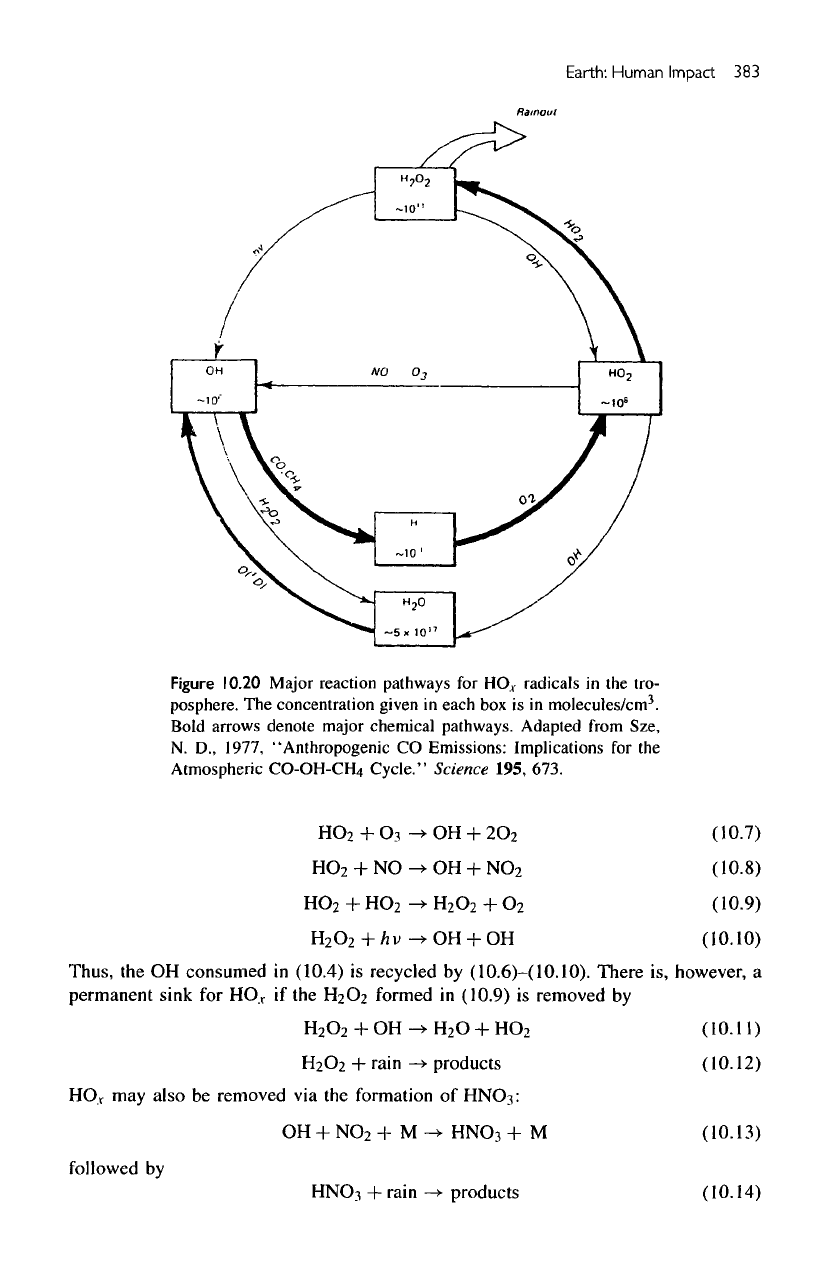
10.3.1
Oxidants
The
principal oxidant
in the
troposphere
is the
hydroxyl radical (OH).
The
mecha-
nism
of its
formation
is
summarized
in figure
10.20.
The
precursor molecule
is
63.
Photolysis
in the
tail
of the
Huggins bands yields
an
excited oxygen atom
O('D):
Most
of
O('D)
atoms
are
quenched
to the
ground state
by
ambient
air
molecules.
However,
a
small
fraction
will
react with
H
2
O
to
form
OH:
The
principal removal reactions
for OH are
But
these reactions
are not
permanent sinks
of
HO.
V
(H, OH,
HO
2
,
and
H
2
O
2
).
The
primary
fate
of the H
atom produced
in
(10.4)
is to
form
HO
2
:
followed
by
Earth: Human Impact
383
Figure
10.20
Major reaction pathways
for
HO,
radicals
in the
tro-
posphere.
The
concentration
given
in
each
box is in
molecules/cm
3
.
Bold
arrows denote
major
chemical pathways. Adapted
from
Sze,
N.
D.,
1977,
"Anthropogenic
CO
Emissions: Implications
for the
Atmospheric
CO-OH-CH
4
Cycle."
Science
195, 673.
Thus,
the OH
consumed
in
(10.4)
is
recycled
by
(10.6)-(10.10).
There
is,
however,
a
permanent
sink
for
HO.
r
if the
H
2
O
2
formed
in
(10.9)
is
removed
by
V
may
also
be
removed
via the
formation
of
HNOs:
followed
by
384
Photochemistry
of
Planetary
Atmospheres
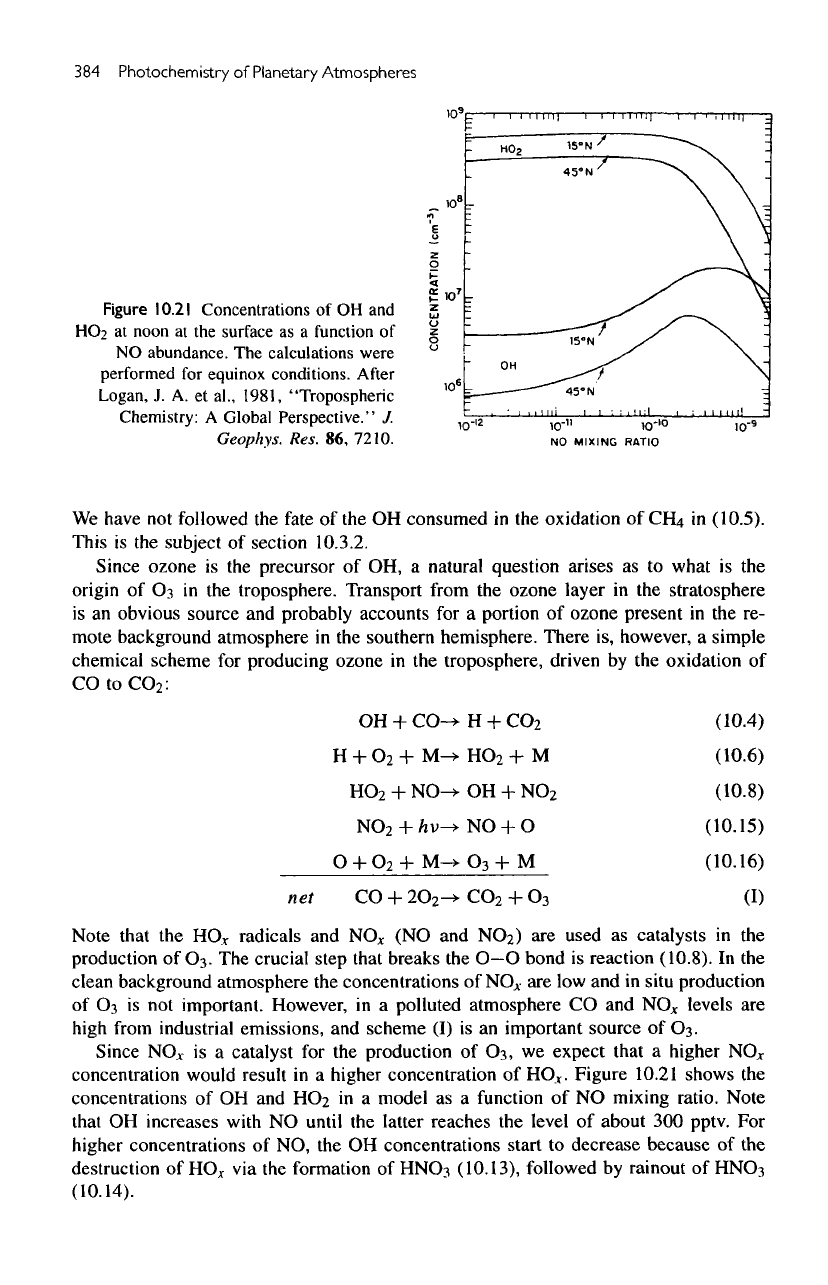
Figure
10.21
Concentrations
of OH and
HO2
at
noon
at the
surface
as a
function
of
NO
abundance.
The
calculations were
performed
for
equinox conditions.
After
Logan,
J. A. et
al.,
1981,
"Tropospheric
Chemistry:
A
Global
Perspective."
J.
Geophys.
Res.
86,
7210.
We
have
not
followed
the
fate
of the OH
consumed
in the
oxidation
of CH4 in
(10.5).
This
is the
subject
of
section
10.3.2.
Since ozone
is the
precursor
of OH, a
natural question arises
as to
what
is the
origin
of
O
3
in the
troposphere. Transport from
the
ozone layer
in the
stratosphere
is
an
obvious source
and
probably accounts
for a
portion
of
ozone present
in the re-
mote background atmosphere
in the
southern hemisphere.
There
is,
however,
a
simple
chemical scheme
for
producing ozone
in the
troposphere, driven
by the
oxidation
of
CO
toCO
2
:
Note that
the
HO
r
radicals
and
NO*
(NO and
NO
2
)
are
used
as
catalysts
in the
production
of
O
3
.
The
crucial step
that
breaks
the
O—O
bond
is
reaction (10.8).
In the
clean background atmosphere
the
concentrations
of
NO
A
are low and in
situ production
of
O
3
is not
important. However,
in a
polluted atmosphere
CO and
NO*
levels
are
high
from
industrial emissions,
and
scheme
(I) is an
important source
of
O
3
.
Since
NO
V
is a
catalyst
for the
production
of
O
3
,
we
expect that
a
higher
NOj
concentration
would result
in a
higher concentration
of
HO
V
.
Figure
10.21
shows
the
concentrations
of OH and
HO
2
in a
model
as a
function
of NO
mixing ratio.
Note
that
OH
increases
with
NO
until
the
latter reaches
the
level
of
about
300
pptv.
For
higher
concentrations
of NO, the OH
concentrations start
to
decrease
because
of the
destruction
of
HO*
via the
formation
of
HNO
3
(10.13),
followed
by
rainout
of
HNO
3
(10.14).
Earth:
Human
Impact
385
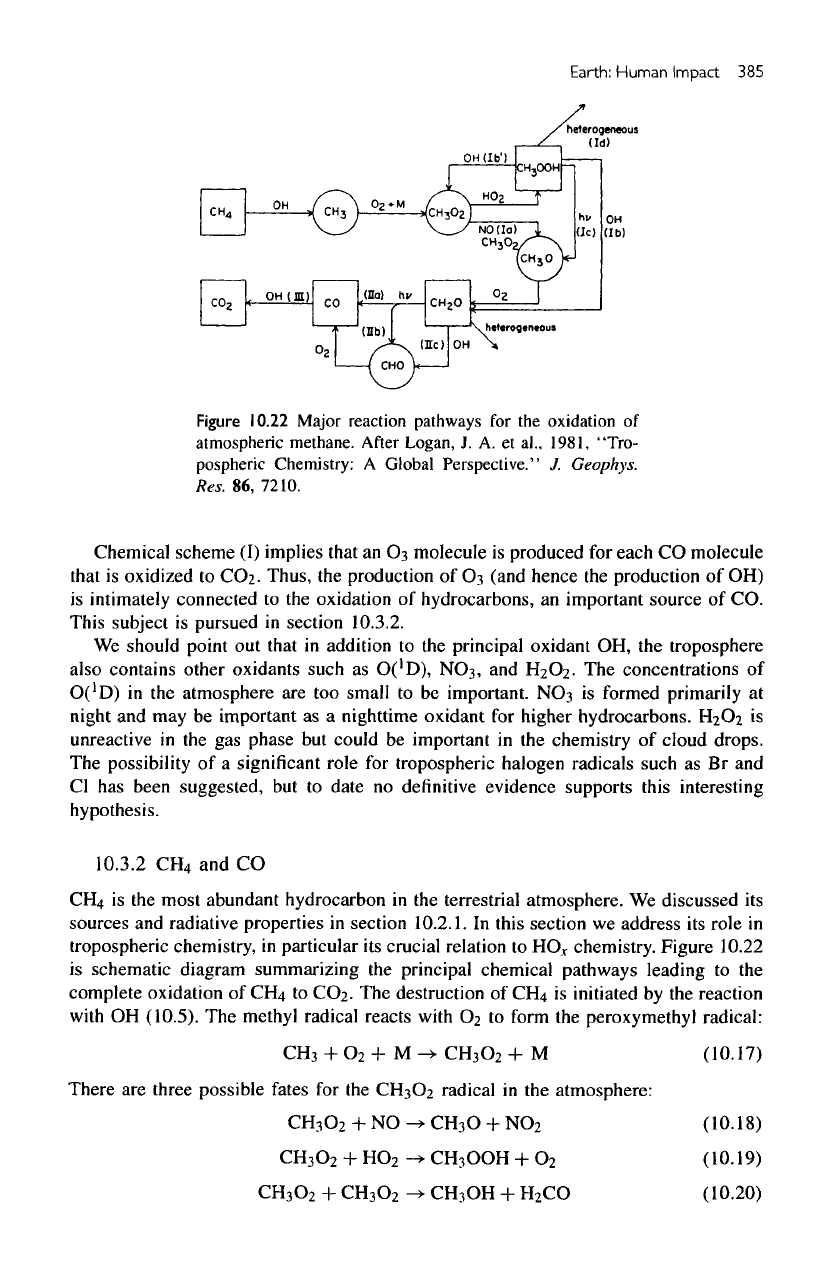
Figure
10.22
Major reaction pathways
for the
oxidation
of
atmospheric methane.
After
Logan,
J. A. et
al.,
1981,
"Tro-
pospheric Chemistry:
A
Global
Perspective."
J.
Geophys.
Res.
86,
7210.
Chemical scheme
(I)
implies
that
an 03
molecule
is
produced
for
each
CO
molecule
that
is
oxidized
to
CO
2
.
Thus,
the
production
of 03
(and hence
the
production
of OH)
is
intimately connected
to the
oxidation
of
hydrocarbons,
an
important source
of CO.
This
subject
is
pursued
in
section 10.3.2.
We
should point
out
that
in
addition
to the
principal oxidant
OH, the
troposphere
also contains other oxidants such
as
O('D),
NO3,
and
H2O2-
The
concentrations
of
O('D)
in the
atmosphere
are too
small
to be
important.
NOs
is
formed primarily
at
night
and may be
important
as a
nighttime oxidant
for
higher
hydrocarbons.
H
2
O
2
is
unreactive
in the gas
phase
but
could
be
important
in the
chemistry
of
cloud
drops.
The
possibility
of a
significant
role
for
tropospheric halogen radicals such
as Br and
Cl
has
been suggested,
but to
date
no
definitive
evidence supports
this
interesting
hypothesis.
10.3.2
CH
4
and CO
is
the
most abundant hydrocarbon
in the
terrestrial
atmosphere.
We
discussed
its
sources
and
radiative properties
in
section
10.2.1.
In
this section
we
address
its
role
in
tropospheric chemistry,
in
particular
its
crucial relation
to
HO*
chemistry. Figure
10.22
is
schematic diagram summarizing
the
principal chemical pathways leading
to the
complete oxidation
of
CH
4
to
CO
2
.
The
destruction
of CH4 is
initiated
by the
reaction
with
OH
(10.5).
The
methyl radical reacts
with
02 to
form
the
peroxymethyl radical:
There
are
three possible fates
for the
CH3O2 radical
in the
atmosphere: