Yung Y.L., DeMore W.B. Photochemistry of Planetary Atmospheres
Подождите немного. Документ загружается.

366
Photochemistry
of
Planetary
Atmospheres
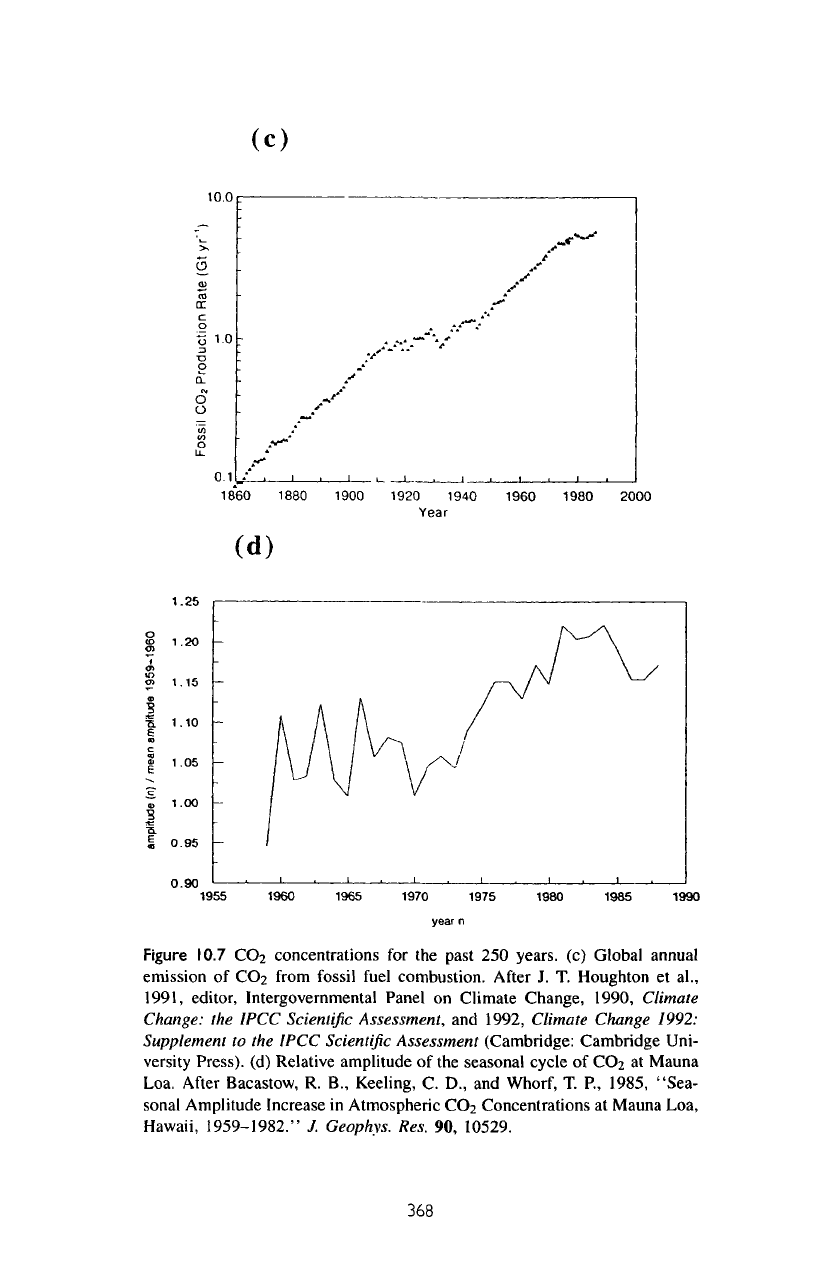
Table
10.1
Summary
of key
greenhouse gases
influenced
by
human
activities
Parameter
Crt,
CFC-11
CFC-12
N
2
O
Preindustrial
atmospheric
280
ppmv
0.8
ppmv
concenlration
(1750-1800)
Current
atmospheric
353
ppmv
1.72
ppmv
concentration
(1990)
a
1.8
ppmv
(0.5%)
0 0
Current
rate
of
annual
atmospheric
accumulation
Atmospheric
lifetime
11
(yr)
0.015
ppmv
9.5
pptv
(0.9%)
288
ppbv
280
pptv
484
pptv
310
ppbv
17
pptv
(50-200)
10
65
130
0.8
ppbv
(0.25%)
150
From
Intergovernmental Panel
on
Climate
Change
(1990).
Ozone
is not
included
in
the
lable
because
of
lack
of
precise
data,
ppmv
=
parts
per
million
by
volume;
ppbv
=
parts
per
billion
by
volume; pptv
=
parts
per
trillion
by
volume.
"The
current
(1990)
concentrations have been
estimated
based upon
an
extrapolation
of
measurements
reported
for
earlier
years,
assuming
that
(he
recent
trends
remained
approximately
constant.
h
For
each
gas
listed,
except
CO;,
the
"lifetime"
is
defined here
as the
ratio
of the
atmospheric
content
to
the
total
rate
of
removal. This lime scale also characterizes
the
rate
of
adjustment
of the
atmospheric
concentrations
if the
emission rates
are
changed abruptly.
COi
is a
special
case
since
it has no
real sinks,
but
is
merely circulated between various reservoirs
(atmosphere,
ocean,
biota).
The
"u'fe(ime"of
COi
given
here
is a
rough
indiction
of the
time
it
would take
for the
COi
concentration
to
adjust
to
changes
in
the
emissions.
result
of
agricultural activities.
The
cause
for the
increase
in N2O
remains obscure
but
is
probably associated with
the
perturbation
of the
nitrogen cycle.
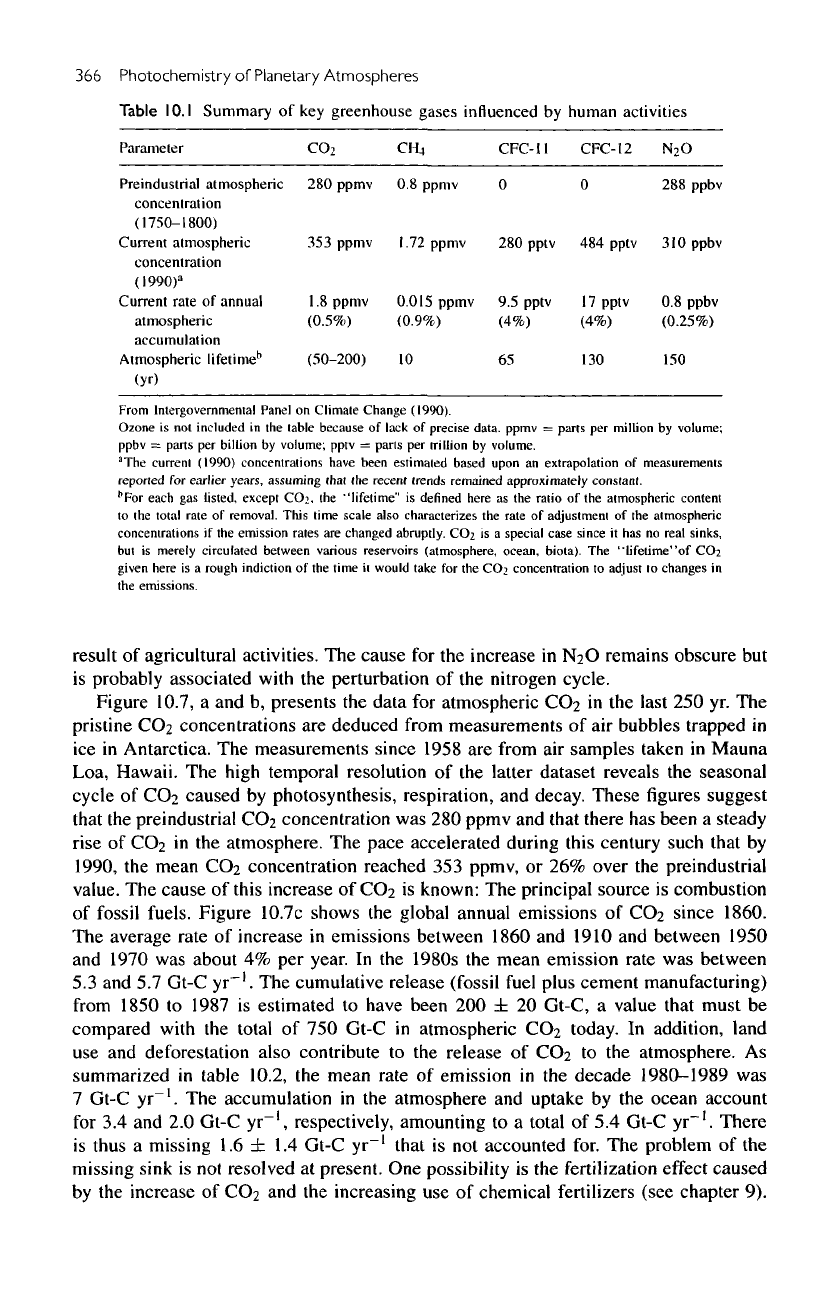
Figure 10.7,
a and b,
presents
the
data
for
atmospheric
CC>2
in the
last
250 yr. The
pristine
CC<2
concentrations
are
deduced from measurements
of air
bubbles trapped
in
ice in
Antarctica.
The
measurements since 1958
are
from
air
samples
taken
in
Mauna
Loa, Hawaii.
The
high temporal resolution
of the
latter dataset reveals
the
seasonal
cycle
of CO2
caused
by
photosynthesis, respiration,
and
decay.
These
figures
suggest
that
the
preindustrial
CC>2
concentration
was 280
ppmv
and
that there
has
been
a
steady
rise
of
CC>2
in the
atmosphere.
The
pace
accelerated during this century such that
by
1990,
the
mean
CC>2
concentration reached
353
ppmv,
or 26%
over
the
preindustrial
value.
The
cause
of
this increase
of CO2 is
known:
The
principal source
is
combustion
of
fossil
fuels.
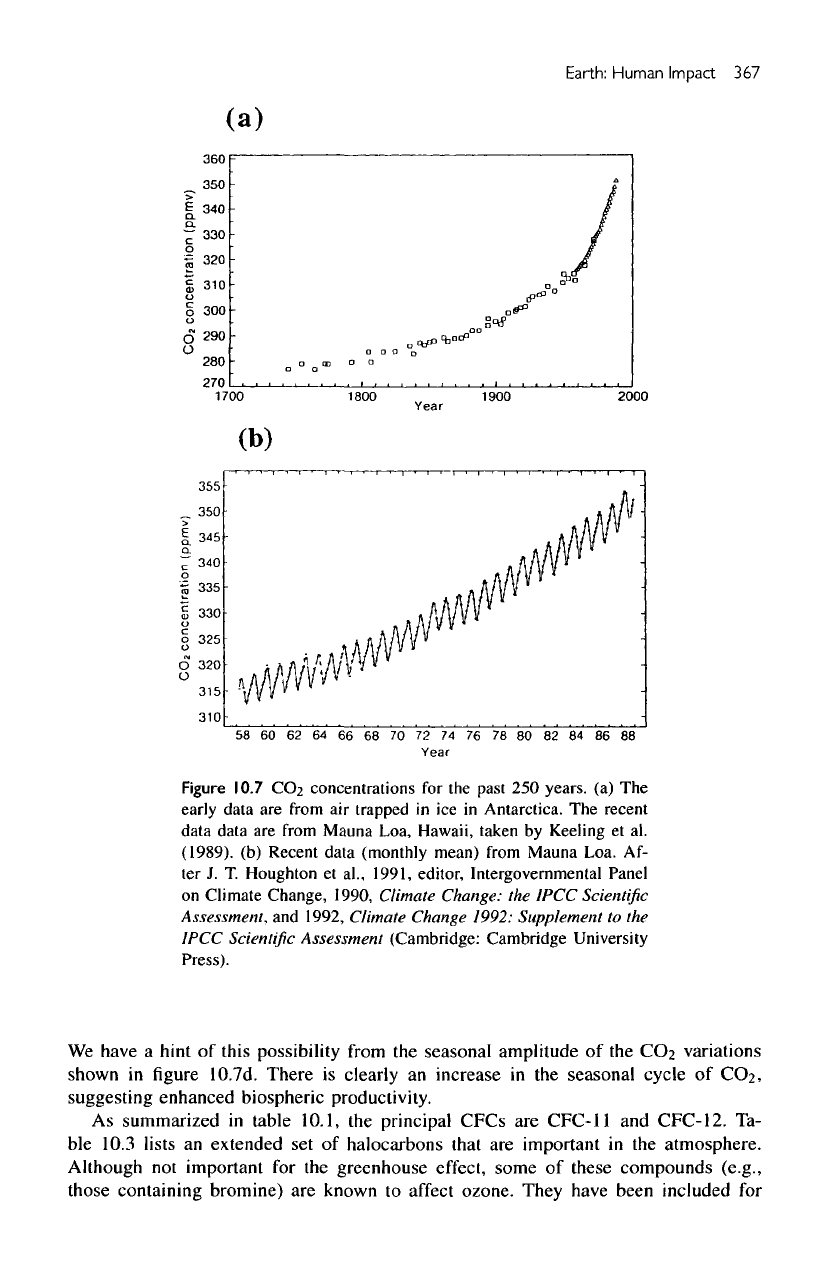
Figure 10.7c shows
the
global annual emissions
of
CC>2
since 1860.
The
average rate
of
increase
in
emissions between 1860
and
1910
and
between 1950
and
1970
was
about
4% per
year.
In the
1980s
the
mean emission rate
was
between
5.3 and 5.7
Gt-C
yr"
1
.
The
cumulative
release
(fossil
fuel
plus cement manufacturing)
from
1850
to
1987
is
estimated
to
have been
200 ± 20
Gt-C,
a
value that must
be
compared with
the
total
of 750
Gt-C
in
atmospheric
CC>2
today.
In
addition, land
use and
deforestation also contribute
to the
release
of
CC>2
to the
atmosphere.
As
summarized
in
table 10.2,
the
mean rate
of
emission
in the
decade
1980-1989
was
7
Gt-C
yr"
1
.
The
accumulation
in the
atmosphere
and
uptake
by the
ocean account
for
3.4 and 2.0
Gt-C
yr~',
respectively, amounting
to a
total
of 5.4
Gt-C
yr~'.
There
is
thus
a
missing
1.6 ± 1.4
Gt-C
yr~'
that
is not
accounted for.
The
problem
of the
missing
sink
is not
resolved
at
present.
One
possibility
is the
fertilization
effect
caused
by
the
increase
of
CC>2
and the
increasing
use of
chemical fertilizers (see chapter
9).
Earth:
Human
Impact
367
(a)
Figure
10.7
CC>2
concentrations
for the
past
250
years,
(a) The
early data
are
from
air
trapped
in ice in
Antarctica.
The
recent
data data
are
from
Mauna
Loa, Hawaii, taken
by
Keeling
et
al.
(1989).
(b)
Recent data (monthly mean) from Mauna Loa.
Af-
ter J. T.
Houghton
et
al.,
1991,
editor.
Intergovernmental Panel
on
Climate Change, 1990,
Climate
Change:
the
1PCC Scientific
Assessment,
and
1992,
Climate
Change
1992: Supplement
to the
IPCC
Scientific
Assessment
(Cambridge:
Cambridge
University
Press).
We
have
a
hint
of
this possibility from
the
seasonal
amplitude
of the
CC»2
variations
shown
in figure
10.7d.
There
is
clearly
an
increase
in the
seasonal
cycle
of
CC>2,
suggesting enhanced
biospheric
productivity.
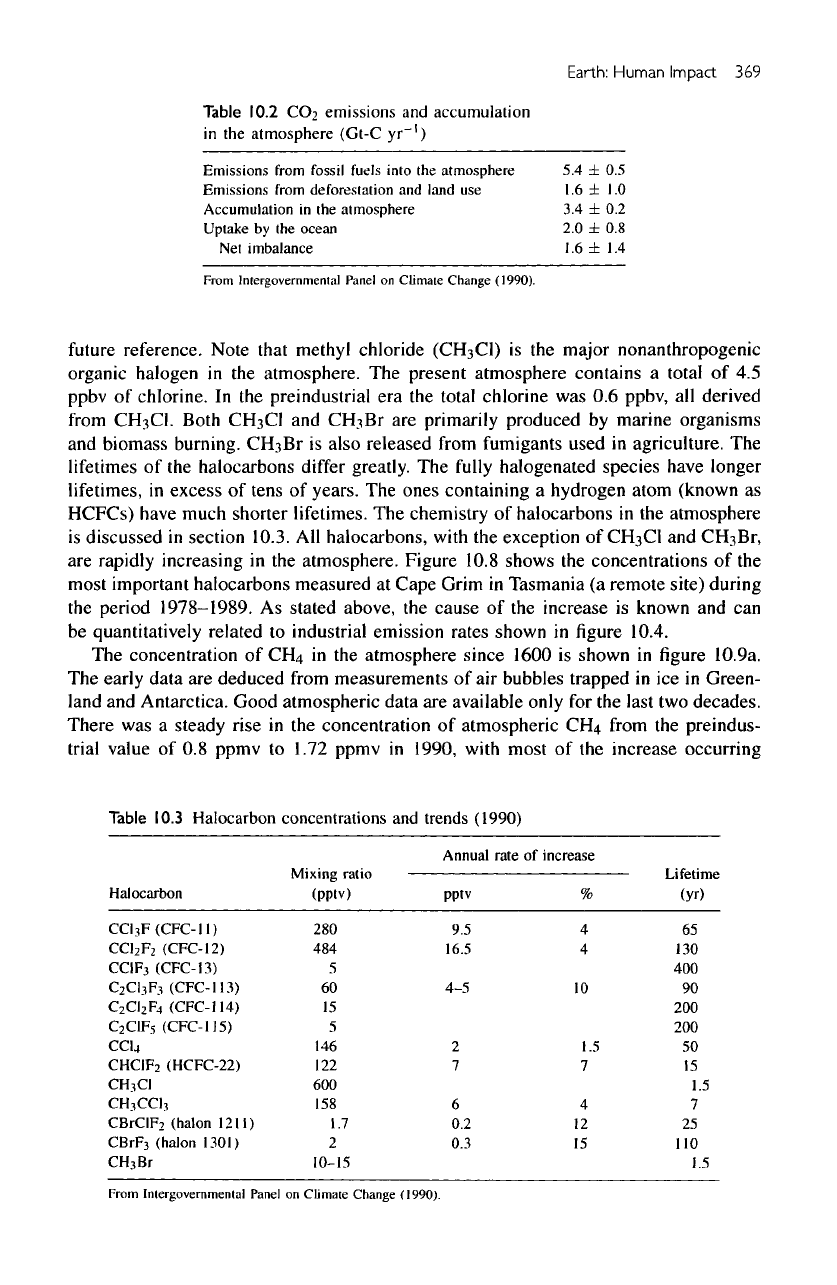
As
summarized
in
table 10.1,
the
principal
CFCs
are
CFC-11
and
CFC-12.
Ta-
ble
10.3 lists
an
extended
set of
halocarbons
that
are
important
in the
atmosphere.
Although
not
important
for the
greenhouse
effect,
some
of
these compounds
(e.g.,
those containing bromine)
are
known
to
affect
ozone.
They have been included
for
(c)
(d)
Figure
10.7
CC>2
concentrations
for the
past
250
years,
(c)
Global annual
emission
of
CC"2
from
fossil
fuel
combustion.
After
J. T.
Houghton
et
al.,
1991, editor, Intergovernmental Panel
on
Climate Change,
1990,
Climate
Change:
the
IPCC
Scientific
Assessment,
and
1992,
Climate Change
1992:
Supplement
to the
IPCC Scientific
Assessment
(Cambridge: Cambridge
Uni-
versity
Press),
(d)
Relative amplitude
of the
seasonal cycle
of
CC<2
at
Mauna
Loa.
After
Bacastow,
R. B.,
Keeling,
C.
D.,
and
Whorf,
T. P.,
1985, "Sea-
sonal
Amplitude Increase
in
Atmospheric
CC>2
Concentrations
at
Mauna
Loa,
Hawaii,
1959-1982."
/
Geophys.
Res.
90,
10529.
368
Earth:
Human
Impact
369
Table
10.2
C(>>
emissions
and
accumulation
in
the
atmosphere
(Gt-C
yr~")
Emissions
from
fossil fuels into
the
atmosphere
5.4 ± 0.5
Emissions
from
deforestation
and
land
use
1.6
±
1.0
Accumulation
in the
atmosphere
3.4 ± 0.2
Uptake
by the
ocean
2.0 ± 0.8
Net
imbalance
1.6
± 1.4
From
Intergovernmental
Panel
on
Climate
Change
(1990).
future
reference. Note
that
methyl chloride
(CH
3
C1)
is the
major nonanthropogenic
organic
halogen
in the
atmosphere.
The
present atmosphere contains
a
total
of 4.5
ppbv
of
chlorine.
In the
preindustrial
era the
total chlorine
was 0.6
ppbv,
all
derived
from
CfyCl.
Both
CHsCl
and
CH.^Br
are
primarily produced
by
marine organisms
and
biomass burning.
CH^Br
is
also
released from fumigants used
in
agriculture.
The
lifetimes
of the
halocarbons
differ
greatly.
The
fully
halogenated
species
have longer
lifetimes,
in
excess
of
tens
of
years.
The
ones containing
a
hydrogen atom (known
as
HCFCs)
have much shorter lifetimes.
The
chemistry
of
halocarbons
in the
atmosphere
is
discussed
in
section 10.3.
All
halocarbons,
with
the
exception
of
CHaCl
and
CHjBr,
are
rapidly increasing
in the
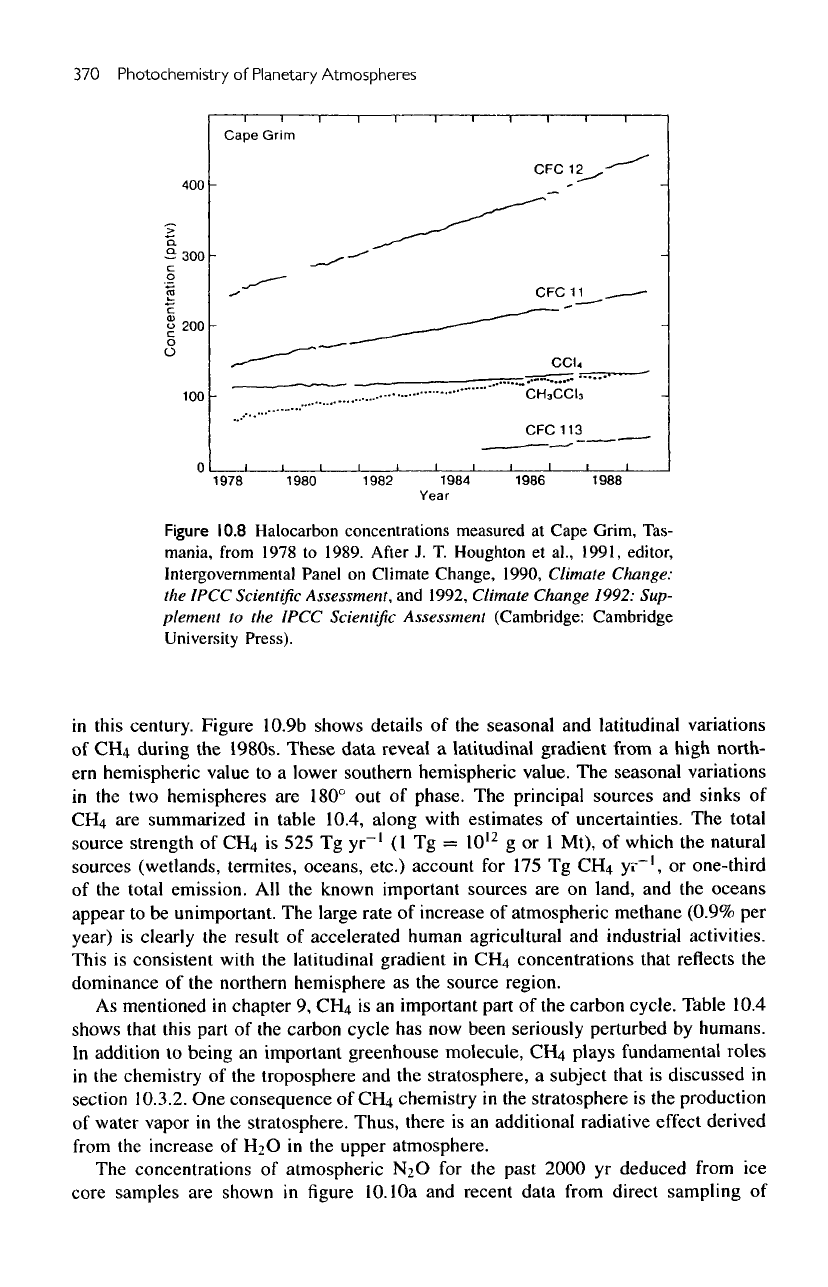
atmosphere. Figure 10.8 shows
the
concentrations
of the
most important halocarbons measured
at
Cape Grim
in
Tasmania
(a
remote site) during
the
period
1978-1989.
As
stated above,
the
cause
of the
increase
is
known
and can
be
quantitatively related
to
industrial emission rates shown
in figure
10.4.
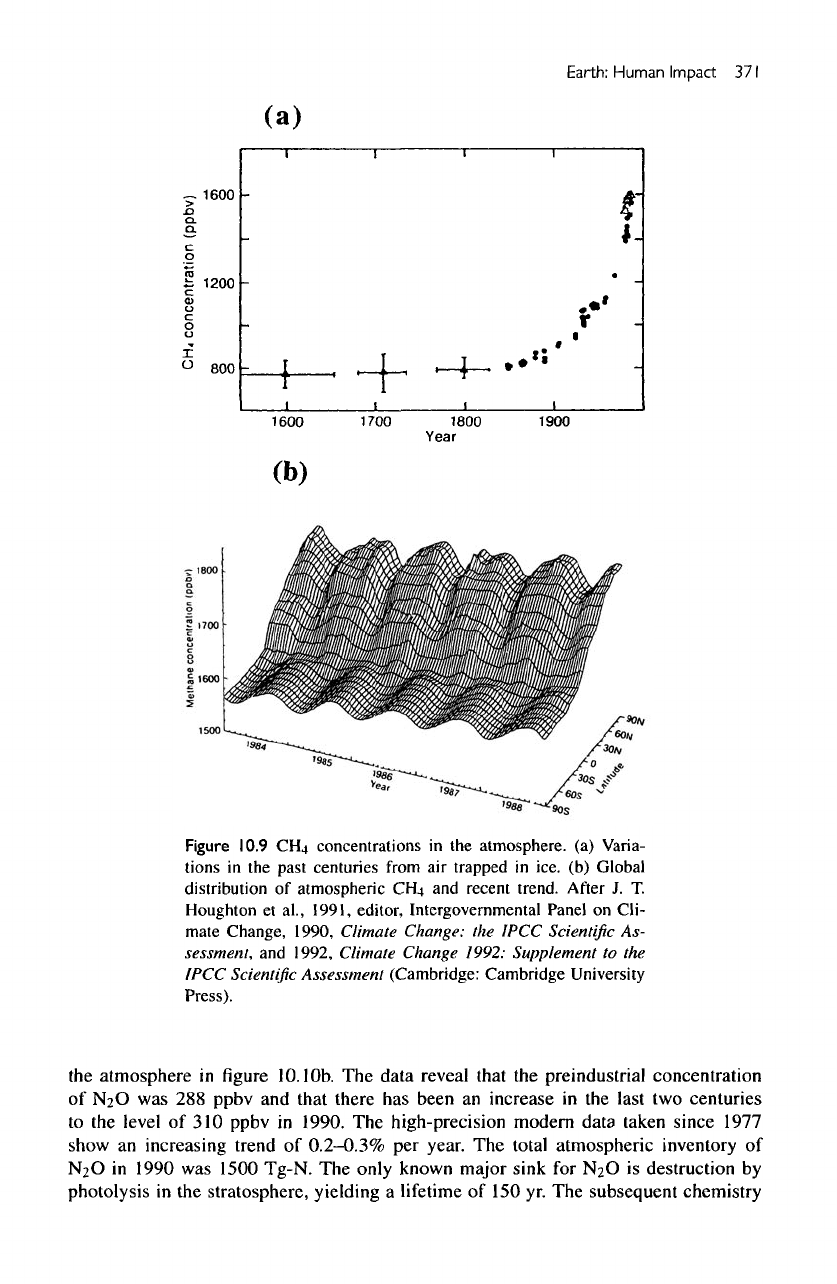
The
concentration
of
CfU
in the
atmosphere since 1600
is
shown
in figure
10.9a.
The
early data
are
deduced from measurements
of air
bubbles trapped
in ice in
Green-
land
and
Antarctica. Good atmospheric data
are
available only
for the
last
two
decades.
There
was a
steady rise
in the
concentration
of
atmospheric
CH4
from
the
preindus-
trial
value
of 0.8
ppmv
to
1.72
ppmv
in
1990, with most
of the
increase occurring
Table
10.3
Halocarbon
concentrations
and
trends
(1990)
Halocarbon
CCI
3
F(CFC-11)
CC1
2
F
2
(CFC-12)
CCIF
3
(CFC-13)
C
2
CI
3
F
3
(CFC-113)
C
2
CI
2
F.4
(CFC-114)
C
2
C1F
5
(CFC-115)
ecu
CHCIF
2
(HCFC-22)
CH
3
CI
CH
3
CCI
3
CBrCIF
2
(halon
1211)
CBrF
3
(halon
1301)
CH
3
Br
Mixing
ratio
(pptv)
280
484
5
60
15
5
146
122
600
158
1.7
2
10-15
Annual
rate
of
increase
pptv
9.5
16.5
4-5
2
7
6
0.2
0.3
%
4
4
10
1.5
7
4
12
15
Lifetime
(yr)
65
130
400
90
200
200
50
15
1.5
7
25
110
1.5
From
Intergovernmental
Panel
on
Climate
Change
(1990).
370
Photochemistry
of
Planetary
Atmospheres
Figure
10.8
Halocarbon concentrations measured
at
Cape Grim, Tas-
mania,
from
1978
to
1989.
After
J. T.
Houghton
et
al.,
1991, editor,
Intergovernmental
Panel
on
Climate Change, 1990, Climate
Cfiange:
the
IPCC
Scientific
Assessment,
and
1992, Climate Change 1992: Sup-
plement
to the
IPCC Scientific Assessment (Cambridge: Cambridge
University
Press).
in
this century. Figure 10.9b shows details
of the
seasonal
and
latitudinal variations
of
CH4
during
the
1980s.
These
data
reveal
a
latitudinal
gradient
from
a
high
north-
ern
hemispheric value
to a
lower southern hemispheric value.
The
seasonal
variations
in
the two
hemispheres
are
180°
out of
phase.
The
principal
sources
and
sinks
of
CH4
are
summarized
in
table 10.4, along with estimates
of
uncertainties.
The
total
source strength
of
CH
4
is 525 Tg
yr~'
(1
Tg =
10
12
g or 1
Mt),
of
which
the
natural
sources (wetlands, termites, oceans, etc.) account
for 175 Tg
CH
4
yr~',
or
one-third
of
the
total emission.
All the
known important sources
are on
land,
and the
oceans
appear
to be
unimportant.
The
large rate
of
increase
of
atmospheric methane (0.9%
per
year)
is
clearly
the
result
of
accelerated human agricultural
and
industrial
activities.
This
is
consistent
with
the
latitudinal
gradient
in
CH
4
concentrations that reflects
the
dominance
of the
northern hemisphere
as the
source region.
As
mentioned
in
chapter
9,
CH
4
is an
important part
of the
carbon cycle. Table 10.4
shows
that
this
part
of
the
carbon cycle
has now
been seriously perturbed
by
humans.
In
addition
to
being
an
important greenhouse molecule,
CH
4
plays fundamental
roles
in
the
chemistry
of the
troposphere
and the
stratosphere,
a
subject
that
is
discussed
in
section
10.3.2.
One
consequence
of
CH
4
chemistry
in the
stratosphere
is the
production
of
water vapor
in the
stratosphere. Thus, there
is an
additional radiative
effect
derived
from
the
increase
of H2O in the
upper atmosphere.
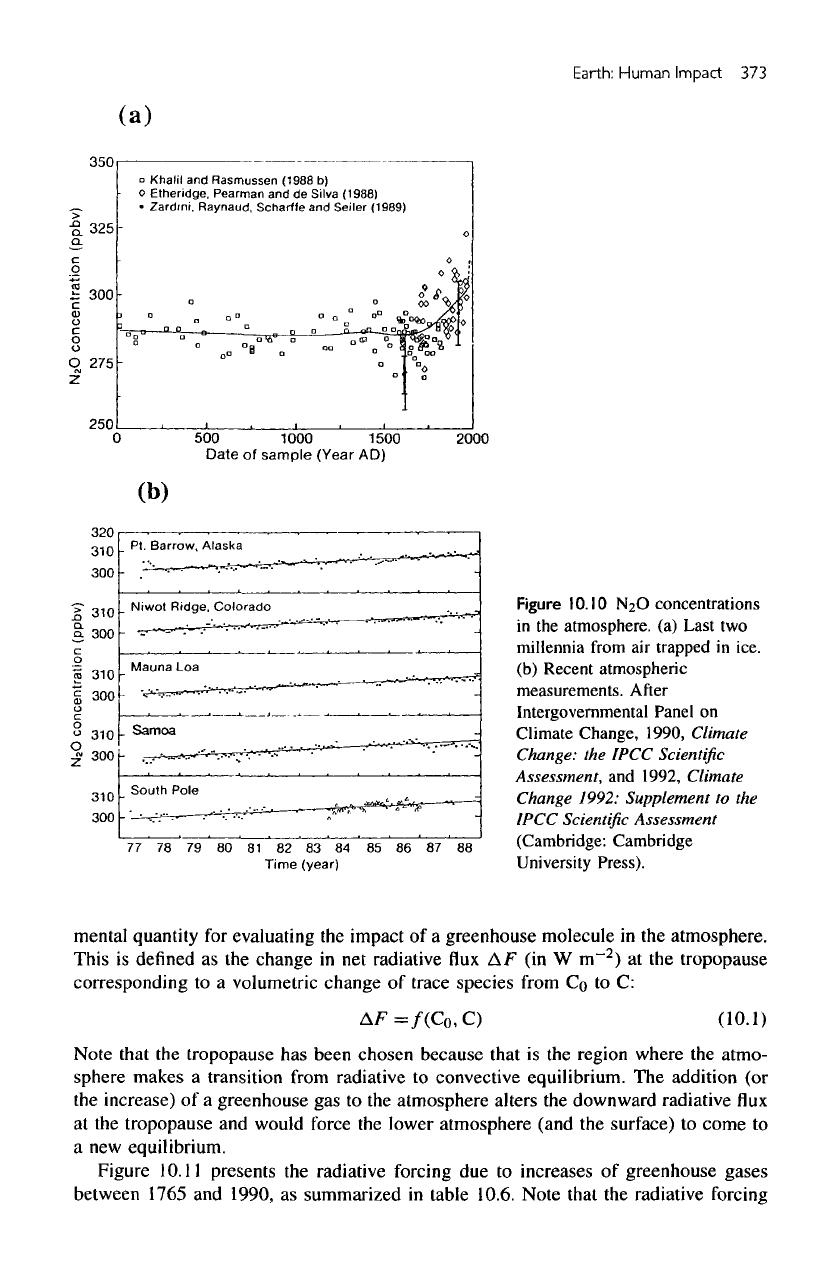
The
concentrations
of
atmospheric
N
2
O
for the
past
2000
yr
deduced
from
ice
core samples
are
shown
in
figure
lO.lOa
and
recent data
from
direct sampling
of
Earth: Human Impact
371
(a)
Figure
10.9
CRj
concentrations
in the
atmosphere,
(a)
Varia-
tions
in the
past
centuries
from
air
trapped
in
ice.
(b)
Global
distribution
of
atmospheric
CH.4
and
recent
trend.
After
J. T.
Houghton
et
al.,
1991,
editor,
Intergovernmental
Panel
on
Cli-
mate
Change, 1990, Climate Change:
the
IPCC
Scientific
As-
sessment,
and
1992, Climate Change 1992: Supplement
to the
IPCC
Scientific
Assessment (Cambridge: Cambridge
University
Press).
the
atmosphere
in
figure
10.lOb.
The
data
reveal
that
the
preindustrial concentration
of N2O was 288
ppbv
and
that there
has
been
an
increase
in the
last
two
centuries
to
the
level
of 310
ppbv
in
1990.
The
high-precision
modern
data
taken since 1977
show
an
increasing trend
of
0.2-0.3%
per
year.
The
total atmospheric inventory
of
N2O
in
1990
was
1500 Tg-N.
The
only known major sink
for
NaO
is
destruction
by
photolysis
in the
stratosphere, yielding
a
lifetime
of 150 yr. The
subsequent chemistry
372
Photochemistry
of
Planetary
Atmospheres
Table
10.4
Estimated
sources
and
sinks
of
methane
(Tg
CH4)
Annual
Release Range
Source
Natural
wetlands (bogs, swamps,
tundra,
etc.)
Rice
paddies
Enteric fermentation (animals)
Gas
drilling,
venting,
transmission
Biomass
burning
Termites
Landfills
Coal
mining
Oceans
Freshwaters
CH4
hydrate destabilization
Sink
Removal
by
soils
Reaction
with
OH in the
atmosphere
Atmospheric
increase
115
110
80
45
40
40
40
35
10
5
5
30
500
44
100-200
25-170
65-100
25-50
20-80
10-100
20-70
19-50
5-20
1-25
0-100
15-45
400-600
40-48
From Intergovernmental Panel
on
Climate Change (1990).
of N2O in the
stratosphere
is
important
for the
ozone layer,
a
subject that
is
discussed
in
section
10.4.3.
In
steady state
a
source strength
of
about
10
Tg-N
yr~'
must
be
supplied
by the
Earth's surface.
The
sources
and
sinks
of
N
2
O
are
summarized
in
table
10.5.
There
are
still
major uncertainties
in our
current understanding
of the
budget
of
N2O,
in
particular
in the
role
of the
ocean.
It is not
clear whether
N
2
O
is
produced
in the
ocean
from nitrification
in the
surface waters,
or
denitrification
in
the
deep, oxygen-deficient waters.
The
oceanic reservoir
of N2O is
estimated
to be
between
900 and
1100
Tg-N,
comparable
to
that
of the
atmosphere. Therefore,
any
exchange
between
the
atmosphere
and the
ocean would have
a
serious impact
on the
N
2
O
concentrations
in the
atmosphere.
As
stated
in
chapter
9,
NaO
is
part
of the
nitrogen cycle that
has
been perturbed
by
human
activities. Although
we
cannot
quantify
the
causes
for the
observed increase
in
atmospheric
N
2
O,
there
is no
doubt that
this
is the
result
of
anthropogenic activities.
10.2.2
Greenhouse
Effect
To first
order
the
thermal properties
of the
atmosphere
may be
divided into
two
regimes.
The
stratosphere
is in
radiative equilibrium; that
is, its
temperature
is
deter-
mined
by the
balance between solar heating
and
infrared radiation.
The
temperature
structure
of the
troposphere
is
determined
by
convection.
The
rate
of
change
of
tem-
perature
with
altitude
is
known
as the
lapse rate, between
—9
and
—6
°C
km"
1
,
depending
on
whether
the air is dry or
moist. Thus,
a
quantitative evaluation
of the
impact
of a
greenhouse molecule
on the
surface temperature
of the
planet
is
rather
difficult.
This kind
of
modeling
is at
best
a
highly
parameterized procedure, making
comparisons between models
difficult.
However, there
is a
simple
quantity,
known
as
radiative
forcing, that
is
commonly adopted
by the
modeling community
as a
funda-
Earth:
Human
Impact
373
(a)
Figure
10.10
N2O
concentrations
in
the
atmosphere,
(a)
Last
two
millennia
from
air
trapped
in
ice.
(b)
Recent atmospheric
measurements. After
Intergovernmental
Panel
on
Climate
Change, 1990, Climate
Change:
the
IPCC
Scientific
Assessment,
and
1992, Climate
Change 1992: Supplement
to the
IPCC Scientific
Assessment
(Cambridge: Cambridge
University
Press).
mental
quantity
for
evaluating
the
impact
of a
greenhouse molecule
in the
atmosphere.
This
is
defined
as the
change
in net
radiative
flux
AF
(in W
m~
2
)
at the
tropopause
corresponding
to a
volumetric change
of
trace species from
CQ
to C:
Note
that
the
tropopause
has
been chosen because that
is the
region where
the
atmo-
sphere makes
a
transition from radiative
to
convective equilibrium.
The
addition
(or
the
increase)
of a
greenhouse
gas to the
atmosphere alters
the
downward radiative
flux
at
the
tropopause
and
would force
the
lower atmosphere (and
the
surface)
to
come
to
a new
equilibrium.
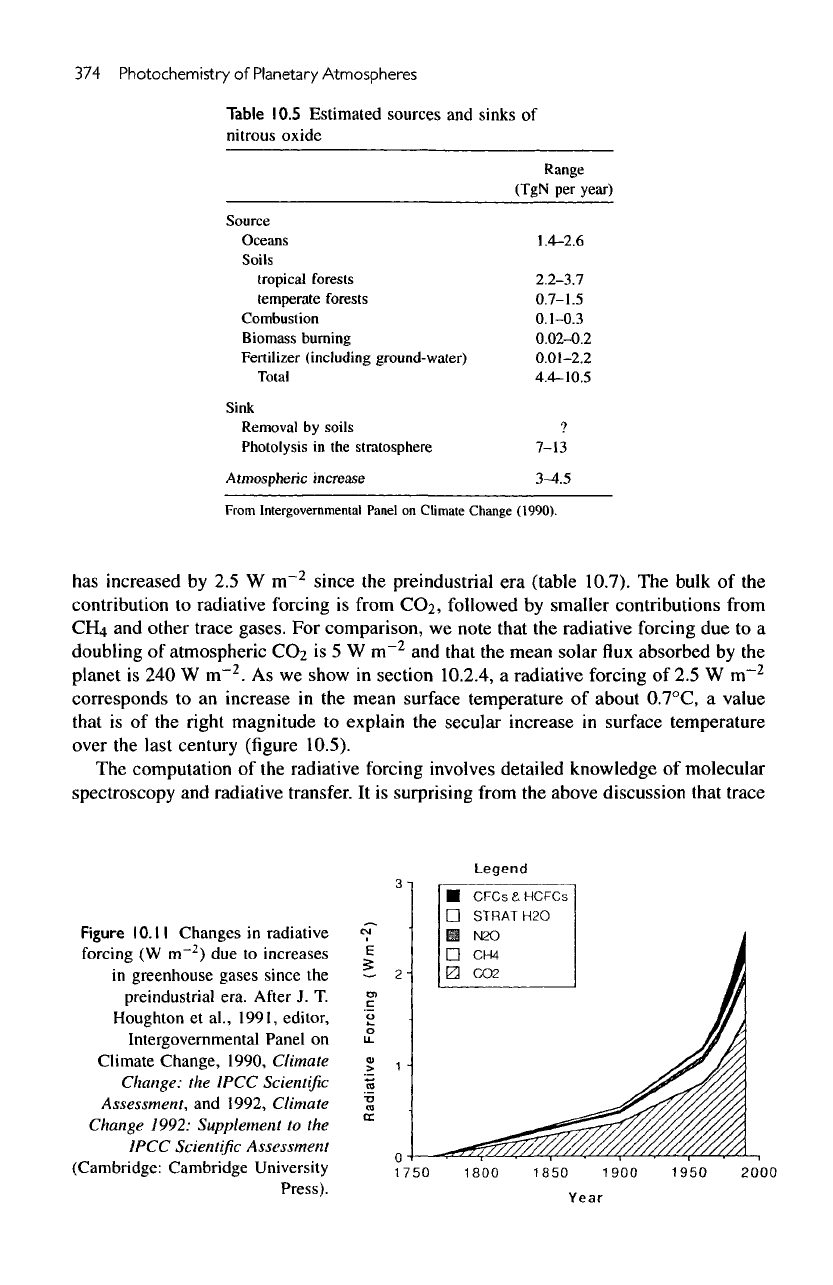
Figure
10.11
presents
the
radiative forcing
due to
increases
of
greenhouse
gases
between 1765
and
1990,
as
summarized
in
table 10.6. Note
that
the
radiative forcing
374
Photochemistry
of
Planetary Atmospheres
Table
10.5
Estimated sources
and
sinks
of
nitrous
oxide
Range
(TgN
per
year)
Source
Oceans
Soils
tropical
forests
temperate
forests
Combustion
Biomass
burning
Fertilizer
(including
ground-water)
Total
Sink
Removal
by
soils
Photolysis
in the
stratosphere
Atmospheric
increase
1.4-2.6
2.2-3.7
0.7-1.5
0.1-0.3
0.02-0.2
0.01-2.2
4.4-10.5
7
7-13
3-4.5
From
Intergovernmental
Panel
on
Climate
Change
(1990).
has
increased
by 2.5 W
m
2
since
the
preindustrial
era
(table
10.7).
The
bulk
of the
contribution
to
radiative forcing
is
from CO2, followed
by
smaller contributions from
CHj
and
other trace
gases.
For
comparison,
we
note that
the
radiative forcing
due to a
doubling
of
atmospheric
CO2 is 5 W
m~
2
and
that
the
mean
solar
flux
absorbed
by the
planet
is 240 W
m""
2
.
As we
show
in
section
10.2.4,
a
radiative forcing
of 2.5 W
m~
2
corresponds
to an
increase
in the
mean surface temperature
of
about
0.7°C,
a
value
that
is of the right
magnitude
to
explain
the
secular
increase
in
surface temperature
over
the
last century (figure
10.5).
The
computation
of the
radiative forcing involves detailed knowledge
of
molecular
spectroscopy
and
radiative transfer.
It is
surprising from
the
above discussion that
trace
Figure
I
O.I
I
Changes
in
radiative
forcing
(W
m~
2
)
due to
increases
in
greenhouse gases since
the
preindustrial
era.
After
J. T.
Houghton
et
al.,
1991, editor,
Intergovernmental Panel
on
Climate Change, 1990,
Climate
Change:
the
IPCC
Scientific
Assessment,
and
1992,
Climate
Change 1992: Supplement
to the
IPCC Scientific
Assessment
(Cambridge: Cambridge University
Press).
Earth:
Human
Impact
375
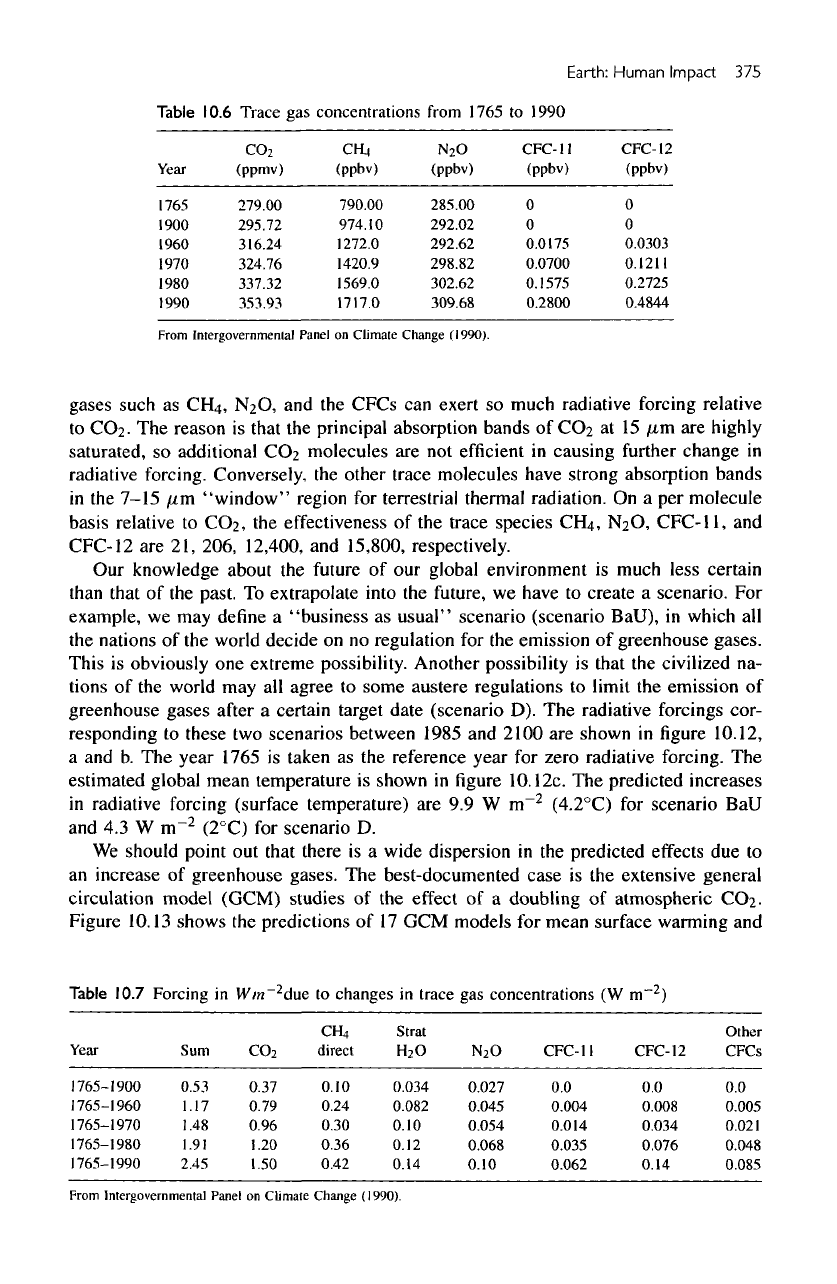
Table
10.6
Trace
gas
concentrations
from
1765
to
1990
Year
1765
1900
1960
1970
1980
1990
C0
2
(ppmv)
279.00
295.72
316.24
324.76
337.32
353.93
CR,
(ppbv)
790.00
974.10
1272.0
1420.9
1569.0
1717.0
N
2
O
(ppbv)
285.00
292.02
292.62
298.82
302.62
309.68
CFC-
1 1
(ppbv)
0
0
0.0175
0.0700
0.1575
0.2800
CFC-
12
(ppbv)
0
0
0.0303
0.1211
0.2725
0.4844
From
Intergovernmental
Panel
on
Climate Change
(1990).
gases
such
as
CH,i,
N2O,
and the
CFCs
can
exert
so
much radiative forcing relative
to
CO2-
The
reason
is
that
the
principal absorption bands
of
COa
at 15
/urn
are
highly
saturated,
so
additional
CC>2
molecules
are not
efficient
in
causing
further
change
in
radiative
forcing. Conversely,
the
other trace molecules have strong absorption bands
in
the
7-15
/urn
"window"
region
for
terrestrial thermal radiation.
On a per
molecule
basis relative
to
CC>2,
the
effectiveness
of the
trace species
CFLt,
N2O,
CFC-11,
and
CFC-12
are 21,
206,
12,400,
and
15,800,
respectively.
Our
knowledge about
the
future
of our
global environment
is
much less certain
than
that
of the
past.
To
extrapolate into
the
future,
we
have
to
create
a
scenario.
For
example,
we may
define
a
"business
as
usual"
scenario (scenario BaU),
in
which
all
the
nations
of the
world decide
on no
regulation
for the
emission
of
greenhouse
gases.
This
is
obviously
one
extreme possibility. Another possibility
is
that
the
civilized
na-
tions
of the
world
may all
agree
to
some austere regulations
to
limit
the
emission
of
greenhouse
gases
after
a
certain target date (scenario
D). The
radiative forcings cor-
responding
to
these
two
scenarios between 1985
and
2100
are
shown
in figure
10.12,
a and b. The
year 1765
is
taken
as the
reference year
for
zero radiative forcing.
The
estimated global mean temperature
is
shown
in figure
10.12c.
The
predicted increases
in
radiative forcing (surface temperature)
are 9.9 W
m~
2
(4.2°C)
for
scenario
BaU
and
4.3 W
m~
2
(2°C)
for
scenario
D.
We
should point
out
that
there
is a
wide dispersion
in the
predicted effects
due to
an
increase
of
greenhouse gases.
The
best-documented
case
is the
extensive general
circulation
model
(GCM)
studies
of the
effect
of a
doubling
of
atmospheric
CO2.
Figure
10.13
shows
the
predictions
of 17 GCM
models
for
mean surface warming
and
Table
10.7
Forcing
in
Win
2
due
to
changes
in
trace
gas
concentrations
(W
m
2
)
Year
1765-1900
1765-1960
1765-1970
1765-1980
1765-1990
Sum
0.53
1.17
1.48
1.91
2.45
C0
2
0.37
0.79
0.96
1.20
1.50
CH,
direct
0.10
0.24
0.30
0.36
0.42
Strat
H
2
O
0.034
0.082
0.10
0.12
0.14
N
2
O
0.027
0.045
0.054
0.068
0.10
CFC-
11
0.0
0.004
0.014
0.035
0.062
CFC-12
0.0
0.008
0.034
0.076
0.14
Other
CFCs
0.0
0.005
0.021
0.048
0.085
From
Intergovernmental
Panel
on
Climate Change
(1990).