Yung Y.L., DeMore W.B. Photochemistry of Planetary Atmospheres
Подождите немного. Документ загружается.

336
Photochemistry
of
Planetary
Atmospheres
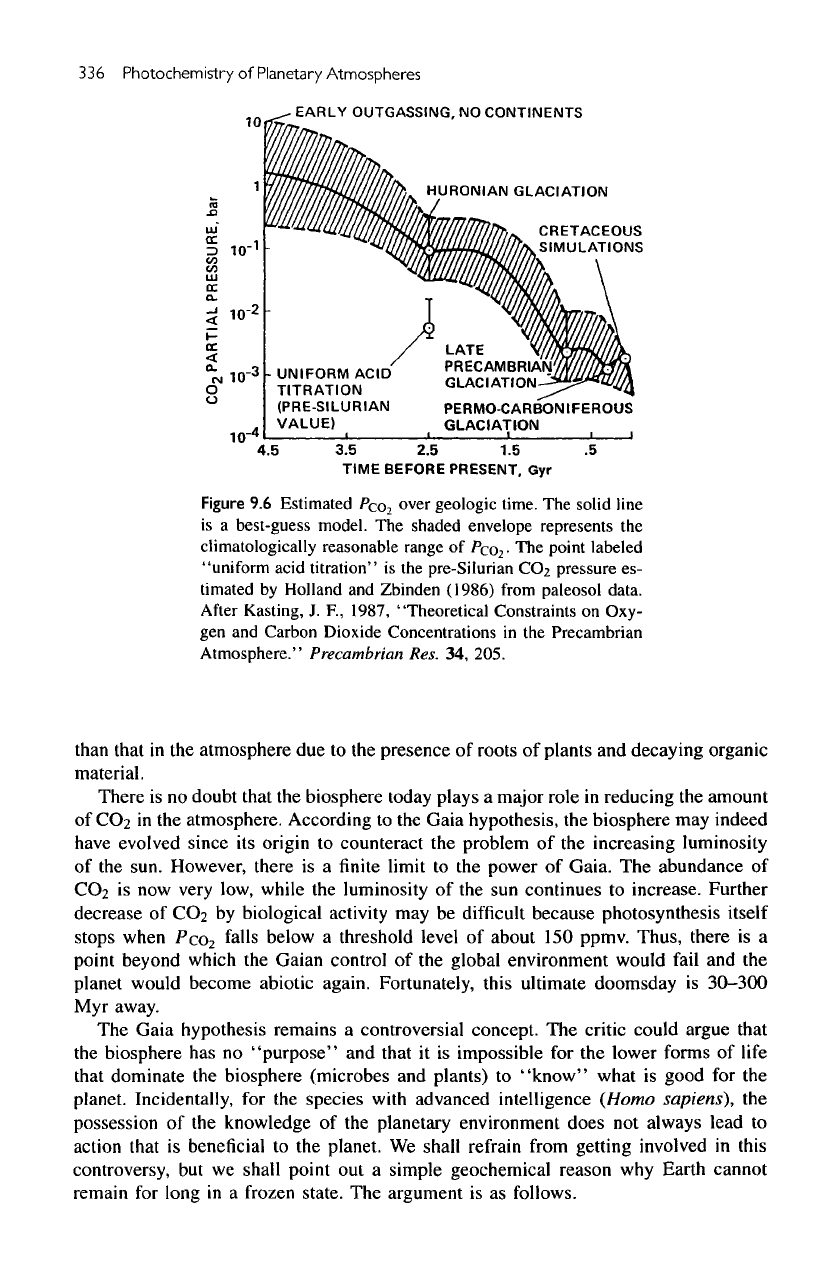
Figure
9.6
Estimated
Pco
2
over geologic
time.
The
solid
line
is
a
best-guess
model.
The
shaded
envelope
represents
the
climatologically
reasonable
range
of
Pco
2
-
The
point
labeled
"uniform
acid
titration"
is the
pre-Silurian
CO2
pressure
es-
timated
by
Holland
and
Zbinden
(1986)
from
paleosol
data.
After
(Casting,
J. F,
1987,
"Theoretical
Constraints
on
Oxy-
gen and
Carbon
Dioxide
Concentrations
in the
Precambrian
Atmosphere."
Precambrian
Res.
34,
205.
than
that
in the
atmosphere
due to the
presence
of
roots
of
plants
and
decaying organic
material.
There
is no
doubt that
the
biosphere
today
plays
a
major
role
in
reducing
the
amount
of
CC>2
in the
atmosphere. According
to the
Gaia hypothesis,
the
biosphere
may
indeed
have
evolved since
its
origin
to
counteract
the
problem
of the
increasing luminosity
of
the
sun.
However, there
is a
finite
limit
to the
power
of
Gaia.
The
abundance
of
CC>2
is now
very
low,
while
the
luminosity
of the sun
continues
to
increase. Further
decrease
of
CC»2
by
biological activity
may be
difficult
because
photosynthesis itself
stops
when
Pco
2
f
a
"
s
below
a
threshold level
of
about
150
ppmv.
Thus, there
is a
point
beyond which
the
Gaian control
of the
global environment would
fail
and the
planet would
become
abiotic again. Fortunately, this ultimate doomsday
is
30-300
Myr
away.
The
Gaia hypothesis remains
a
controversial concept.
The
critic could argue that
the
biosphere
has no
"purpose"
and
that
it is
impossible
for the
lower forms
of
life
that
dominate
the
biosphere (microbes
and
plants)
to
"know"
what
is
good
for the
planet.
Incidentally,
for the
species
with
advanced intelligence (Homo sapiens),
the
possession
of the
knowledge
of the
planetary environment
does
not
always lead
to
action
that
is
beneficial
to the
planet.
We
shall
refrain
from getting involved
in
this
controversy,
but we
shall point
out a
simple geochemical reason
why
Earth cannot
remain
for
long
in a
frozen state.
The
argument
is as
follows.
Earth:
Imprint
of
Life
337
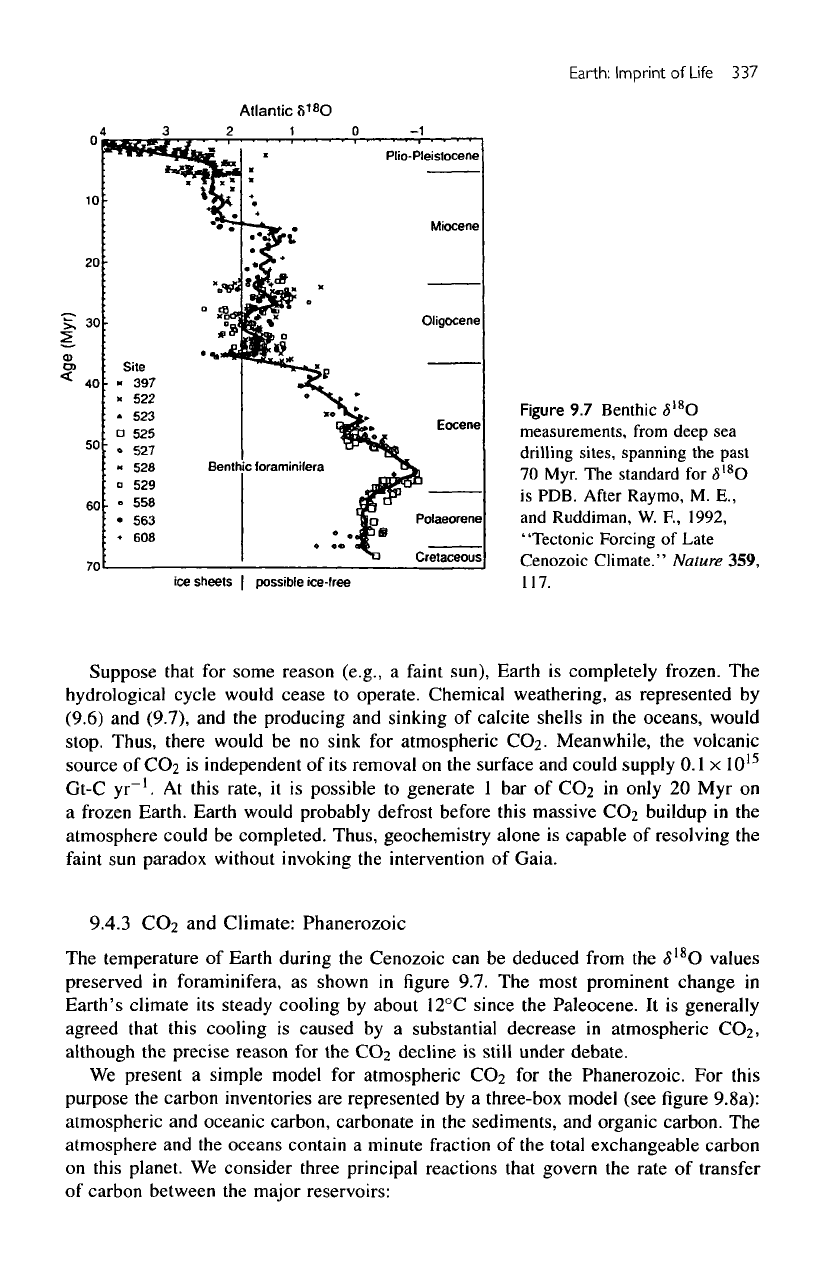
Figure
9.7
Benthic
,5
18
O
measurements,
from
deep
sea
drilling
sites,
spanning
the
past
70
Myr.
The
standard
for
5
I8
O
is
PDB.
After
Raymo,
M. E.,
and
Ruddiman,
W.
P.,
1992,
"Tectonic
Forcing
of
Late
Cenozoic Climate." Nature 359,
117.
Suppose
that
for
some reason (e.g.,
a
faint
sun), Earth
is
completely frozen.
The
hydrological
cycle would
cease
to
operate. Chemical weathering,
as
represented
by
(9.6)
and
(9.7),
and the
producing
and
sinking
of
calcite
shells
in the
oceans,
would
stop. Thus, there would
be no
sink
for
atmospheric
CO2-
Meanwhile,
the
volcanic
source
of
CC>2
is
independent
of its
removal
on the
surface
and
could supply
0.1
x
10
15
Gt-C
yr~'.
At
this
rate,
it is
possible
to
generate
1 bar of
CC-2
in
only
20 Myr on
a
frozen Earth. Earth would probably defrost before this massive
CO2
buildup
in the
atmosphere could
be
completed. Thus, geochemistry alone
is
capable
of
resolving
the
faint
sun
paradox
without
invoking
the
intervention
of
Gaia.
9.4.3
CC<2
and
Climate:
Phanerozoic
The
temperature
of
Earth during
the
Cenozoic
can be
deduced from
the
<5
18
O
values
preserved
in
foraminifera,
as
shown
in
figure
9.7.
The
most prominent change
in
Earth's climate
its
steady cooling
by
about
12°C
since
the
Paleocene.
It is
generally
agreed
that
this
cooling
is
caused
by a
substantial
decrease
in
atmospheric
CC>2,
although
the
precise
reason
for the
COa
decline
is
still under
debate.
We
present
a
simple model
for
atmospheric
CC>2
for the
Phanerozoic.
For
this
purpose
the
carbon inventories
are
represented
by a
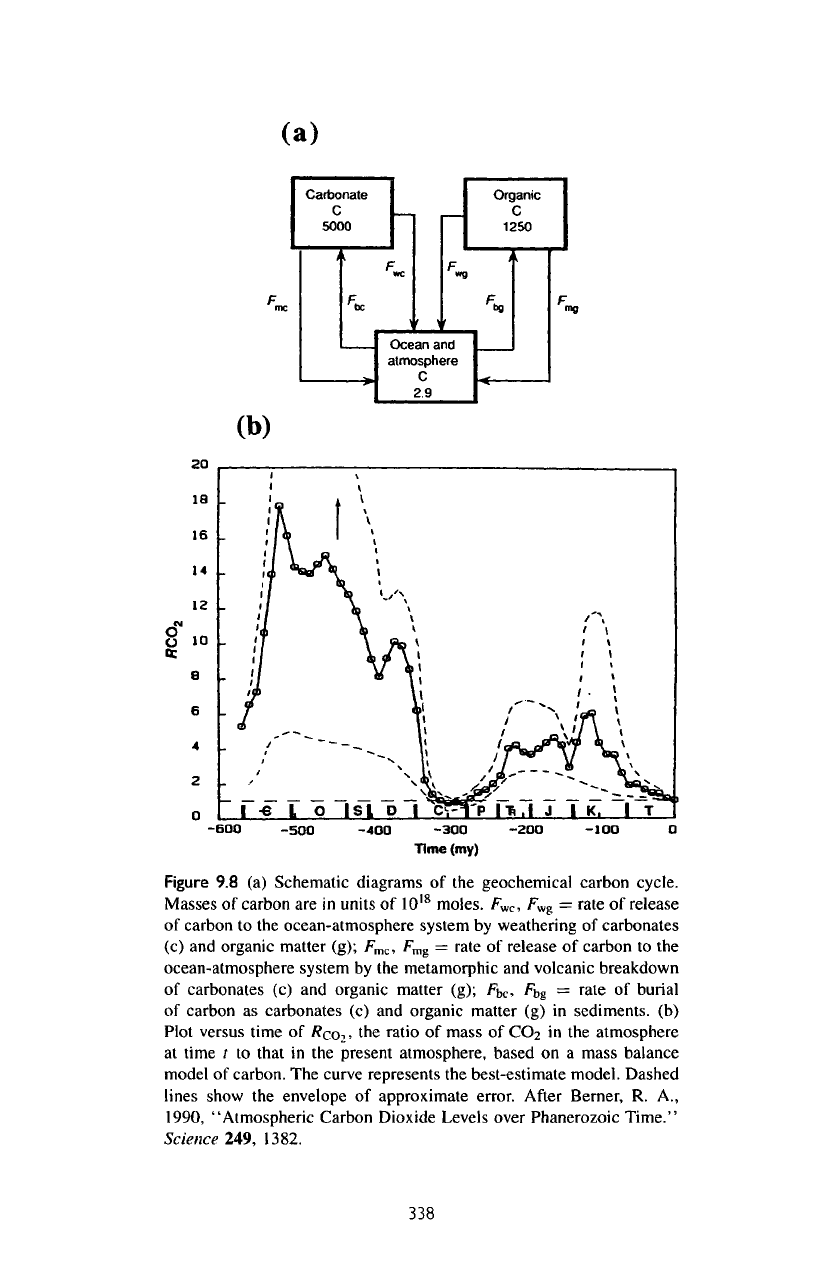
three-box model (see
figure
9.8a):
atmospheric
and
oceanic carbon, carbonate
in the
sediments,
and
organic carbon.
The
atmosphere
and the
oceans contain
a
minute
fraction
of the
total exchangeable carbon
on
this
planet.
We
consider three principal reactions that govern
the
rate
of
transfer
of
carbon between
the
major reservoirs:
(a)
(b)
Figure
9.8 (a)
Schematic diagrams
of the
geochemical
carbon cycle.
Masses
of
carbon
are in
units
of
10
18
moles.
F
wc
,
F
wg
=
rate
of
release
of
carbon
to the
ocean-atmosphere system
by
weathering
of
carbonates
(c)
and
organic matter
(g);
F
mc
,
F
mg
=
rate
of
release
of
carbon
to the
ocean-atmosphere system
by the
metamorphic
and
volcanic breakdown
of
carbonates
(c) and
organic matter
(g);
fi,c.
Fbg
—
fate
of
burial
of
carbon
as
carbonates
(c) and
organic matter
(g) in
sediments,
(b)
Plot versus time
of
/?co.>
the
ratio
of
mass
of CO2 in the
atmosphere
at
time
/
to
that
in the
present atmosphere,
based
on a
mass balance
model
of
carbon.
The
curve represents
the
best-estimate model. Dashed
lines
show
the
envelope
of
approximate error.
After
Berner,
R.
A.,
1990, "Atmospheric Carbon Dioxide Levels over Phanerozoic
Time."
Science
249, 1382.
338
Earth: Imprint
of
Life
339
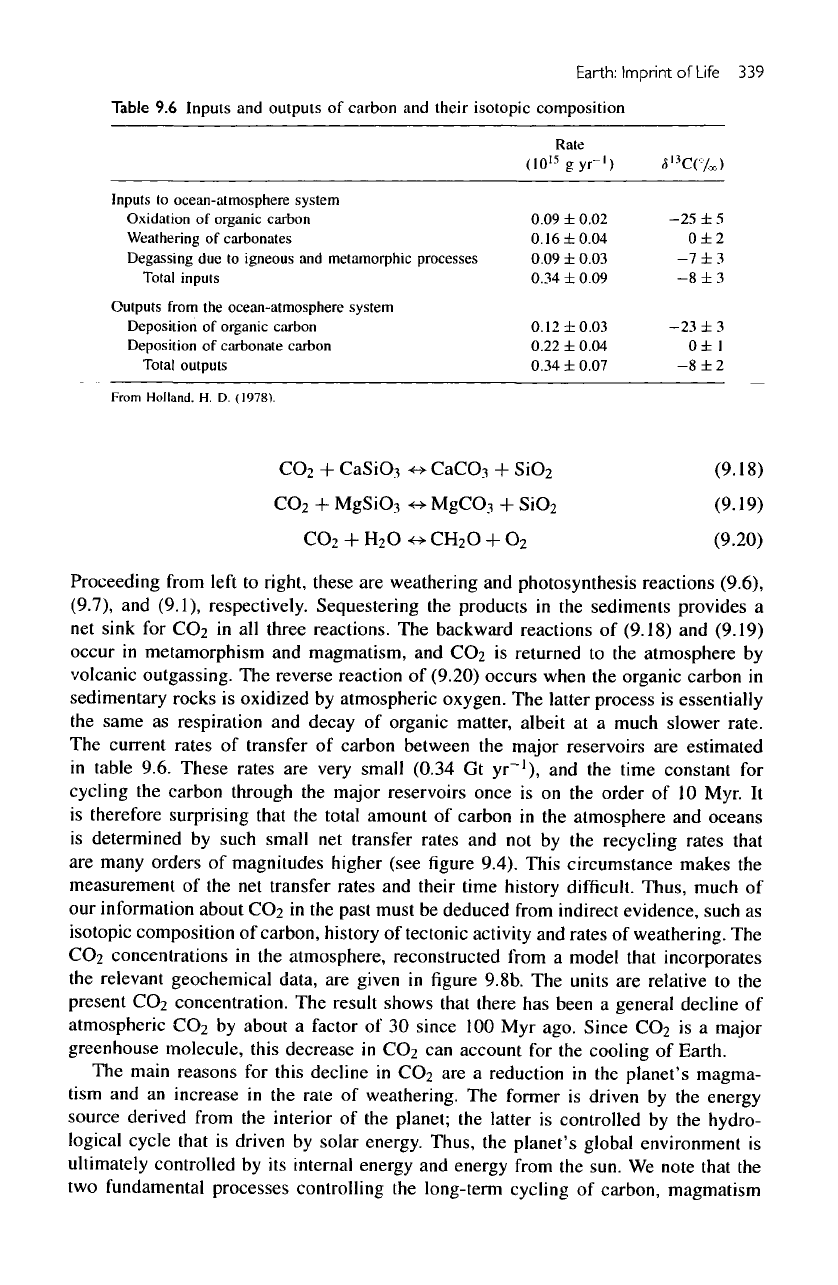
Table
9.6
Inputs
and
outputs
of
carbon
and
their isotopic composition
Rate
OO'Sgyr-')
Inputs
to
ocean-atmosphere system
Oxidation
of
organic carbon
Weathering
of
carbonates
Degassing
due to
igneous
and
metamorphic
processes
Total
inputs
Outputs
from
the
ocean-atmosphere system
Deposition
of
organic carbon
Deposition
of
carbonate carbon
Total
outputs
0.09
±
0.02
0.16
±0.04
0.09
±
0.03
0.34
±
0.09
0.12
±0.03
0.22
±0.04
0.34
±
0.07
-25 ± 5
0±2
-7 ±3
-8 ±3
-23 ± 3
0±
1
-8 ±2
From
Holland.
H. D.
(1978).
Proceeding from
left
to
right,
these
are
weathering
and
photosynthesis reactions
(9.6),
(9.7),
and
(9.1),
respectively. Sequestering
the
products
in the
sediments provides
a
net
sink
for
CO
2
in all
three reactions.
The
backward reactions
of
(9.18)
and
(9.19)
occur
in
metamorphism
and
magmatism,
and
CO
2
is
returned
to the
atmosphere
by
volcanic outgassing.
The
reverse reaction
of
(9.20)
occurs when
the
organic carbon
in
sedimentary
rocks
is
oxidized
by
atmospheric oxygen.
The
latter
process
is
essentially
the
same
as
respiration
and
decay
of
organic matter, albeit
at a
much slower rate.
The
current rates
of
transfer
of
carbon between
the
major reservoirs
are
estimated
in
table 9.6.
These
rates
are
very small (0.34
Gt
yr~'),
and the
time constant
for
cycling
the
carbon through
the
major reservoirs once
is on the
order
of 10
Myr.
It
is
therefore surprising
that
the
total amount
of
carbon
in the
atmosphere
and
oceans
is
determined
by
such small
net
transfer rates
and not by the
recycling rates that
are
many
orders
of
magnitudes higher (see
figure
9.4).
This
circumstance
makes
the
measurement
of the net
transfer rates
and
their time history
difficult.
Thus, much
of
our
information about
CO
2
in the
past must
be
deduced from indirect evidence, such
as
isotopic composition
of
carbon, history
of
tectonic
activity
and
rates
of
weathering.
The
CO
2
concentrations
in the
atmosphere, reconstructed from
a
model
that
incorporates
the
relevant
geochemical
data,
are
given
in figure
9.8b.
The
units
are
relative
to the
present
CO
2
concentration.
The
result shows that there
has
been
a
general decline
of
atmospheric
CO
2
by
about
a
factor
of 30
since
100 Myr
ago. Since
CO
2
is a
major
greenhouse molecule, this
decrease
in
CO
2
can
account
for the
cooling
of
Earth.
The
main reasons
for
this decline
in
CO
2
are a
reduction
in the
planet's magma-
tism
and an
increase
in the
rate
of
weathering.
The
former
is
driven
by the
energy
source derived from
the
interior
of the
planet;
the
latter
is
controlled
by the
hydro-
logical cycle
that
is
driven
by
solar energy. Thus,
the
planet's global environment
is
ultimately
controlled
by its
internal
energy
and
energy from
the
sun.
We
note that
the
two
fundamental
processes
controlling
the
long-term cycling
of
carbon, magmatism
340
Photochemistry
of
Planetary
Atmospheres
and
weathering,
are
independent.
Is
there
any
feedback mechanism
that
can
prevent
the
system from extreme
fluctuations
in
PCO?
The
possibility
of a
feedback mechanism
seems
to lie in the
weathering portion
of the
cycle. Weathering
is
affected
by
temper-
ature,
rain, plants,
and
topography.
For
instance,
a
higher
Pco
2
results
in a
warmer
climate
with
more vegetation, which increases
the
rate
of
weathering
and
removes
COi
from
the
atmosphere, resulting
in a
negative feedback. Enhanced
magmatism
(source
of
CO?)
could lead
to
mountain
building;
the
resulting
steeper topography increases
the
rate
of
physical weathering and, consequently,
the
rate
of
chemical weathering
(sink
of
CC>2).
There
are
major uncertainties
in our
present understanding
of the
con-
trols
and
feedbacks
in the
regulation
of
atmospheric
CC>2.
Some
biological feedbacks
may be
attributed
to
Gaian
homeorrhesis,
but
proof
of
this
appears
to be
difficult.
9.4.4
CO:
and
Climate:
Pleistocene
and
Pliocene
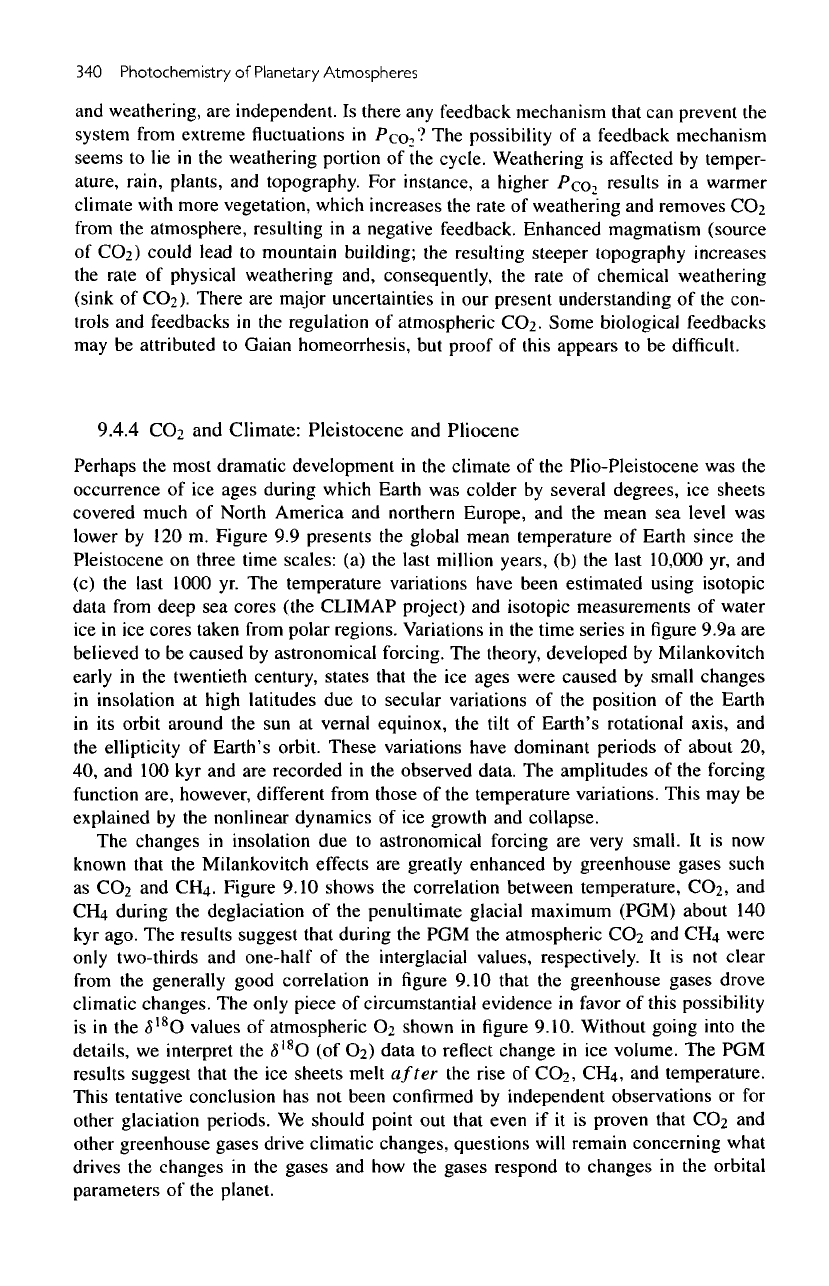
Perhaps
the
most dramatic development
in the
climate
of the
Plio-Pleistocene
was the
occurrence
of ice
ages
during which Earth
was
colder
by
several degrees,
ice
sheets
covered much
of
North America
and
northern Europe,
and the
mean
sea
level
was
lower
by 120 m.
Figure
9.9
presents
the
global mean temperature
of
Earth since
the
Pleistocene
on
three time
scales:
(a) the
last million years,
(b) the
last
10,000
yr, and
(c) the
last 1000
yr. The
temperature variations have been estimated using isotopic
data from
deep
sea
cores
(the
CLIMAP
project)
and
isotopic measurements
of
water
ice in ice
cores
taken from polar regions. Variations
in the
time
series
in figure
9.9a
are
believed
to be
caused
by
astronomical forcing.
The
theory, developed
by
Milankovitch
early
in the
twentieth century, states that
the ice
ages
were
caused
by
small changes
in
insolation
at
high latitudes
due to
secular variations
of the
position
of the
Earth
in
its
orbit around
the sun at
vernal equinox,
the
tilt
of
Earth's rotational axis,
and
the
ellipticity
of
Earth's orbit.
These
variations have dominant
periods
of
about
20,
40, and 100 kyr and are
recorded
in the
observed data.
The
amplitudes
of the
forcing
function
are, however,
different
from those
of the
temperature variations. This
may be
explained
by the
nonlinear dynamics
of ice
growth
and
collapse.
The
changes
in
insolation
due to
astronomical forcing
are
very small.
It is now
known
that
the
Milankovitch effects
are
greatly enhanced
by
greenhouse
gases
such
as
CC>2
and
CH
4
.
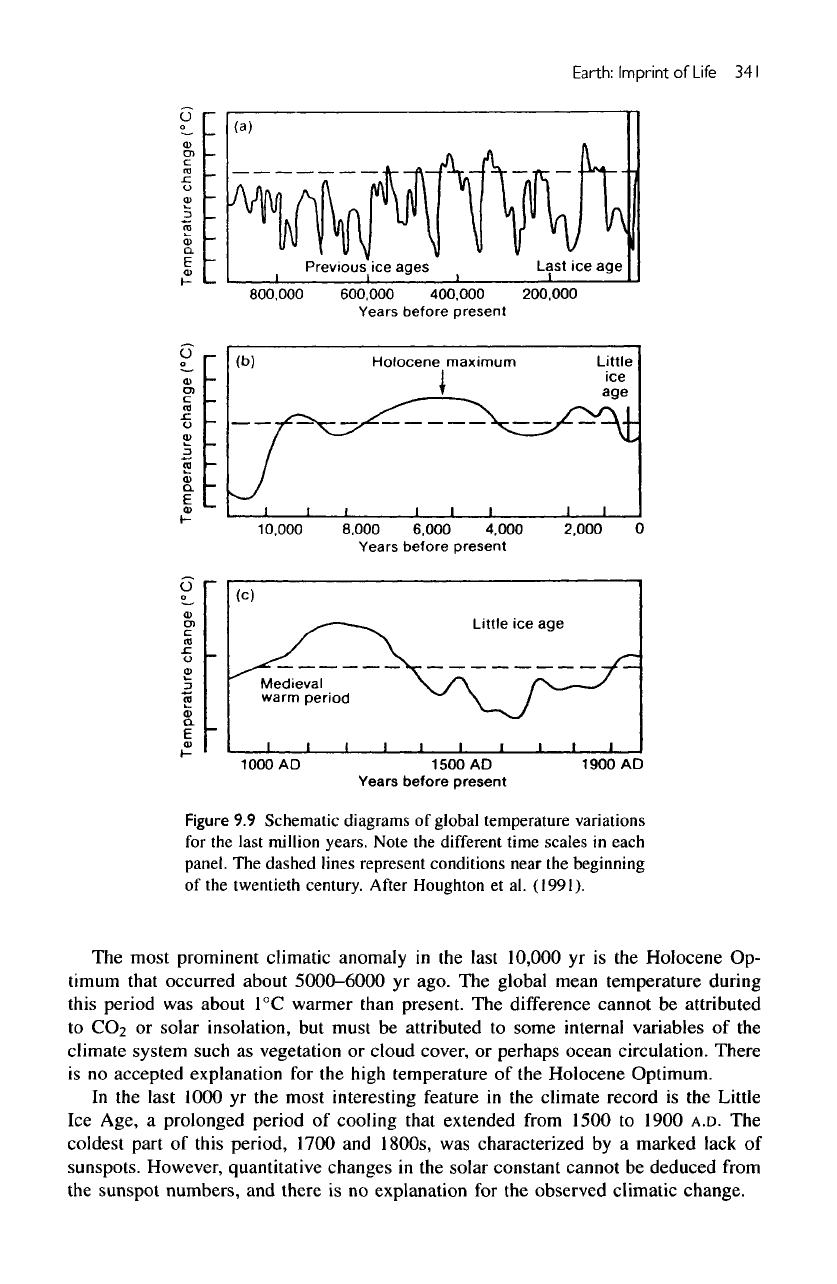
Figure 9.10 shows
the
correlation between temperature,
CO:,
and
CH4
during
the
deglaciation
of the
penultimate glacial maximum (PGM) about
140
kyr
ago.
The
results suggest that during
the PGM the
atmospheric
CO2 and CH4
were
only
two-thirds
and
one-half
of the
interglacial values, respectively.
It is not
clear
from
the
generally
good
correlation
in
figure
9.10 that
the
greenhouse
gases
drove
climatic
changes.
The
only
piece
of
circumstantial evidence
in
favor
of
this possibility
is
in the
<5
18
O
values
of
atmospheric
O:
shown
in figure
9.10.
Without going into
the
details,
we
interpret
the
<5
I8
O
(of
©2)
data
to
reflect change
in ice
volume.
The PGM
results
suggest that
the ice
sheets
melt
after
the
rise
of
CO?,
CI-Lt,
and
temperature.
This tentative conclusion
has not
been confirmed
by
independent observations
or for
other glaciation periods.
We
should point
out
that even
if it is
proven that
CO:
and
other greenhouse
gases
drive climatic changes, questions
will
remain concerning what
drives
the
changes
in the
gases
and how the
gases
respond
to
changes
in the
orbital
parameters
of the
planet.
Earth:
Imprint
of
Life
341
Figure
9.9
Schematic
diagrams
of
global
temperature variations
for
the
last million
years.
Note
the
different time
scales
in
each
panel.
The
dashed lines represent conditions near
the
beginning
of
the
twentieth century. After Houghton
et
al.
(1991).
The
most prominent climatic anomaly
in the
last
10,000
yr is the
Holocene
Op-
timum
that
occurred about
5000-6000
yr
ago.
The
global mean temperature during
this
period
was
about
1°C
warmer
than
present.
The
difference cannot
be
attributed
to CO2 or
solar insolation,
but
must
be
attributed
to
some
internal variables
of the
climate system such
as
vegetation
or
cloud cover,
or
perhaps
ocean
circulation.
There
is
no
accepted explanation
for the
high
temperature
of the
Holocene Optimum.
In
the
last 1000
yr the
most interesting feature
in the
climate
record
is the
Little
Ice
Age,
a
prolonged period
of
cooling that extended from 1500
to
1900
A.D.
The
coldest part
of
this period, 1700
and
1800s,
was
characterized
by a
marked lack
of
sunspots. However,
quantitative
changes
in the
solar constant cannot
be
deduced from
the
sunspot numbers,
and
there
is no
explanation
for the
observed climatic change.
342
Photochemistry
of
Planetary
Atmospheres
Figure
9.10
Changes
in
atmospheric
CH
4
,
temperature,
CO
2
,
and
6
18
O
of
atmospheric
oxygen from
the
Vostok
ice
core
during
the
penultimate
deglaciation. After Raynaud,
D.,
et
al.,
1993, "The
Ice
Record
of
Greenland
Gases."
Science
259, 926.
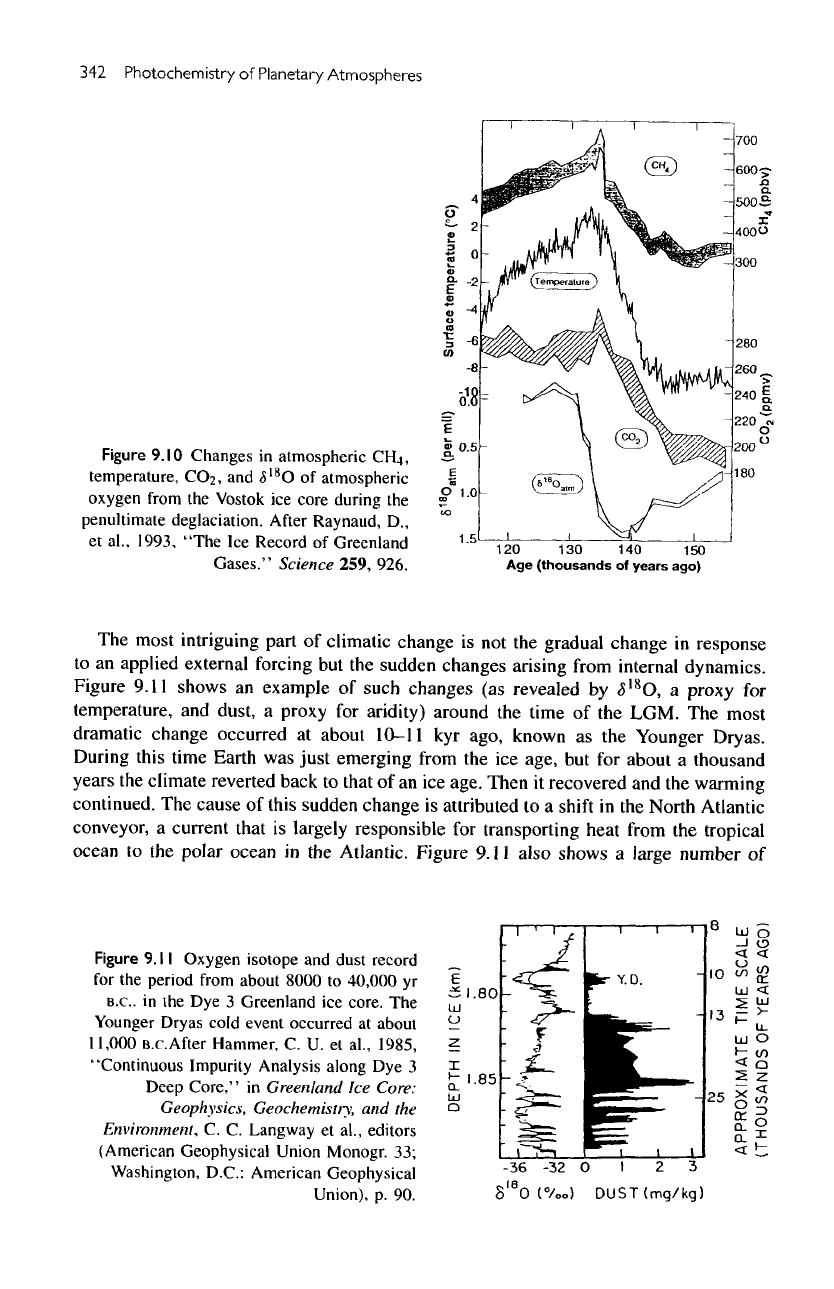
The
most
intriguing
part
of
climatic change
is not the
gradual change
in
response
to an
applied external forcing
but the
sudden changes arising from internal dynamics.
Figure
9.11
shows
an
example
of
such
changes
(as
revealed
by
5
18
O,
a
proxy
for
temperature,
and
dust,
a
proxy
for
aridity) around
the
time
of the
LGM.
The
most
dramatic change occurred
at
about
10-11
kyr
ago, known
as the
Younger
Dryas.
During
this
time Earth
was
just emerging from
the ice
age,
but for
about
a
thousand
years
the
climate reverted back
to
that
of an ice
age. Then
it
recovered
and the
warming
continued.
The
cause
of
this sudden change
is
attributed
to a
shift
in the
North Atlantic
conveyor,
a
current that
is
largely responsible
for
transporting heat from
the
tropical
ocean
to the
polar
ocean
in the
Atlantic. Figure
9.11
also
shows
a
large
number
of
Figure
9.11
Oxygen
isotope
and
dust
record
for
the
period from about
8000
to
40,000
yr
B.C..
in the Dye 3
Greenland
ice
core.
The
Younger Dryas
cold
event
occurred
at
about
11,000
B.c.After
Hammer,
C. U. et
al.,
1985,
"Continuous Impurity Analysis along
Dye 3
Deep
Core,"
in
Greenland
Ice
Core:
Geophysics,
Geochemistiy,
and the
Environment,
C. C.
Langway
et
al.,
editors
(American
Geophysical Union
Monogr.
33;
Washington,
D.C.: American Geophysical
Union),
p. 90.
Earth:
Imprint
of
Life
343
rapid
climate oscillations during
the ice
age.
These
events
are
known
as
Dansgaard-
Oeschger
events.
The
cause
of
these rapid "quantum
jumps"
in the
climate system
is
not
completely understood.
We may
note
the
occurrence
of
greatly enhanced amounts
of
dust during
the ice
age. Dust
is
characteristic
of
cold, windy,
and
arid environments.
It
is not
known whether dust
is a
diagnostic
of the
climatic conditions
or if it had an
active
role
in
inducing
climatic change.
In
addition
to
Milankovitch forcing, variations
in
greenhouse
gases,
and
possible
secular changes
in the
solar
constant,
we
must include volcanic eruptions
as a
possible
trigger
for
climate changes.
A
major volcanic eruption
has
immediate impact
on the
radiation
budget
of the
planet
via the
dust cloud raised
in the
atmosphere. This effect,
however,
is
local
and
short-lived
and
will
dissipate
in a
week.
The
greater
and
sustained
impact
comes
from
the
small amount
of
SOi
injected into
the
stratosphere, where
the
SO?
is
converted
to
sulfuric
acid aerosols.
These
aerosols
can
stay
in the
upper
atmosphere
for up to 2 yr and can
profoundly alter Earth's albedo.
There
are
well-
documented perturbations
of
Earth's climate after
the
eruptions
of
Krakatoa,
Agung,
St.
Helens,
El
Chichon,
and
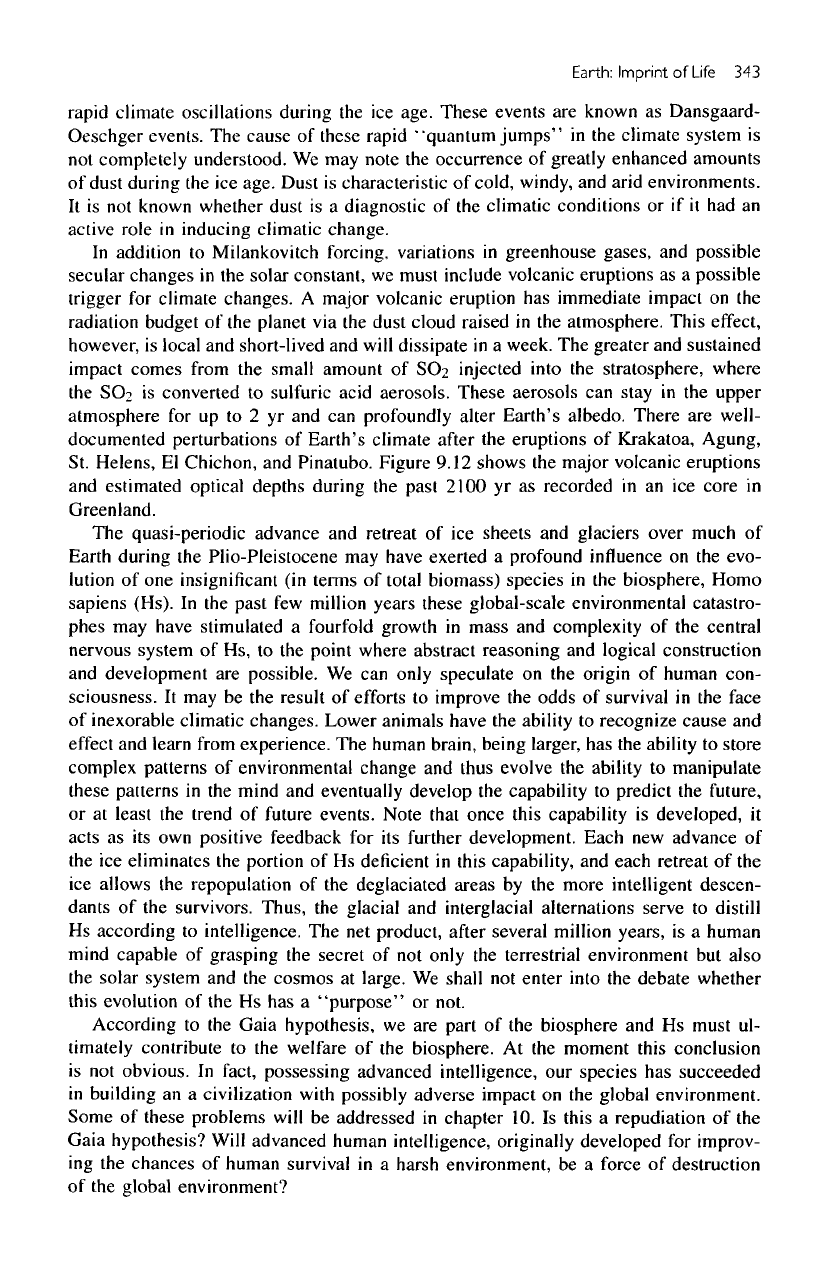
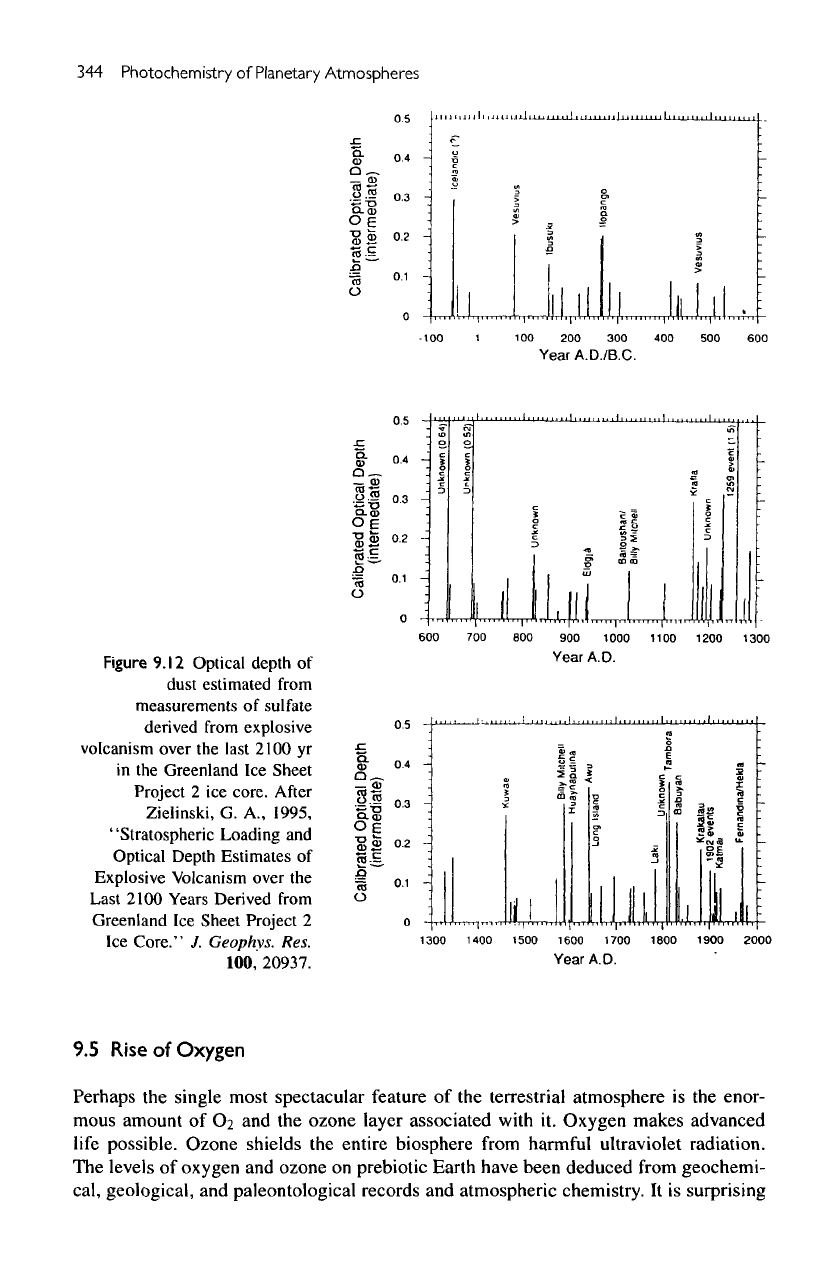
Pinatubo. Figure
9.12
shows
the
major volcanic eruptions
and
estimated optical depths during
the
past 2100
yr as
recorded
in an ice
core
in
Greenland.
The
quasi-periodic advance
and
retreat
of ice
sheets
and
glaciers over much
of
Earth
during
the
Plio-Pleistocene
may
have exerted
a
profound
influence
on the
evo-
lution
of one
insignificant
(in
terms
of
total
biomass)
species
in the
biosphere,
Homo
sapiens (Hs).
In the
past
few
million years these global-scale environmental catastro-
phes
may
have stimulated
a
fourfold growth
in
mass
and
complexity
of the
central
nervous system
of Hs, to the
point where abstract reasoning
and
logical construction
and
development
are
possible.
We can
only speculate
on the
origin
of
human con-
sciousness.
It may be the
result
of
efforts
to
improve
the
odds
of
survival
in the
face
of
inexorable climatic changes.
Lower
animals have
the
ability
to
recognize
cause
and
effect
and
learn from experience.
The
human brain, being larger,
has the
ability
to
store
complex patterns
of
environmental change
and
thus evolve
the
ability
to
manipulate
these patterns
in the
mind
and
eventually develop
the
capability
to
predict
the
future,
or at
least
the
trend
of
future
events. Note that once this capability
is
developed,
it
acts
as its own
positive feedback
for its
further
development.
Each
new
advance
of
the
ice
eliminates
the
portion
of Hs
deficient
in
this capability,
and
each retreat
of the
ice
allows
the
repopulation
of the
deglaciated
areas
by the
more intelligent
descen-
dants
of the
survivors. Thus,
the
glacial
and
interglacial alternations serve
to
distill
Hs
according
to
intelligence.
The net
product, after several million
years,
is a
human
mind
capable
of
grasping
the
secret
of not
only
the
terrestrial environment
but
also
the
solar system
and the
cosmos
at
large.
We
shall
not
enter into
the
debate whether
this
evolution
of the Hs has a
"purpose"
or
not.
According
to the
Gaia hypothesis,
we are
part
of the
biosphere
and Hs
must
ul-
timately
contribute
to the
welfare
of the
biosphere.
At the
moment this conclusion
is
not
obvious.
In
fact,
possessing
advanced intelligence,
our
species
has
succeeded
in
building
an a
civilization
with possibly adverse impact
on the
global environment.
Some
of
these problems
will
be
addressed
in
chapter
10. Is
this
a
repudiation
of the
Gaia hypothesis? Will advanced human intelligence, originally developed
for
improv-
ing
the
chances
of
human survival
in a
harsh environment,
be a
force
of
destruction
of the
global environment?
344
Photochemistry
of
Planetary
Atmospheres
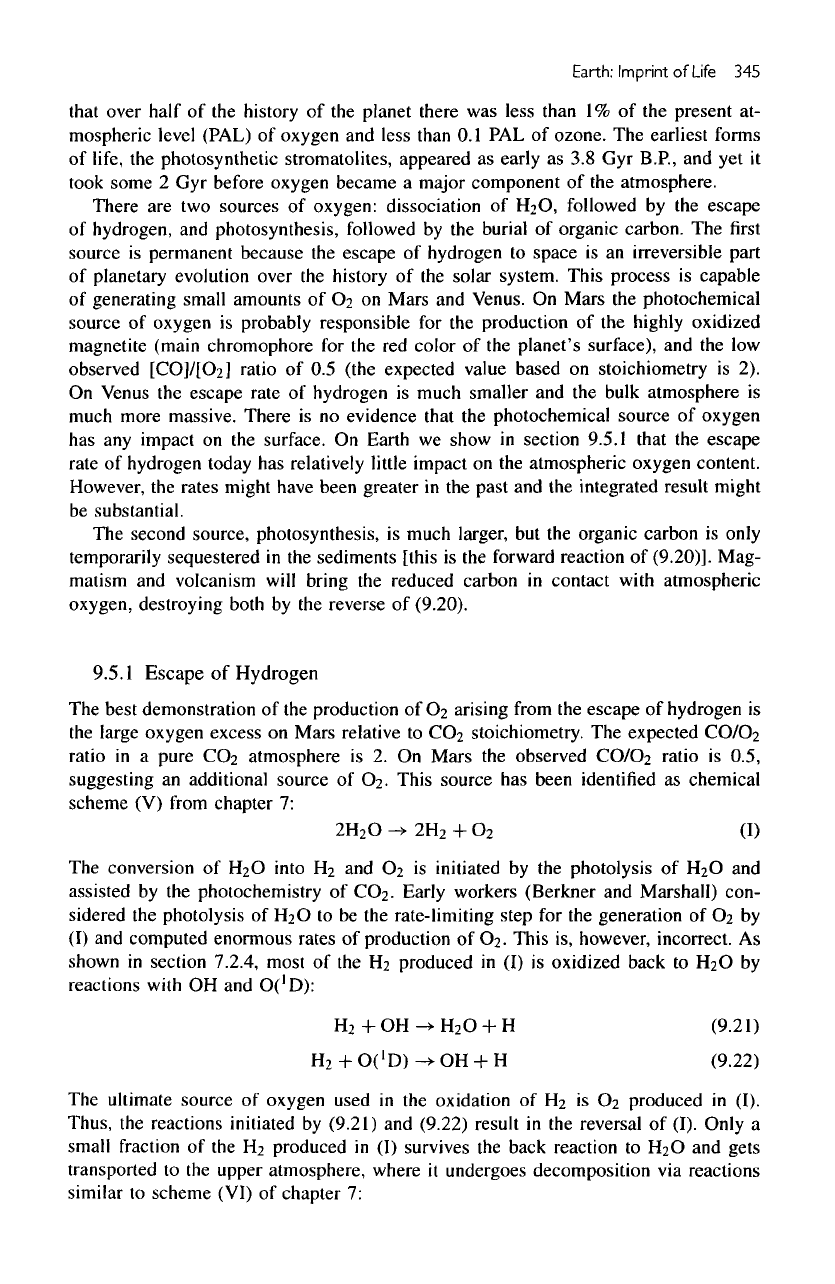
Figure
9.12
Optical
depth
of
dust
estimated
from
measurements
of
sulfate
derived
from
explosive
volcanism
over
the
last
2100
yr
in
the
Greenland
Ice
Sheet
Project
2 ice
core.
After
Zielinski,
G.
A.,
1995,
"Stratospheric Loading
and
Optical Depth Estimates
of
Explosive
Volcanism over
the
Last
2100 Years Derived
from
Greenland
Ice
Sheet Project
2
Ice
Core."
J.
Geophvs.
Res.
100,
20937.
9.5
Rise
of
Oxygen
Perhaps
the
single most spectacular feature
of the
terrestrial atmosphere
is the
enor-
mous amount
of
C>2
and the
ozone
layer
associated
with
it.
Oxygen makes advanced
life
possible.
Ozone
shields
the
entire biosphere from harmful ultraviolet radiation.
The
levels
of
oxygen
and
ozone
on
prebiotic Earth have
been
deduced
from geochemi-
cal,
geological,
and
paleontological
records
and
atmospheric chemistry.
It is
surprising
Earth:
Imprint
of
Life
345
that
over
half
of the
history
of the
planet there
was
less
than
1% of the
present
at-
mospheric level (PAL)
of
oxygen
and
less
than
0.1
PAL of
ozone.
The
earliest forms
of
life,
the
photosynthetic
stromatolites, appeared
as
early
as 3.8 Gyr
B.P.,
and yet it
took
some
2 Gyr
before oxygen became
a
major component
of the
atmosphere.
There
are two
sources
of
oxygen: dissociation
of
HiO,
followed
by the
escape
of
hydrogen,
and
photosynthesis, followed
by the
burial
of
organic carbon.
The first
source
is
permanent because
the
escape
of
hydrogen
to
space
is an
irreversible part
of
planetary evolution over
the
history
of the
solar system. This
process
is
capable
of
generating small amounts
of
C>2
on
Mars
and
Venus.
On
Mars
the
photochemical
source
of
oxygen
is
probably responsible
for the
production
of the
highly
oxidized
magnetite
(main
chromophore
for the red
color
of the
planet's surface),
and the low
observed
[CO]/[C>2]
ratio
of 0.5
(the
expected value
based
on
stoichiometry
is 2).
On
Venus
the
escape rate
of
hydrogen
is
much smaller
and the
bulk
atmosphere
is
much
more massive. There
is no
evidence
that
the
photochemical source
of
oxygen
has any
impact
on the
surface.
On
Earth
we
show
in
section
9.5.1
that
the
escape
rate
of
hydrogen today
has
relatively
little
impact
on the
atmospheric oxygen content.
However,
the
rates might have been greater
in the
past
and the
integrated result might
be
substantial.
The
second source, photosynthesis,
is
much larger,
but the
organic carbon
is
only
temporarily
sequestered
in the
sediments
[this
is the
forward reaction
of
(9.20)].
Mag-
matism
and
volcanism
will
bring
the
reduced carbon
in
contact
with
atmospheric
oxygen,
destroying both
by the
reverse
of
(9.20).
9.5.1
Escape
of
Hydrogen
The
best demonstration
of the
production
of
©2
arising from
the
escape
of
hydrogen
is
the
large oxygen excess
on
Mars relative
to CO2
stoichiometry.
The
expected CO/O2
ratio
in a
pure
CO2
atmosphere
is 2. On
Mars
the
observed CO/O2 ratio
is
0.5,
suggesting
an
additional source
of
O
2
.
This source
has
been
identified
as
chemical
scheme
(V)
from
chapter
7:
The
conversion
of H2O
into
H2 and
©2
is
initiated
by the
photolysis
of H2O and
assisted
by the
photochemistry
of
CO2. Early workers
(Berkner
and
Marshall)
con-
sidered
the
photolysis
of
F^O
to be the
rate-limiting step
for the
generation
of O2 by
(I)
and
computed enormous rates
of
production
of O2.
This
is,
however, incorrect.
As
shown
in
section
7.2.4,
most
of the H2
produced
in (I) is
oxidized back
to
F^O
by
reactions
with
OH and
O('D):
The
ultimate
source
of
oxygen used
in the
oxidation
of
H
2
is O2
produced
in
(I).
Thus,
the
reactions
initiated
by
(9.21)
and
(9.22)
result
in the
reversal
of
(I).
Only
a
small
fraction
of the H2
produced
in (I)
survives
the
back reaction
to
H
2
O
and
gets
transported
to the
upper atmosphere, where
it
undergoes decomposition
via
reactions
similar
to
scheme (VI)
of
chapter
7: