Xin Q. Diesel Engine System Design
Подождите немного. Документ загружается.

256 Diesel engine system design
© Woodhead Publishing Limited, 2011
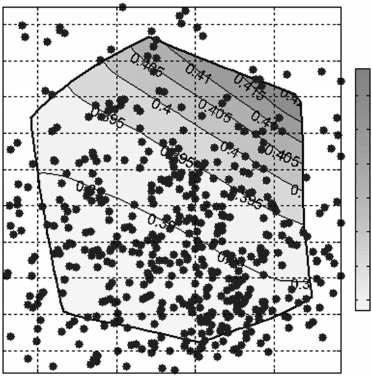
domain, which is represented by ‘air–fuel ratio vs. EGR rate’ (Fig. 3.18).
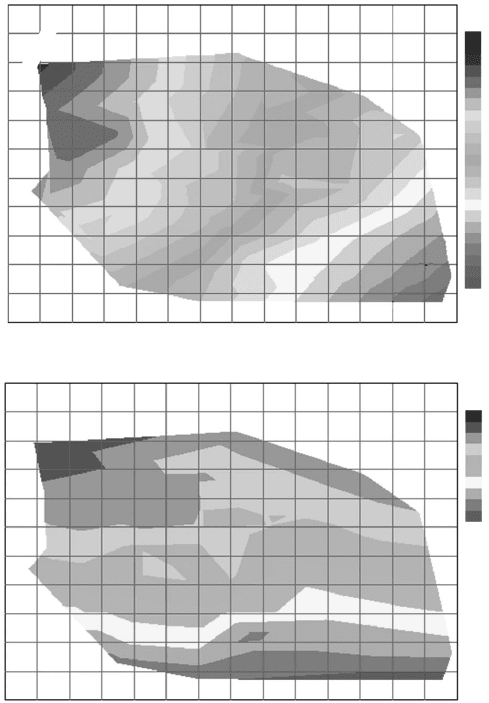
Figure 3.19 shows the DoE raw data of coolant heat rejection and BSFC
plotted in the response domain without using the emulators or optimization.
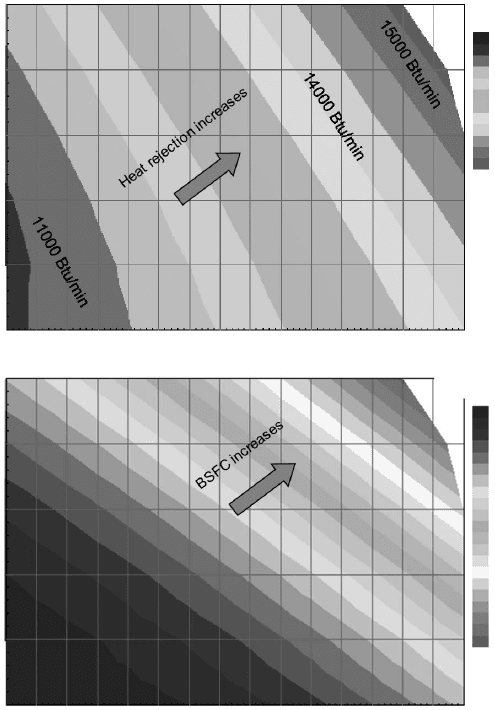
Figure 3.20 shows the optimized coolant heat rejection (in the sense of
minimum BSFC) and BSFC by using the emulators. It is observed that Figs
3.19 and 3.20 give totally different data trends in heat rejection and BSFC. It
shows that without optimization the raw DoE data can be misleading in the
data trend because the factor settings used in a DoE matrix do not guarantee
any trend in the raw data. The DoE factors used in this example include
fuel injection timing, EGR valve opening, VGT vane opening, turbocharger
efciency, EGR cooler size, and charge air cooler size. This example shows
the importance of using DoE emulator to process the DoE raw data and
conduct optimization.
The information on parametric sensitivity of system response, generated
either analytically or graphically, is often even more valuable than a single
set of estimated optimum solutions. The theoretical advantages of ridge
analysis, canonical eigenvalues, and the technique of optimum contour map
can be combined in the future to generate a more powerful analysis tool for
the RSM DoE design, optimization, and data display. This is an important
research direction for optimization in diesel engine system design.
BSFC (lb/(hp.hr))
20 25 30 35
EGR rate (%)
A/F ratio (–)
26
25
24
23
22
21
20
19
18
17
0.42
0.415
0.41
0.405
0.4
0.395
0.39
3.18 Illustration of raw DoE data and minimum BSFC optimization
contours.
Diesel-Xin-03.indd 256 5/5/11 11:46:06 AM
257Optimization techniques in diesel engine system design
© Woodhead Publishing Limited, 2011
3.3 Advanced design of experiments (DoE)
optimization in engine system design
3.3.1 Engine optimization with the Taguchi method
There are numerous studies using the Taguchi method in engine design and
testing applications. The engine performance related design and calibration
work is reviewed here. Baranescu et al. (1989) from Navistar used the
Taguchi method and engine cycle simulation to analyze the effects of control
factors and noise factors on diesel engine power. The analysis started with
the cause-and-effect ‘shbone’ diagram to brainstorm design factors. Five
Engine coolant heat rejection
BSFC (lb/(hp.hr))
10000 Btu/min
15.0 16.0 17.0 18.0 19.0 20.0 21.0 22.0 23.0 24.0 25.0 26.0 27.0 28.0 29.0
EGR rate (%)
15.0 16.0 17.0 18.0 19.0 20.0 21.0 22.0 23.0 24.0 25.0 26.0 27.0 28.0 29.0
EGR rate (%)
A/F ratio
A/F ratio
27.0
26.0
25.0
24.0
23.0
22.0
21.0
20.0
19.0
18.0
17.0
16.0
27.0
26.0
25.0
24.0
23.0
22.0
21.0
20.0
19.0
18.0
17.0
16.0
MAX: 14203
MIN: 10318
MAX: 0.423
MIN: 0.380
Coolant heat
rejection (Btu/min)
10000
10200
10400
10600
10800
11000
11200
11400
11600
11800
12000
12200
12400
12600
12800
13000
13200
13400
13600
13800
14000
14200
14400
14600
BSFC
(lb/(hp.hr))
0.375
0.380
0.385
0.390
0.395
0.400
0.405
0.410
0.415
0.420
0.425
3.19 Raw DoE output data in response domain without optimization.
14000 Btu/min
Diesel-Xin-03.indd 257 5/5/11 11:46:07 AM
258 Diesel engine system design
© Woodhead Publishing Limited, 2011
control factors (turbocharger build, intake ow area, exhaust ow area, intake
cam, and exhaust cam) and four noise factors (ambient temperature, engine
compression ratio, injection timing, and fueling rate) were selected. Most
factors were set at three levels. They used an inner array for the control
factors and an outer array for the noise factors. The signal-to-noise ratio of
engine power was evaluated along with the mean value of engine power. They
used the main effect plot to identify strong factors and weak factors. The
interaction effect of two control factors, turbocharger build and intake ow
Optimized engine coolant heat rejection in the A/F ratio vs. EGR rate domain
at 3300 rpm rated power, optimization to minimize BSFC with the constraints
of fixed compressor efficiency 72%, turbine efficiency 65%, EGR cooler
effectiveness 80%, and CAC effectiveness 90%
15.0 16.0 17.0 18.0 19.0 20.0 21.0 22.0 23.0 24.0 25.0 26.0 27.0 28.0 29.0 30.0
EGR rate (%)
15.0 16.0 17.0 18.0 19.0 20.0 21.0 22.0 23.0 24.0 25.0 26.0 27.0 28.0 29.0 30.0
EGR rate (%)
A/F ratio
A/F ratio
25.0
24.0
23.0
22.0
21.0
20.0
25.0
24.0
23.0
22.0
21.0
20.0
MAX: 15697
MIN: 10873
MAX: 0.232
MIN: 0.034
Coolant heat
rejection (BTU/min)
10000
10500
11000
11500
12000
12500
13000
13500
14000
14500
15000
15500
16000
0.030
0.040
0.050
0.060
0.070
0.080
0.090
0.100
0.110
0.120
0.130
0.140
0.150
0.160
0.170
0.180
0.190
0.200
0.210
0.220
0.230
0.240
BSFC penalty over
a baseline engine
3.20 Optimized DoE output data in response domain by using RSM
emulators.
Diesel-Xin-03.indd 258 5/5/11 11:46:07 AM
259Optimization techniques in diesel engine system design
© Woodhead Publishing Limited, 2011
area, was considered when a proper inner array L
18
was selected. Possible
trade-offs between the mean value and the signal-to-noise ratio of the engine
power were pointed out and demonstrated by using their main effect plots
side-by-side as a multi-objective optimization. Optimum control factor levels
were selected for the best power (i.e., large mean) and robustness (i.e., large
signal-to-noise ratio). The ANOVA study of the signal-to-noise ratio was
provided including the interaction effect between the control factors. An
estimate of cost savings due to the optimized design was also provided. This
work is an important pioneering analysis of using the Taguchi DoE method
on engine performance. It applied many important concepts of robust design
and optimization in engine simulation applications.
Another important optimization work on diesel combustion and transient
emissions using the Taguchi DoE method combined with the Monte Carlo
simulation was reported by Navistar’s Yan et al. (1993). Four important
concepts were introduced to the area of optimization of diesel engine emissions
and performance. They are: (1) measured signal-to-noise ratio for each DoE
run; (2) transient optimization; (3) multi-objective optimization for multiple
combustion parameters (PM, NO
x
, HC, INSOL, SOF, and CBSFC); and (4)
probability distribution sampling for analyzing the variability of production
emissions with the Monte Carlo simulation. Understanding the statistical
distribution of production emissions and reducing both the mean and the
standard deviation of the transient emissions were the objectives of their
analysis. Six control factors with three levels on each factor were selected in
a single L
18
array: piston-to-head clearance, nozzle ow, nozzle protrusion,
spray cone angle, injection timing, and injection control pressure. Because it
was an experimental work, they selected sufciently wide intervals between
the factor levels in order to cover three times the standard deviation of each
design factor. The signal-to-noise ratio was used as an optimization response
parameter to minimize the emissions variance by using the main effect plot.
Unlike the signal-to-noise ratio calculation conducted by Baranescu et al.
(1989) who used an inner L
18
control factor array and an outer L
9
noise
factor array, Yan et al. (1993) used engine transient measurements to obtain
the mean, the variance, and the signal-to-noise ratio for each L
18
DoE run.
Each emission data in a DoE run is a summary point from the transient
measurement. In contrast, Baranescu et al. (1989) used the outer array design
points at a given inner array factor setting to compute the signal-to-noise
ratio for each L
18
run (as illustrated in Fig. 3.4) with steady-state engine
cycle simulations. Yan et al. (1993) used the main effect plot to check the
sensitivity of signal-to-noise ratio as a response with respect to all six control
factors for six performance/emissions parameters. The data exhibited fairly
nonlinear behavior of the signal-to-noise ratios with respect to the factor
levels. The optimum factor setting was selected with the highest signal-
to-noise ratio for each factor meanwhile minimizing the mean of PM and
Diesel-Xin-03.indd 259 5/5/11 11:46:07 AM
260 Diesel engine system design
© Woodhead Publishing Limited, 2011
maintaining the mean of NO
x
at a constant level. They also illustrated the
method of calculating the optimum signal-to-noise ratio at 95% condence
interval and the estimated optimum response (emissions) values. The 95%
condence interval level is usually a good compromise between model
accuracy and complexity. A high signal-to-noise ratio does not necessarily
mean the statistical distribution of the emissions variability is acceptable. The
authors continued their investigation by using the Monte Carlo simulation
along with the emissions regression models obtained from an earlier step
and other relevant models to calculate the statistical distributions of the
emissions parameters for ten factors. The ten factors were: nozzle cone angle,
nozzle protrusion, piston-to-head clearance, head gasket thickness, stem seal
leak rate, oil contribution from other sources, timing, injection command
pressure, nozzle ow, and intake port swirl ratio. The statistical distributions
of the input factors were determined by actual engine testing data. A large
amount of samples were taken as the input for the Monte Carlo simulation.
The Monte Carlo simulation was run 500 times to obtain the result of
emissions variability/scattering. They quantied the contribution from each
factor on the standard deviation of the emissions distributions. This work
leaped from the Taguchi DoE method of signal-to-noise ratio optimization
to probability distribution analysis for performance variability, and it is one
of the pioneering works in the Monte Carlo simulation for diesel engines.
Hunter et al. (1990) applied the Taguchi method to simultaneously optimize
several diesel engine design and operating parameters for low emissions in
a single cylinder engine. The control factors included engine compression
ratio, nozzle area, nozzle protrusion, boost pressure, start-of-combustion
timing, indicated mean effective pressure, and engine speed. The interactions
included: compression ratio vs. nozzle area, compression ratio vs. nozzle
protrusion, and nozzle area vs. nozzle protrusion. The responses included
the mean and the signal-to-noise ratio of particulate matter, NO
x
, HC, and
smoke. They provided a detailed description of each step in the Taguchi
method, especially the calculation procedure and formula for predicting
the optimum responses (with 90% condence interval) when each factor is
independent and no signicant interactions exist. Gardner (1992) used the
Taguchi method to investigate the effects of changes in fuel spray cone angle,
number of spray holes, nozzle hole area, nozzle tip protrusion, compression
ratio, swirl level, and fuel injection timing on diesel engine combustion and
emissions. He pointed out that, although the Taguchi method is a powerful
tool for factor screening and optimization, it should be used with caution
to understand the confounding and interaction effects in order to choose
an appropriate orthogonal array and to avoid erroneous conclusions drawn
from the main effect study. Win et al. (2002) used the Taguchi method to
conduct an experimental study on diesel engine noise, emissions, and fuel
economy. They used the signal-to-noise ratio and ANOVA to quantify the
Diesel-Xin-03.indd 260 5/5/11 11:46:07 AM
261Optimization techniques in diesel engine system design
© Woodhead Publishing Limited, 2011
inuence of engine speed, load, and fuel injection timing on performance
response parameters.
Interesting experimental work was carried out by Yamamoto et al. (2002)
by combining the Taguchi method (orthogonal array design and linear
graph) with RSM (polynomial surface-t empirical model) to optimize the
parameters in fuel injection, turbine and EGR systems for low NO
x
, PM
emissions, and BSFC for a heavy-duty diesel engine. Their work is important
for the following four contributions: (1) expanding the DoE optimization
from a single speed–load mode to balancing all 13 modes in a steady-state
emissions cycle; (2) checking optimization results against design constraints;
(3) combining Taguchi’s orthogonal array design with a special polynomial
model; and (4) using a Chebychev’s orthogonal polynomial as an empirical
model in the Taguchi method. In their study, six calibration or design factors
with three levels were used in a Taguchi L
27
orthogonal array: VGT vane
opening, EGR valve lift, injection timing, common rail injection pressure,
injection nozzle diameter, and injection nozzle cone angle. The DoE method
was applied at each engine mode point of the Japanese 13-mode emissions
test cycle. After the optimum trade-off between the emissions and the BSFC
at each mode point was obtained, the optimization for the entire 13-mode
composite was made by a balancing between the modes. They used ANOVA
to quantify the interaction effects among VGT vane opening, EGR valve lift,
and fuel injection timing. It should be noted that they used a Chebychev’s
orthogonal polynomial, rather than a regular second-order polynomial, to
t a second-order empirical model including the interaction terms. In most
other researchers’ work using the Taguchi method, the main effect plot, the
signal-to-noise ratio and condence interval were usually used to identify
the optimum factor levels and estimate the optimum responses. Yamamoto
et al. (2002) did not take that approach. They used Chebychev’s empirical
equation to conduct a numerical parametric study at each mode. They took
this different approach probably in an attempt to overcome the weakness of
the Taguchi method in regression models. Checking the predicted optimization
solution against design constraints was particularly mentioned in their work.
The limiting constraints included smoke, turbocharger over-speed, engine
over-speed, exhaust gas temperature, and maximum cylinder pressure. The
authors probably did not realize that their work actually took a hybrid approach
between the Taguchi method and RSM. Although it is worthwhile to further
investigate the validity of using a low-resolution Taguchi orthogonal array
with polynomial surface-t, their attempt of using a Chebychev’s orthogonal
polynomial, which is a special polynomial, did indicate an opportunity worth
further exploration in engine optimization theory.
The above examples show that the Taguchi DoE method has been
successfully used in diesel engine performance development. The
previous efforts have laid out a good foundation for this area to move
Diesel-Xin-03.indd 261 5/5/11 11:46:07 AM
262 Diesel engine system design
© Woodhead Publishing Limited, 2011
forward to adopt the more advanced DoE optimization theories and
techniques.
3.3.2 Engine calibration with RSM
Engine performance and emissions calibration is probably the area where
the RSM DoE technique has been most widely used compared with other
engine application areas. Engine calibration refers to tuning mechanically
or electronically the adjustable parameters on the engine to reach desirable
performance. In contrast to hardware design where a xed sizing has to be
chosen from a few candidates (e.g., engine compression ratio, turbine area,
cooler size), a tunable parameter offers the exibility of varying within a
range, depending on different engine speed and load operating conditions or
ambient conditions. Examples of mechanical tuning device include mechanical
governor, mechanical fuel injection system, and pneumatically controlled
turbine wastegate. Since electronic controls were applied to diesel engines
starting in the 1990s, the exibility and performance of the engine have
been greatly improved. However, the complexity of engine calibration and
the associated complexity in electronic control strategies and software have
increased dramatically. There are many electronically controlled calibration
parameters available in the engine, for example fuel injection timing, injection
pressure, turbine wastegate opening, VGT vane opening, EGR valve opening,
and intake throttle opening. Other possible calibration parameters include
cooling control valve setting, variable valve timing or cam phasing angle,
variable swirl control, and cylinder deactivation. Without using a DoE, nding
the optimum setting for these calibration factors is almost impossible.
Roepke and Fischer (2001) introduced an efcient calibration method
on variable valvetrain by using RSM for a gasoline engine. They pointed
out that the D-Optimal is very suitable and efcient for engine calibration
due to its capability of handling the constraints in factor combinations. The
concept of model-based calibration was explained by Lumsden et al. (2004)
in their RSM DoE work for stratied charge direct injection gasoline engines.
They indicated that using a third-order model with the space-lling DoE
design may yield better predictability than using the second-order model for
hydrocarbons and BSFC. Mallamo et al. (2004) used RSM to optimize an
off-road common-rail diesel engine performance with four calibration factors
(main injection timing, pilot injection duration, pre-injection timing, and
pre-injection duration) at three levels for each factor. The optimization was
conducted for NO
x
, PM, noise, and BSFC. It was proved that the model built
based on the CCF design gave very similar results to the model built based
on the full factorial design. Diesel engine calibration with DoE optimization
techniques was also reported by Brooks et al. (2005).
Engine calibration has been moving in the direction of using RSM DoE
Diesel-Xin-03.indd 262 5/5/11 11:46:07 AM
263Optimization techniques in diesel engine system design
© Woodhead Publishing Limited, 2011
with online automated testing, dynamic mapping, and ofine optimization, as
summarized by the MathWorks hosted SAE Panel Discussion (The MathWorks,
2007). Moreover, the powerful approach proposed earlier by using the two-
dimensional minimum BSFC contour maps can greatly enhance the quality
and efciency of optimization work in both engine calibration and engine
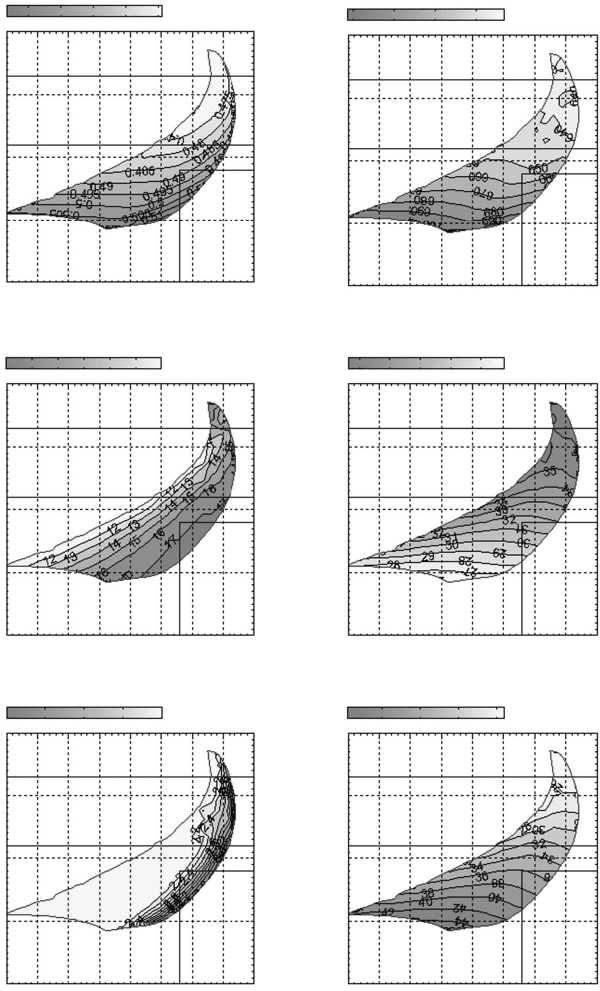
system design. Figure 3.21 shows an example of applying the approach of
minimum BSFC contour maps to the DoE optimization of engine emissions
calibration. Note that the factors and responses in the gure are all optimized
in the entire map domain with the minimum BSFC. The boundary of the
‘soot vs. NO
x
’ response domain is formed by the factor range of the DoE
and the calibration constraints.
3.3.3 Engine system optimization with RSM
Diesel engine system design is conducted by using DoE optimization
based on numerical simulation data since simulation can greatly reduce the
cost and time of hardware testing during engine development. The control
factors and noise factors can be brainstormed by using the cause-and-
effect ‘shbone’ diagram, as shown in Fig. 3.22 for engine performance
simulation. Figure 3.22 shows all the important categories of factors in an
engine performance model. The control factors may include hardware sizing
or engine calibration parameters. The noise factors can be from piece-to-
piece variation, environmental conditions, customer usage, or deterioration
over time. A large number of DoE optimization examples in diesel engine
system design are provided in Chapter 15 where the effects of subsystem
interaction are thoroughly addressed.
It is worth noting that RSM was used by Dvorak and Hoekstra (1996) more
than a decade ago for optimizing internal combustion engine performance.
Recognizing the weakness of the Taguchi method in quantifying the
interaction effects between engine performance factors, they used the central
composite design in RSM and engine performance simulation to analyze
the effects of eight design factors (intake valve diameter, exhaust valve
diameter, intake runner length, intake beginning runner area, bore, stroke,
intake cam duration, and exhaust cam duration) on engine power for a
gasoline engine. A second-order regression model including the interaction
effects were used. The optimization of engine power was conducted using
the method of steepest ascent. It should be noted that a canonical analysis
was performed to identify the canonical axis along which the greatest rate
of change occurred for the engine power. A stationary point was derived
as the optimum solution for the maximum engine power within the design
space. It was pointed out by the authors that the principal axis information
obtained from the canonical analysis was utilized to identify and construct
the new factor range of an expanded DoE in order to further increase the
Diesel-Xin-03.indd 263 5/5/11 11:46:07 AM
© Woodhead Publishing Limited, 2011
BSSoot (g/(hp.hr))
BSSoot (g/(hp.hr))BSSoot (g/(hp.hr))
BSSoot (g/(hp.hr))
BSSoot (g/(hp.hr))
BSSoot (g/(hp.hr))
0.4
0.35
0.3
0.25
0.2
0.15
0.1
0.05
0
0.4
0.35
0.3
0.25
0.2
0.15
0.1
0.05
0
0.4
0.35
0.3
0.25
0.2
0.15
0.1
0.05
0
0.4
0.35
0.3
0.25
0.2
0.15
0.1
0.05
0
0.4
0.35
0.3
0.25
0.2
0.15
0.1
0.05
0
0.4
0.35
0.3
0.25
0.2
0.15
0.1
0.05
0
4
3.5
3
2.5
2
17
16
15
14
13
12
36
34
32
30
28
40
35
30
25
0.51
0.5
0.49
0.48
0.47
700
680
660
640
0 0.5 1 1.5 2
BSNO
x
(g/(hp.hr))
0 0.5 1 1.5 2
BSNO
x
(g/(hp.hr))
0 0.5 1 1.5 2
BSNO
x
(g/(hp.hr))
0 0.5 1 1.5 2
BSNO
x
(g/(hp.hr))
0 0.5 1 1.5 2
BSNO
x
(g/(hp.hr))
0 0.5 1 1.5 2
BSNO
x
(g/(hp.hr))
Main injection timing (degree ATDC) Fuel injection pressure (MPa) BSFC (lb/hp.hr)
EGR rate (%) Air–fuel ratio
Exhaust manifold temperature
(°F)
3.21 HD diesel engine steady-state emissions calibration optimization with DoE and RSM (mode B25).
Diesel-Xin-03.indd 264 5/5/11 11:46:08 AM

© Woodhead Publishing Limited, 2011
Engine responses:
• Power
• BSFC
• Cylinder pressure
• Cylinder gas
temperature
• Intake and exhaust
manifold pressures
• Compressor outlet
air temperature
• Manifold gas T
• Exhaust gas
temperature
• Air ow rate
• EGR ow rate
• Fuel ow rate
• Emissions
• Heat rejections
• Reciprocating
forces
The brainstorming of
factors-causes covers
a system level and
the needs from all
subsystems.
Vehicle drivetrain
Hybrid powertrain
Cylinder head
Valvetrain
Connecting rod
Crankshaft
Exhaust manifold
Turbocharger
EGR system
Fuel system
Cooling system
Waste heat recovery
Engine brake
Accessories
Aftertreatment
Engine controls
Engine calibration
Intake manifold
Power cylinder &
piston assembly
Combustion and heat release
Cylinder breathing (volumetric efficiency)
Engine friction
Base engine heat rejection characteristics
Exhaust pipe heat transfer
Airpath control strategy
Air system controls and calibration
Engine basic geometry
Altitude and ambient pressure
Engine inlet air temperature
Engine operating condition
Engine flow restrictions
Turbocharger
Charge air cooler (CAC)
EGR cooler
Compressor inter-stage cooler (ISC)
Bore
ROA
Ambient
temperature
Engine
speed
Engine
load
(fueling)
Exhaust
restriction
Compressor
efficiency
Turbine
efficiency
Intake
restriction
Stroke
Masses
Turbine
area
CAC
flow
restriction
EGR
cooler
flow
restriction
EGR
cooler
size
EGR
cooler
sink T
ISC
sink T
ISC
size
CAC
size
CAC
sink T
ISC
flow
restriction
Injection
timing
Heat
transfer
areas
Map
set
point
Turbine
wastegate
opening
Piston
skirt
Piston
rings
Valve
size
Intake
port
heating
Insulation
Injection
pressure
Port flow
coefficient
Compression
ratio
Swirl
Bearings
Friction
Vehicle
speed
(cooling
air flow)
Accessories
Swirl
Cylinder
sink T
Piston
cooling
Model
based
EGR
valve
opening
Intake
throttle
opening
3.22 Cause-and-effect diagram for engine system performance analysis.
Intake and
exhaust
cam
profiles
Diesel-Xin-03.indd 265 5/5/11 11:46:08 AM