Webster R., Oliver M.A., Geostatistics for Environmental Scientists
Подождите немного. Документ загружается.


The variance is the second mom ent about the mean. Like the mean, it is based
on all of the observations, it can be treated algebraically, and it is little affected
by sampling fluctuations. It is both additive and positive. Its analysis and use
are backed by a huge body of theory. Its square root is the standard deviation, S.
Below we shall replace the divisor N by N 1 so that we can use the variance
of a sample to estimate s
2
, the population variance, without bias.
Coefficient of variation
The stan dard deviation expresses dispersion in the same units as those in which
the variable is measured. There are situations in which we may want to express
it in relative terms, as where a property has been measured in two different
regions to give two similar values of S but where the means are different. If the
variances are the same we might regard the region with the smaller mean as
more variable than the other in relative terms. The coefficient of variation (CV)
can expr ess this. It is usually presented as a percentage:
CV ¼ 100ðS=
zÞ%: ð2:4Þ
It is useful for comparing the variation of different sets of observations of the
same property . It has little merit for properties with scales having arbitrary
zeros and for comparing different properties except where they can be measured
on the same scale.
Skewness
The skewne ss measures the asymmetry of the observations. It is defined
formally from the third moment about the mean:
m
3
¼
1
N
X
N
i¼1
ðz
i
zÞ
3
: ð2:5Þ
The coefficient of skewness is then
g
1
¼
m
3
m
2
ffiffiffiffiffiffi
m
2
p
¼
m
3
S
3
; ð2: 6Þ
where m
2
is the variance. Symmetric distributions have g
1
¼ 0. Skewness is the
most common departure from normality (see below) in measured environ-
mental data. If the data are skewed then there is some doubt as to which
measure of centre to use. Comparisons betw een the means of different sets of
observations are especially unreliable because the variances can differ substan-
tially from one set to another.
Measurement and Summary 17

Kurtosis
The kurtosis expresses the peakedness of a distribution. It is obtained from the
fourth moment about the mean:
m
4
¼
1
N
X
N
i¼1
ðz
i
zÞ
4
: ð2:7Þ
The coefficient of kurtosis is given by
g
2
¼
m
4
m
2
2
3 ¼
m
4
ðS
2
Þ
2
3: ð2:8Þ
Its significance relates mainly to the normal distribution, for which g
2
¼ 0.
Distributions that are more peaked than normal have g
2
> 0; flatter ones have
g
2
< 0.
2.2 THE NORMAL DISTRIBUTION
The normal distribution is central to statistical theory. It has been found to
describe remarkably well the errors of observation in physics. Many environ-
mental variables, such as of the soil, are distributed in a way that approximates
the normal distribu tion. The form of the distribution was discovered indepen-
dently by De Moivre, Laplace and Gauss, but Gauss seems generally to take the
credit for it, and the distribution is often called ‘Gaussian’. It is defined for a
continuous random variable Z in terms of the probability density functio n (pdf),
f ðzÞ,as
f ðzÞ¼
1
s
ffiffiffiffiffiffi
2p
p
exp
ðz mÞ
2
2s
2
()
; ð2:9Þ
where m is the mean of the distribution and s
2
is the variance.
The shape of the normal distribution is a vertical cross-section through a bell.
It is continuous and symmetrical, with its peak at the mean of the distribution.
It has two points of inflexion, one on each side of the mean at a distance s. The
ordinate f ðzÞ at any given value of z is the probability density at z. The total area
under the curve is 1, the total probability of the distribution. The area under
any portion of the curve, say between z
1
and z
2
, represents the proportion of the
distribution lying in that range. For instance, slightly more than two-thirds of
the distribution lies within one standard deviation of the mean, i.e. between
m s and m þ s; about 95% lies in the range m 2s to m þ 2s; and 99.73%
lies within three standard deviations of the mean.
Just as the frequency distribution can be represented as a cumulative
distribution, so too can the pdf. In this representation the normal distribution
18 Basic Statistics
is characteristically sigmoid as in Figures 2.3(a), 2.3(c), 2.6(a) and 2.6(c). The
main use of the cumulative distribution function is that the probability of a
value’s bein g less than a specified amount can be read from it. We shall return
to this in Chapter 11.
In man y instances distributions are far from normal, and these departures
from normality give rise to unstable estimates and make inference and inter-
pretation less certain than they might otherwise be. As above, we can be in
some doubt as to which measure of centre to take if data are skewed. Perhaps
more seriously, statistical comparisons between means of observations are
unreliable if the variable is skewed because the variances are likely to differ
substantially from one set to another.
2.3 COVARIANCE AND CORRELATION
When we have two variables, z
1
and z
2
, we may have to consider their joint
dispersion. We can express this by their covariance, C
1;2
, which for a finite set of
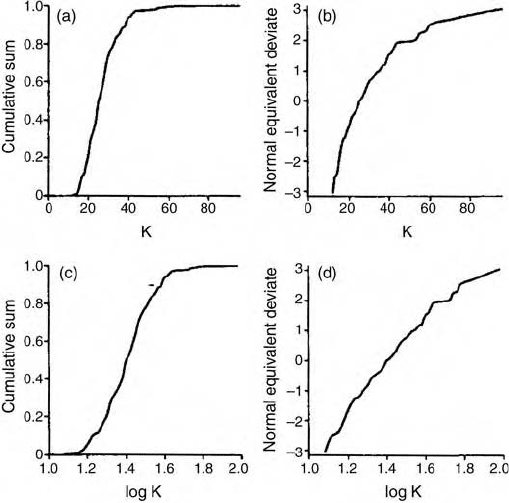
Figure 2.3 Cumulative distribution: (a) exchangeable K in the range 0 to 1 and (b) as
normal equivalent deviates, on the original scale (mg l
1
); (c) log
10
K in the range 0 to 1
and (d) as normal equivalent deviates.
Covariance and Correlation 19

observations is
C
1;2
¼
1
N
X
N
i¼1
fðz
1
z
1
Þðz
2
z
2
Þg; ð2:10Þ
in which
z
2
and
z
2
are the means of the two variables. This expression is
analogous to the variance of a finite set of observations, equation (2.3).
The covariance is affected by the scales on which the properties have been
measured. This makes comparisons between different pairs of variables and sets
of observations difficult unless measurements are on the same scale. Therefore,
the Pearson product-moment correlation coefficient, or simply the correlation
coefficient, is often preferred. It refers specifically to linear correlation and it is
a dimensionless value.
The correlation coefficient is obtained from the covariance by
r ¼
C
1;2
S
1
S
2
: ð2:11Þ
This quantity is a measure of the relation between two variables; it can range
between 1 and 1. If units with large values of one variable also have large
values of the other then the two variables are positively correlated, r > 0; if the
large values of the one are matched by small values of the other then the two
are negatively correlated, r < 0. If r ¼ 0 then there is no linear relation.
Just as the normal distribution is of special interest for a sing le variable, for
two variables we are interested in a joint distribution that is bivariate nor mal.
The joint pdf for such a distribution is given by
f ðzÞ¼
1
2ps
1
s
2
ffiffiffiffiffiffiffiffiffiffiffiffiffiffi
1 r
2
p
exp
ðz
1
m
1
Þ
2
s
2
1
("
2rðz
1
m
1
Þðz
2
m
2
Þ
s
1
s
2
þ
ðz
2
m
2
Þ
2
s
2
2
)
2ð1 r
2
Þ
#
: ð2:12Þ
In this equation m
1
and m
2
are the means of z
1
and z
2
, s
2
1
and s
2
2
are the
variances, and r is the correlation coefficient.
One can imagine the function as a bell shape standing above a plane defined
by z
1
and z
2
with its peak above the point fm
1
; m
2
g. Any vertical cross-section
through it appears as a normal curve, and any horizon tal section is an ellipse—
a ‘contour’ of equal probability.
2.4 TRANSFORMATIONS
To overcome the diffi culties arising from departures from normality we can
attempt to transform the measured values to a new scale on which the
distribution is more nearly normal. We should the n do all further analysis on
20 Basic Statistics

the transformed data, and if necessary transform the results to the original scale
at the end. The following are some of the commonly used transformations for
measured data.
2.4.1 Logarithmic transformation
The geometric mean of a set of data is
g ¼
Y
N
i¼1
z
i
()
1=N
; ð2:13Þ
so that
log
g ¼
1
N
X
N
i¼1
log z
i
; ð 2: 14Þ
in which the logarithm may be either natural (ln) or common (log
10
). If by
transforming the data z
i
, i ¼ 1; 2; ...; N, we obtain log z with a normal
distribution then the variable is said to be lognormally distributed. Its prob-
ability distribution is given by equation (2.9) in which z is replaced by ln z, and
s and m are the parameters on the logarithmic scale.
It is sometimes necessary to shift the origin for the transformation to achieve
the desired result. If subtracting a quantity a from z gives a close approximation
to normality, so that z a is lognormally distributed, then we have the
probability density
f ðzÞ¼
1
sðz a Þ
ffiffiffiffiffiffi
2p
p
exp
1
2s
2
flnðz aÞmg
2
: ð2:15Þ
We can write this as
f ðzÞ¼
1
sðz a Þ
ffiffiffiffiffiffi
2p
p
exp
1
2s
2
ln
z a
b
no
2
; ð2:16Þ
where b ¼ expðmÞ. This is known as the three-parameter log-transformation;
the parameters a, b and s represent the position, size and shape, respectively, of
the distribution. You can read more about this distribution in Aitchison and
Brown (1957).
2.4.2 Square root transformation
Taking logarithms will often normalize, or at least make symmetric, distribu-
tions that are strongly positively skewed, i.e. have g
1
> 1. Less pronounced
Transformations 21

positive skewness can be removed by taking square roots:
r ¼
ffiffi
z
p
: ð2:17Þ
2.4.3 Angular transformation
This is sometimes used for proport ions in the range 0 to 1, or 0 to 100 if
expressed as percentages. If p is the proportion then define
f ¼ sin
1
ffiffiffi
p
p
: ð2:18Þ
The desired transform is the angle whose sine is
ffiffiffi
p
p
.
2.4.4 Logit transformation
If, as above, p is a proportion ð0 < p < 1Þ, then its logit is
l ¼ ln
p
1 p
: ð2:19Þ
Note that the limits 0 and 1 are excluded; otherwise l would either go to 1 or
þ1. If you have proportions that include 0 or 1 then you must make some little
adjustment to use the logit transformation.
In Chapter 11 we shall see a more elaborate transformation using Hermite
polynomials.
2.5 EXPLORATORY DATA ANALYSIS AND DISPLAY
The physics of the environment might determine what transformation would be
appropriate. More often than not, however, one must decide empirically by
inspecting data. This is part of the preliminary exploration of the data from
survey, which should always be done before more formal analysis. You should
examine data by displaying them as histograms, box-plots and scatter dia-
grams, and compute summary statistics. You should suspect observation s that
are very different from their neighbours or from the general spread of values,
and you should investigate abnormal values; they might be true outliers, or
errors of mea surement, or recording or transcription mistakes. You must then
decide what to do about them.
If the data are not approximately normal then you can experiment with
transformation to make them so, as outlined in Section 2.4. There are formal
22 Basic Statistics

significance tests for normality, but these are generally not helpful, partly
because they depend on the number of data and partly because they do not tell
you in what way a distribution departs from normal. We illustrate this
weakness below. You can try fitting theoretical dist ributions from the estimated
parameters of the dist ribution to the histogram. If the histogram appears erratic
then another way of examining the data for normality is to compute the
cumulative distribution and plot it against the normal probability on normal
probability paper. This paper has an ordinate scaled in such a way that a
normal cumulative dist ribution appears as a straight line. Alternatively, you
can compute the normal equivalent deviate for probability p; this is the value of
z to the left of which on the graph the area under the standard normal curve is
p. A strong deviation from the line indicates non-normality, and you can try
drawing the cumulative distributions of transformed data to see which gives a
reasonable fit to the line before deciding whether to transform and, if so, in
what way.
To illustrate these effects we turn to the dist ribution of potassium at Broom’s
Barn Farm. The data are from an original study by Webster and McBratney
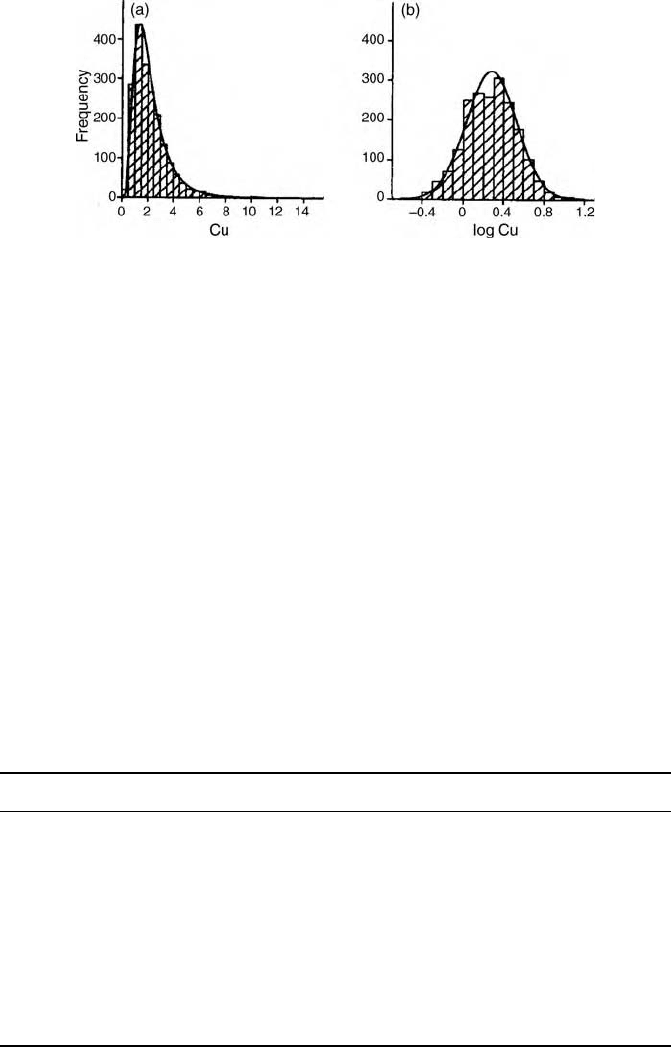
(1987). The distribution is shown as a histogram of the measured values in
Figure 2.1(a). To it is fitted the curve of the lognormal distribution with
parameters as given in Table 2.1. It is positively skewed. The histogram of
the logarithms is shown in Figure 2.1(b). It is approximately symmetric, the
normal pdf fits well, and transforming to logarithms has approximately normal-
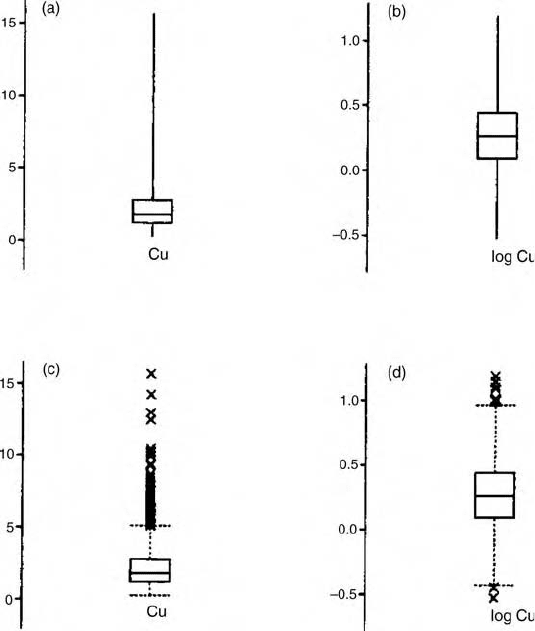
ized the data. Figure 2.2 shows the corresponding box-plots, as ‘box and
whisker’ plots in which the limits of the boxes enclose the interquartile ranges
and the whiskers extend to the limits of the data, Figure 2.2(a)–(b). In
Figure 2.2(c)–(d) the whiskers extend only to ‘fences’, and any points lying
beyond them are plotted individually. The upper fence is the lim it of the upp er
quartile plus 1.5 times the interqu artile range or the maximum if that is
Table 2.1 Summary statistics for exchangeable potassium (K, mg l
1
) at Broom’s Barn
Farm.
Klog
10
K
Minimum 12.0 1.0792
Maximum 96.0 1.9823
Mean 26.31 1.3985
Median 25.0 1.3979
Standard deviation 9.039 0.1342
Variance 81.706 0.01800
Skewness 2.04 0.39
Kurtosis 9.51 0.57
Number of observations 434 434
x
2
for normal fit (with 18 degrees of freedom) 174.4 43.6
Exploratory Data Analysis and Display 23
smaller; the lower fence is defined analogously. Again, skew is seen to be
removed by taking logarithms. Figure 2.3(a)–(b) shows the cumulative dis-
tributions plotted on the probability scale and as normal equivalent deviates,
respectively. Figu re 2.3(c)–(d) shows the same graphs for log
10
K. These graphs
are close to the normal line, and clearly transformation to logarithms yields a
near-normal distribution in this instance.
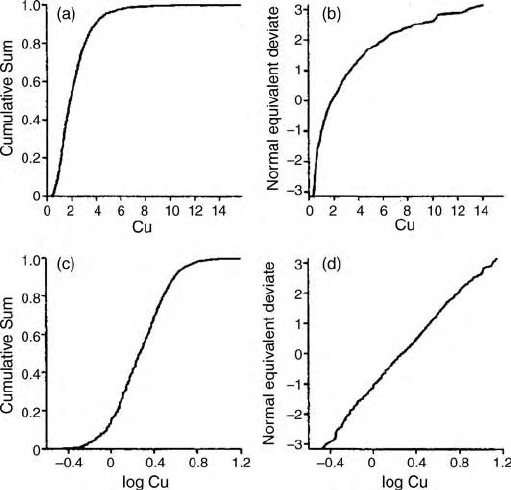
Figures 2.4–2.6 show the effects of transformation to common logarithms for
readily extractable copper of the topsoil in the Borders Region of Scotland
(McBratney et al., 1982). For these data, which are summarized in Table 2.2,
taking logarithms normalizes the data very effectively.
The shortcomings of formal testing for a theoretical distribution can be seen
in the x
2
values given in Tables 2.1 and 2.2 for fitting the normal distribution.
The values for the untransformed data are huge and clearly significant.
Figure 2.4 Histograms: (a) extractable copper (Cu); (b) log
10
Cu, in the topsoil of the
Borders Region. The curves are of the (lognormal) probability density.
Table 2.2 Summary statistics for extractable copper (Cu, mg kg
1
) in the Borders
Region.
Cu log
10
Cu
Minimum 0.3 0.5214
Maximum 15.7 1.1959
Mean 2.221 0.2713
Median 1.85 0.2674
Standard deviation 1.461 0.2544
Variance 2.1346 0.064731
Skewness 2.52 0.06
Kurtosis 12.10 0.05
Number of observations 1949 1949
x
2
for normal fit (with 18 degrees of freedom) 977.6 28.1
24 Basic Statistics
Transforming potassium to logarithms still gives a x
2
(43.6) exceeding the 5%
value ðx
2
p¼0:05; f ¼18
¼ 28:87Þ, where p signifies the probability and f the degrees
of freedom. Even for log Cu the computed x
2
(28.1) is close to the 5% value. The
reason, as mentioned above, lies largely in having so many data, so that the test
is very sensitive.
2.5.1 Spatial aspects
For spatial data the spatial coordinates must also be checked. The positions of
the sampling points can be plotted on a map, referred to in Chapter 1 as a
‘posting’ of the data. Do all the points lie within the region surveyed? If not,
why? Sampling points for a soil survey falling in the sea are obviously wrong,
Figure 2.5 Box-plots: (a) extractable Cu and (b) log
10
Cu showing the ‘box’ and
‘whiskers’; (c) extractable Cu and (d) log
10
Cu showing the fences at the quartiles plus
and minus 1.5 times the interquartile range.
Exploratory Data Analysis and Display 25
but those on lan d just outside the region might be valid. Frequently the cause is
a reversal of the coordinates, however.
The data should also be examined for trend, which might be evident as a
gross regional change in the values, which is also smooth and predictable. If
you have sampled on a grid then arrange the data in a two-way table, compute
the means and medians of both rows and columns, and plot them. The results
will show if the data embody trend, at least in the directio ns of the axes of the
coordinate system, by a progressive increase or decrease in the row or column
means. Figure 2.7 shows the distribution of the sampling points for Broom’s
Barn Farm. The graphs of the row and column means are on the right-hand
side and at the bottom, respectively. These graphs show small fluctuations
about the row and column means, but no evidence of trend.
2.6 SAMPLING AND ESTIMATION
We have made the point above that we can rarely have complete information
about the environment. Soil, for example, forms a continuous mantle on the
Figure 2.6 Cumulative distributions: (a) extractable Cu in the range 0 to 1 and (b) as
normal equivalent deviates, on the original scale ðmg kg
1
); (c) log
10
Cu in the range 0 to
1 and (d) as normal equivalent deviates.
26 Basic Statistics