Wallace J.M., Hobbs P.V. Atmospheric Science. An Introductory Survey
Подождите немного. Документ загружается.

294 Atmospheric Dynamics
or, in vectorial form,
(7.39b)
where
V is the divergence of the horizontal wind
field. Hence, horizontal divergence (
V 0) is
accompanied by vertical squashing (
p 0), and
horizontal convergence is accompanied by vertical
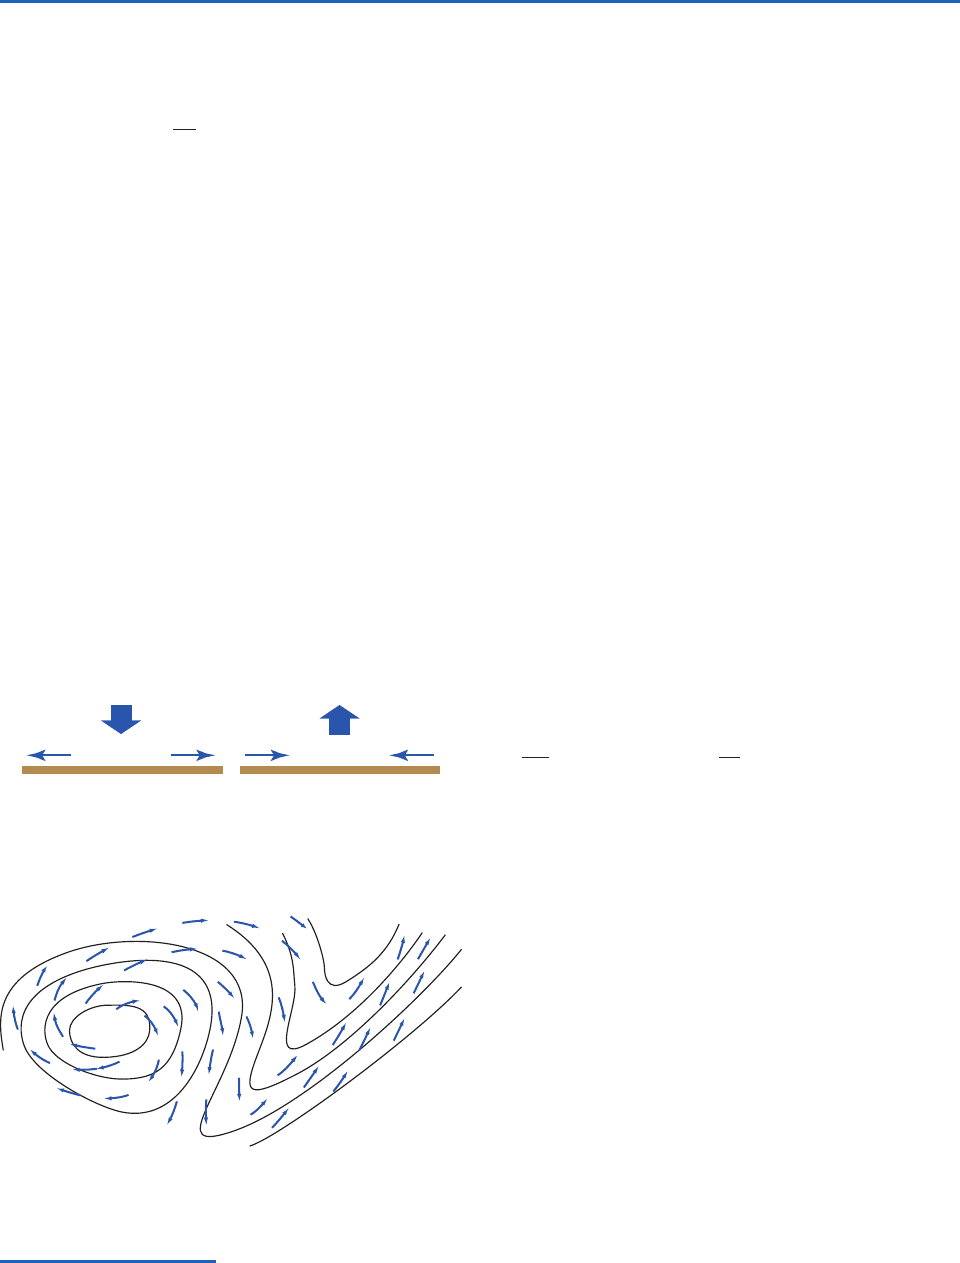
stretching, as illustrated schematically in Fig. 7.18.
Within the atmospheric boundary layer air parcels
tend to flow across the isobars toward lower pressure
in response to the frictional drag force. Hence, the
low-level flow tends to converge into regions of low
pressure and diverge out of regions of high pressure,
as illustrated in Fig. 7.19. The frictional convergence
within low-pressure areas induces ascent, while the
divergence within high-pressure areas induces subsi-
dence. In the oceans, where the Ekman drift is in the
opposite sense, cyclonic, wind-driven gyres are charac-
terized by upwelling, and anticyclonic gyres by down-
welling. In a similar manner, regions of Ekman drift
in the offshore direction are characterized by coastal
p
V
upwelling, and the easterly surface winds along the
equator induce a shallow Ekman drift away from the
equator, accompanied by equatorial upwelling.
The vertical velocity at any given point (x, y) can be
inferred diagnostically by integrating the continuity
equation (7.39b) from some reference level p* to
level p,
(7.40)
In this form, the continuity equation can be used
to deduce the vertical velocity field from a knowl-
edge of the horizontal wind field. A convenient
reference level is the top of the atmosphere, where
p* 0 and
0. Integrating (7.40) downward
from the top down to the Earth’s surface, where
p p
s
we obtain
Incorporating this result and (7.34) into (7.32) and
rearranging, we obtain Margules’
22
pressure tendency
equation
(7.41)
which serves as the bottom boundary condition for
the pressure field in the primitive equations.
At the Earth’s surface, the pressure tendency term
p
s
t is on the order of 10 hPa per day and the
advection terms V
s
p
s
and w
s
(pz) are usu-
ally even smaller. It follows that
where {
V} is the mass-weighted, vertically-
averaged divergence. Because and
1 day 10
5
s, it follows that
{ V} 10
7
s
1
p
s
1000 hPa
p
s
0
( V) dp p
s
{ V} 10 hPa day
1
p
s
t
V
s
p
s
w
s
p
z
p
s
0
( V) dp
s
p
s
0
( V) dp
(p)
(p*)
p
p*
( V) dp
ω > 0 ω < 0
• V > 0
∆
• V < 0
∆
Fig. 7.18 Algebraic signs of
in the midtroposphere asso-
ciated with convergence and divergence in the lower
troposphere.
Fig. 7.19 Cross-isobar flow at the Earth’s surface induced
by frictional drag. Solid lines represent isobars.
L
H
22
Max Margules (1856–1920) Meteorologist, physicist, and chemist, born in the Ukraine. Worked in intellectual isolation on atmos-
pheric dynamics from 1882 to 1906, during which time he made many fundamental contributions to the subject. Thereafter, he returned to
his first love, chemistry. Died of starvation while trying to survive on a government pension equivalent to $2 a month in the austere post-
World War I period. Many of the current ideas concerning the kinetic energy cycle in the atmosphere (see Section 7.4) stem from
Margules’ work.
P732951-Ch07.qxd 12/16/05 11:05 AM Page 294
7.3 Primitive Equations 295
That the vertically averaged divergence is typically
about an order of magnitude smaller than typical
magnitudes of the divergence observed at specific
levels in the atmosphere reflects the tendency (first
pointed out by Dines
23
) for compensation between
lower tropospheric convergence and upper tropos-
pheric divergence and vice versa. Vertical velocity
,
which is the vertical integral of the divergence, tends
to be strongest in the mid-troposphere, where the
divergence changes sign.
24
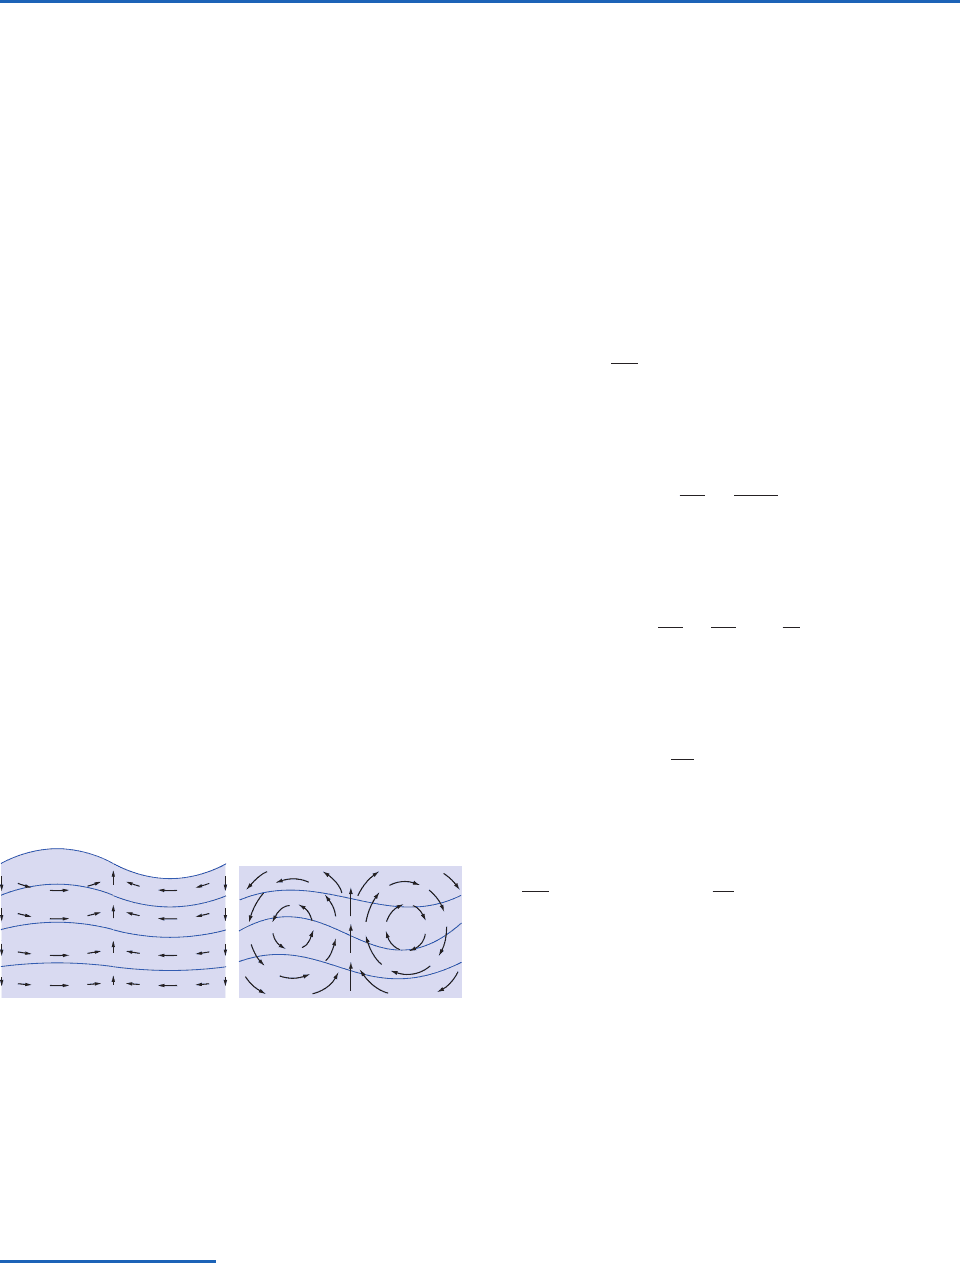
It is instructive to consider the vertical profile of
atmospheric divergence in light of the idealized flow
patterns for the two-dimensional flow in two differ-
ent kinds of waves in a stably stratified liquid in
which density decreases with height. Fig. 7.20a shows
an idealized external wave in which divergence is
independent of height and vertical velocity increases
linearly with height from zero at the bottom to a
maximum at the free surface of the liquid. Fig. 7.20b
shows an internal wave in a liquid that is bounded by
a rigid upper lid so that w 0 at both top and bot-
tom, requiring perfect compensation between low
level convergence and upper level divergence and
vice versa. In the Earth’s atmosphere, motions that
resemble the internal wave contain several orders of
magnitude more kinetic energy than those that
resemble the external wave. In some respects, the
stratosphere plays the role of a “lid” over the tropo-
sphere, as evidenced by the fact that the geometric
vertical velocity w is typically roughly an order of
magnitude smaller in the lower stratosphere than in
the midtroposphere.
7.3.5 Solution of the Primitive Equations
The primitive equations, in the simplified form that
we have derived them, consist of the horizontal equa-
tion of motion
(7.14)
the hypsometric equation
(3.23)
the thermodynamic energy equation
(7.36)
and the continuity equation
(7.39b)
together with the bottom boundary condition
(7.41)
Bearing in mind that the horizontal equation of
motion is made up of two components, the system of
primitive equations, as presented here, consist of five
equations in five dependent variables: u, v,
, , and
T. The fields of diabatic heating J and friction F need
to be prescribed or parameterized (i.e., expressed as
functions of the dependent variables). The horizontal
equation(s) of motion, the thermodynamic energy
equation, and the equation for pressure on the
bottom boundary all contain time derivatives and are
p
s
t
V
s
p w
s
p
z
p
s
0
( V) dp
p
V
dT
dt
!
T
p
J
c
p
p
RT
p
dV
dt
f k V F
23
Willam Henry Dines (1855–1927) British meteorologist. First to invent a device for measuring both the direction and the speed of
the wind (the Dines’ pressure-tube anemometer). Early user of kites and ballons to study upper atmosphere.
24
The midtroposphere minimum in the amplitude of
V justifies the use of (7.22) in diagnosing the vorticity balance at that level.
Alternatively (7.22) can be viewed as relating to the vertically averaged tropospheric wind field, whose divergence is two orders of magni-
tude smaller than its vorticity.
(a) (b)
Fig. 7.20 Motion field in a vertical cross section through a
two-dimensional wave propagating from left to right in a sta-
bly stratified liquid. The contours represent surfaces of con-
stant density. (a) An external wave in which the maximum
vertical motions occur at the free surface of the liquid, and
(b) an internal wave in which the vertical velocity vanishes at
the top because of the presence of a rigid lid.
P732951-Ch07.qxd 12/16/05 11:05 AM Page 295

296 Atmospheric Dynamics
therefore said to be prognostic equations.The
remaining so-called diagnostic equations describe
relationships between the dependent variables that
apply at any instant in time.
The primitive equations can be solved numerically.
The dependent variables are represented on an array
of regularly spaced horizontal grid points and at a
number of vertical levels. In global models, the grid
points usually lie along latitude circles and meridians,
although the latitudinal spacing is not necessarily
uniform.The equations are converted to the Eulerian
form (1.3) so that the calculations can be performed
on a fixed set of grid points and levels rather than
requiring the grid to move with the air trajectories.
Initial conditions for the dependent variables are
specified at time t
0
, taking care to ensure that the
diagnostic relations between the variables are satis-
fied (e.g., the geopotential field must be hydrostati-
cally consistent with the temperature field).
Terms in the equations involving horizontal and
vertical derivatives are evaluated using finite differ-
ence techniques (approximating them as differences
between the numerical values of the respective vari-
ables at neighboring grid points and levels in the
array divided by the distances between the grid
points) or as the coefficients of a mutually orthogo-
nal set of analytic functions called spherical harmon-
ics.
25
The time derivative terms Vt, Tt, and
p
s
t are then evaluated and their respective three-
dimensional fields are projected forward through a
short time step t so that, for example,
The diagnostic equations are then applied to obtain
dynamically consistent fields of the other dependent
variables at time t
0
t.The process is then repeated
over a succession of time steps to describe the evolu-
tion of the fields of the dependent variables.
The time step t must be short enough to ensure
that the fields of the dependent variables are not
corrupted by spurious small scale patterns arising
from numerical instabilities. The higher the spatial
resolution of the model, the shorter the maximum
allowable time step and the larger the number of
u(t
0
t) u(t
0
)
u
t
t
calculations required for each individual time step.
Hence the computer resources required for numeri-
cal weather prediction and climate modeling increase
sharply with the spatial resolution of the models.
7.3.6 An Application of Primitive Equations
To show how the dynamic processes represented in
the primitive equations give rise to atmospheric
motions and maintain them in the presence of fric-
tion, let us consider the events that transpire during
the first few time steps when an atmospheric primi-
tive equation model is “turned on,” starting from a
state of rest. Initially the atmosphere is stably strati-
fied and the pressure and potential temperature sur-
faces are horizontally uniform.
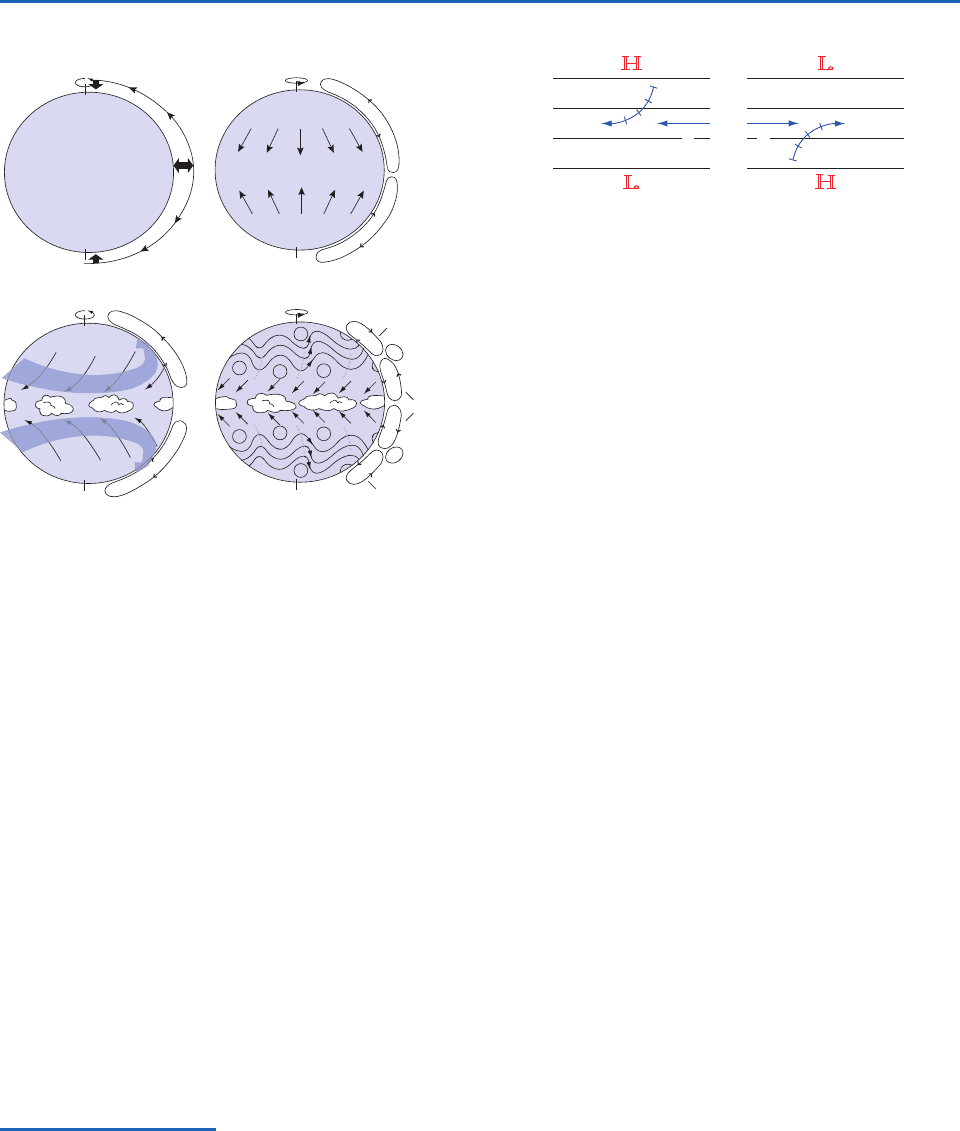
Starting at time t 0, the tropics begin to warm
and the polar regions begin to cool in response to
an imposed distribution of diabatic heating, which
is designed to mimic the equator-to-pole heating
gradient in the real atmosphere. As the tropical
atmosphere warms, thermal expansion causes the
pressure surfaces in the upper troposphere to bulge
upward, while cooling of the polar atmosphere
causes the pressure surfaces to bend downward as
depicted in Fig. 7.21a. These tendencies are evident
even in the very first time step of the time integra-
tion. The sloping of the pressure surfaces gives rise
to an equator-to-pole pressure gradient at the
upper levels. The pressure gradient force, in turn,
drives the poleward flow depicted in Fig. 7.21a,
which comes into play in the second time step of
the integration.
The poleward mass flux results in a latitudinal
redistribution of mass, causing surface pressure to
drop in low latitudes and rise in high latitudes. The
resulting low level equator-to-pole pressure gradi-
ent drives a compensating equatorward low level
flow. Hence, the initial response to the heating gra-
dient is the development of an equator-to-pole cir-
culation cell, as shown in Fig. 7.21b. The Coriolis
force in the horizontal equation of motion imparts a
westward component to the equatorward flow in
the lower branch of the cell and an eastward com-
ponent to the poleward flow in the upper branch, as
shown in Fig. 7.21c.
25
Spherical harmonics are products of Legendre polynomials in the latitude domain and sines and cosines in the longtitude domain. In
the spherical harmonic representation of the primitive equations, operations such as taking horizontal gradients (x, y), Laplacians
(
2
), and inverse Laplacians (
2
) reduce to simple algebraic operations performed on the coefficients.
P732951-Ch07.qxd 12/16/05 11:05 AM Page 296
7.4 The Atmospheric General Circulation 297
The flow becomes progressively more zonal with
each successive time step, until the meridional com-
ponent of the Coriolis force comes into geostrophic
balance with the pressure gradient force, as illustrated
in Fig. 7.22. As required by thermal wind balance, the
vertical wind shear between the low level easterlies
and the upper level westerlies increases in proportion
to the strengthening equator-to-pole temperature
gradient forced by the meridional gradient of the dia-
batic heating. The Coriolis force acting on the rela-
tively weak meridional cross-isobar flow is
instrumental in building up the vertical shear.
Frictional drag limits the strength of the surface east-
erlies, but the westerlies aloft become stronger with
each successive time step. Will these runaway wester-
lies continue to increase until they become supersonic
or will some as yet to be revealed process intervene
to bring them under control? The answer is reserved
for the following section.
7.4 The Atmospheric General
Circulation
Dating back to the pioneering studies of Halley
26
in
1676 and Hadley in 1735, scientists have sought to
explain why the surface winds blow from the east at
subtropical latitudes and from the west in middle lat-
itudes, and why the trade winds are so steady from
one day to the next compared to the westerlies in
midlatitudes. Such questions are fundamental to an
understanding of the atmospheric general circulation;
i.e., the statistical properties of large-scale atmos-
pheric motions, as viewed in a global context.
Two important scientific breakthroughs that
occurred around the middle of the 20th century paved
the way for a fundamental understanding of the gen-
eral circulation. The first was the simultaneous discov-
ery of baroclinic instability (the mechanism that gives
rise to baroclinic waves and their attendant extratropi-
cal cyclones) by Eady
27
and Charney.
28
The second was
the advent of general circulation models: numerical
Hadley
cells
North
Pole
Tropospheric
jet stream
J
J
L
L
H
H
H
L
L
H
H
H
Ferrel cell
Ferrel cell
North
Pole
North
Pole
North
Pole
S.P. S.P.
S.P. S.P.
(d)
(b)(a)
(c)
low pressure
high pressure
high pressure
cooling
heating
cooling
Fig. 7.21 Schematic depiction of the general circulation as
it develops from a state of rest in a climate model for equinox
conditions in the absence of land–sea contrasts. See text for
further explanation.
Fig. 7.22 Trajectories of air parcels in the middle latitudes
of the northern hemisphere near the Earth’s surface (left) and
in the upper troposphere (right) during the first few time
steps of the primitive equation model integration described in
Fig. 7.21. The solid lines represent geopotential height con-
tours and the curved arrows represent air trajectories.
(b)(a)
V
g
V
g
26
Edmund Halley (1656–1742) English astronomer and meteorologist. Best known for the comet named after him. Determined that
the force required to keep the planets in their orbits varies as the inverse square of their respective distances from the sun. (It remained
for Newton to prove that the inverse square law yields elliptical paths, as observed.) Halley undertook the business and printing (“at his
own charge”) of Newton’s masterpiece the Principia. First to derive a formula relating air pressure to altitude.
27
E. T. Eady (1915–1966) English mathematician and meteorologist. Worked virtually alone in developing a theory of baroclinic insta-
bility while an officer on the Royal Air Force during World War II. One of us (P. V. H.) is grateful to have had him as a tutor.
28
Jule G. Charney (1917–1981) Made major contributions to the theory of baroclinic waves, planetary-waves, tropical cyclones, and a
number of other atmospheric and oceanic phenomena. While working at the Institute for Advanced Studies at Princeton University he
helped lay the groundwork for numerical weather prediction. Later served as professor at Massachusetts Institute of Technology where
one of us (J. M. W.) is privileged to have had the opportunity to learn from him. Played a prominent role in fostering large international
programs designed to advance the science of weather prediction.
P732951-Ch07.qxd 12/16/05 11:05 AM Page 297

298 Atmospheric Dynamics
models of the global atmospheric circulation based on
the primitive equations that can be run over long
enough time intervals to determine seasonally varying,
climatological mean winds and precipitation, the
degree of steadiness of the winds, etc.
The importance of these developments becomes
apparent if we extend the numerical integration
described in the last section forward in time, based on
results that have been replicated in many different
general circulation models (GCM’s). The ensuing
developments could never have been anticipated on
the basis of the simple dynamical arguments pre-
sented in the previous section. When the meridional
temperature gradient reaches a critical value, the sim-
ulated circulation undergoes a fundamental change:
baroclinic instability spontaneously breaks out in mid-
latitudes, imparting a wave-like character to the flow.
The baroclinic waves create and maintain the circula-
tion in the configuration indicated in Fig. 7.21d. In the
developing waves, warm, humid subtropical air masses
flow poleward ahead of the eastward moving surface
cyclones, while cold, dry polar air masses flow equa-
torward behind the cyclones. The exchange of warm
and cold air masses across the 45° latitude circle
results in a net poleward flux of sensible and latent
heat, arresting the buildup of the equator-to-pole tem-
perature gradient.
Successive generations of baroclinic waves develop
and evolve through their life cycles, emanating from
their source region in the midlatitude lower tropo-
sphere, first dispersing upward toward the jet stream
(10 km) level and thence equatorward into the
tropics. The equatorward dispersion of the waves in
the upper troposphere causes the axes of their ridges
and troughs to tilt in the manner shown in Fig. 7.21d.
As a consequence of this tilt, poleward-moving air to
the east of the troughs exhibits a stronger westerly
wind component than equatorward moving air to the
west of the troughs. The difference in the amount of
westerly momentum carried by poleward and equa-
torward moving air parcels gives rise to a net pole-
ward flux of westerly momentum from the subtropics
into middle latitudes. In response to the import of
westerly momentum from the subtropics, the surface
winds in midlatitudes shift from easterly (Fig. 7.21c)
to westerly (Fig. 7.21d), the direction of the midlati-
tude surface winds in the real atmosphere.
Baroclinic waves drive their own weak northern
and southern hemisphere mean meridional circula-
tion cells, referred to as Ferrel
29
cells, characterized
by poleward, frictionally induced Ekman drift at the
latitude of the storm tracks (45°), ascent on the
poleward flank, and descent on the equatorward
flank, as indicated in Fig. 7.21d. Hence, with the
spontaneous development of the baroclinic waves,
the Hadley cells withdraw into the tropics, and a
region of subsidence develops at subtropical (30°)
latitudes. These regions of subsidence coincide with
the subtropical anticyclones (Figs. 1.18 and 1.19),
which mark the boundary between the tropical
trade winds and the extratropical westerlies. Most
of the world’s major desert regions lie within this
latitude belt.
7.4.1 The Kinetic Energy Cycle
Frictional dissipation observed within the planetary
boundary layer and within patches of turbulence
within the free atmosphere continually depletes the
kinetic energy of large-scale wind systems. Half the
energy would be gone within a matter of days were
there not some mechanism operating continually to
restore it. The ultimate source of this kinetic energy
is the release of potential energy through the sinking
of colder, denser air and the rising of warmer, less
dense air, which has the effect of lowering the atmos-
phere’s center of mass, flattening the potential tem-
perature surfaces, and weakening the existing
horizontal temperature gradients. A simple steady-
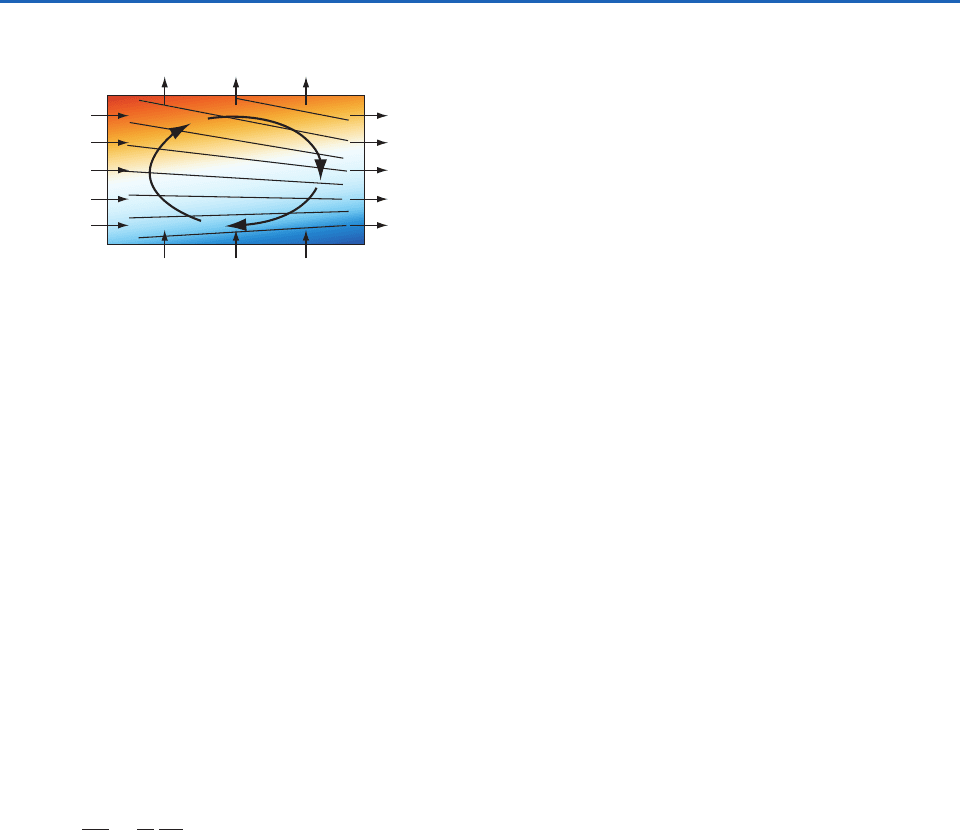
state laboratory analog of the kinetic energy cycle is
depicted schematically in Fig. 7.23.
In small-scale convection, the kinetic energy gen-
erated by the rising of buoyant plumes is imparted to
the vertical component of the motion. The upward
buoyancy force disturbs the balance of forces in the
vertical equation of motion, inducing vertical acceler-
ations. The vertical overturning that occurs in associ-
ation with large-scale atmospheric motions cannot be
viewed as resulting from buoyancy forces because, in
the primitive equations, the vertical equation of
29
William Ferrel (1817–1891) American scientist. A schoolteacher early in his career and later held positions at the Nautical Almanac
Office, the Coast Survey, and the Signal Office, which housed the Weather Bureau. Was the first to correctly deduce that gravitational tides
retard the earth’s rotation, and to explain the profound influence of the Coriolis force on winds and ocean currents that leads to
geostrophic flow, as articulated in Buys Ballot’s law.
P732951-Ch07.qxd 12/16/05 11:05 AM Page 298
7.4 The Atmospheric General Circulation 299
motion is replaced by the hydrostatic equation,
which has no vertical acceleration term. In large-
scale motions, kinetic energy is imparted directly to
the horizontal wind field. When warm air rises and
cold air sinks, the potential energy that is released
does work on the horizontal wind field by forcing it
to flow across the isobars from higher toward lower
pressure. In the equation for the time rate of change
of kinetic energy,
(7.42)
the cross-isobar flow V
is the one and only
source term. Flow across the isobars toward lower
pressure is prevalent close to the Earth’s surface,
where the dissipation term F
V is most intense.
Frictional drag is continually acting to reduce the
wind speed, causing it to be subgeostrophic, so that
the Coriolis force is never quite strong enough to
balance the pressure gradient force. The imbalance
drives a cross-isobar flow toward lower pressure
(Fig. 7.19), which maintains the kinetic energy and
the surface wind speed in the presence of frictional
dissipation. This process is represented by the second
term on the right-hand side of (7.42). It can be shown
that, in the integral over the entire mass of the
atmosphere, the generation of kinetic energy by the
V
term in (7.42) is equal to the release of
potential energy associated with the rising of warm
air and sinking of cold air.
V
dV
dt
d
dt
V
2
2
V F V
The trade winds in the lower branch of the Hadley
cell are directed down the pressure gradient, out of
the subtropical high pressure belt and into the belt of
low pressure at equatorial latitudes. That the winds in
the upper troposphere blow from west to east
implies that decreases with latitude at that level,
and hence that the poleward flow in the upper
branch of the Hadley cell is also directed down the
pressure gradient.
Closed circulations like the Hadley cell, which are
characterized by the rising of warmer, lighter air
and the sinking of colder, denser air and the preva-
lence of cross-isobar horizontal flow toward lower
pressure, release potential energy and convert it
to the kinetic energy of the horizontal flow.
Circulations with these characteristics are referred
to as thermally direct because they operate in the
same sense as the global kinetic energy cycle. Other
examples of thermally direct circulations in the
Earth’s atmosphere are the large-scale overturning
cells in baroclinic waves, monsoons and tropical
cyclones. Circulations such as the Ferrel cell, that
operate in the opposite sense, with rising of colder
air and sinking of warmer air are referred to as ther-
mally indirect.
Because thermally direct circulations are continu-
ally depleting the atmosphere’s reservoir of potential
energy, something must be acting to restore it.
Heating of the atmosphere by radiative transfer and
the release of the latent heat of condensation of water
vapor in clouds is continually replenishing the poten-
tial energy in two ways: by warming the atmosphere
in the tropics and cooling it at higher latitudes and by
heating the air at lower levels and cooling the air at
higher levels. The former acts to maintain the equa-
tor-to-pole temperature contrast on pressure surfaces,
and the latter expands the air in the lower tropo-
sphere and compresses the air in the upper tropo-
sphere, thereby lifting the air at intermediate levels,
maintaining the height of the atmosphere’s center of
mass against the lowering produced by thermally
direct circulations. Hence, the maintenance of large-
scale atmospheric motions requires both horizontal
and vertical heating gradients analogous to those in
the laboratory experiment depicted in Fig. 7.23. In
contrast, the maintenance of convection requires only
vertical heating gradients.
The most important heat source in the troposphere
is the release of latent heat of condensation that
occurs in association with precipitation. Latent heat
Heat
sink
Heat sink
Heat source
Heat
source
Fig. 7.23 Vertical cross section through a steady-state circu-
lation in the laboratory, driven by the distribution of heat
sources and heat sinks as indicated. The colored shading indi-
cates the distribution of temperature and density, with cooler,
denser fluid represented by blue. The sloping black lines repre-
sent pressure surfaces. Note that the flow is directed down the
horizontal pressure gradient at both upper and lower levels.
P732951-Ch07.qxd 12/16/05 11:05 AM Page 299
300 Atmospheric Dynamics
release tends to occur preferentially in rising air,
which becomes saturated as it cools adiabatically.
This preferential heating of the rising air tends to
maintain and enhance the horizontal temperature
gradients that drive thermally direct circulations, ren-
dering the motions more vigorous than they would
be in a dry atmosphere. Condensation heating plays
a supporting role as an energy source for extratropi-
cal cyclones and it plays a starring role in the ener-
getics of tropical cyclones.
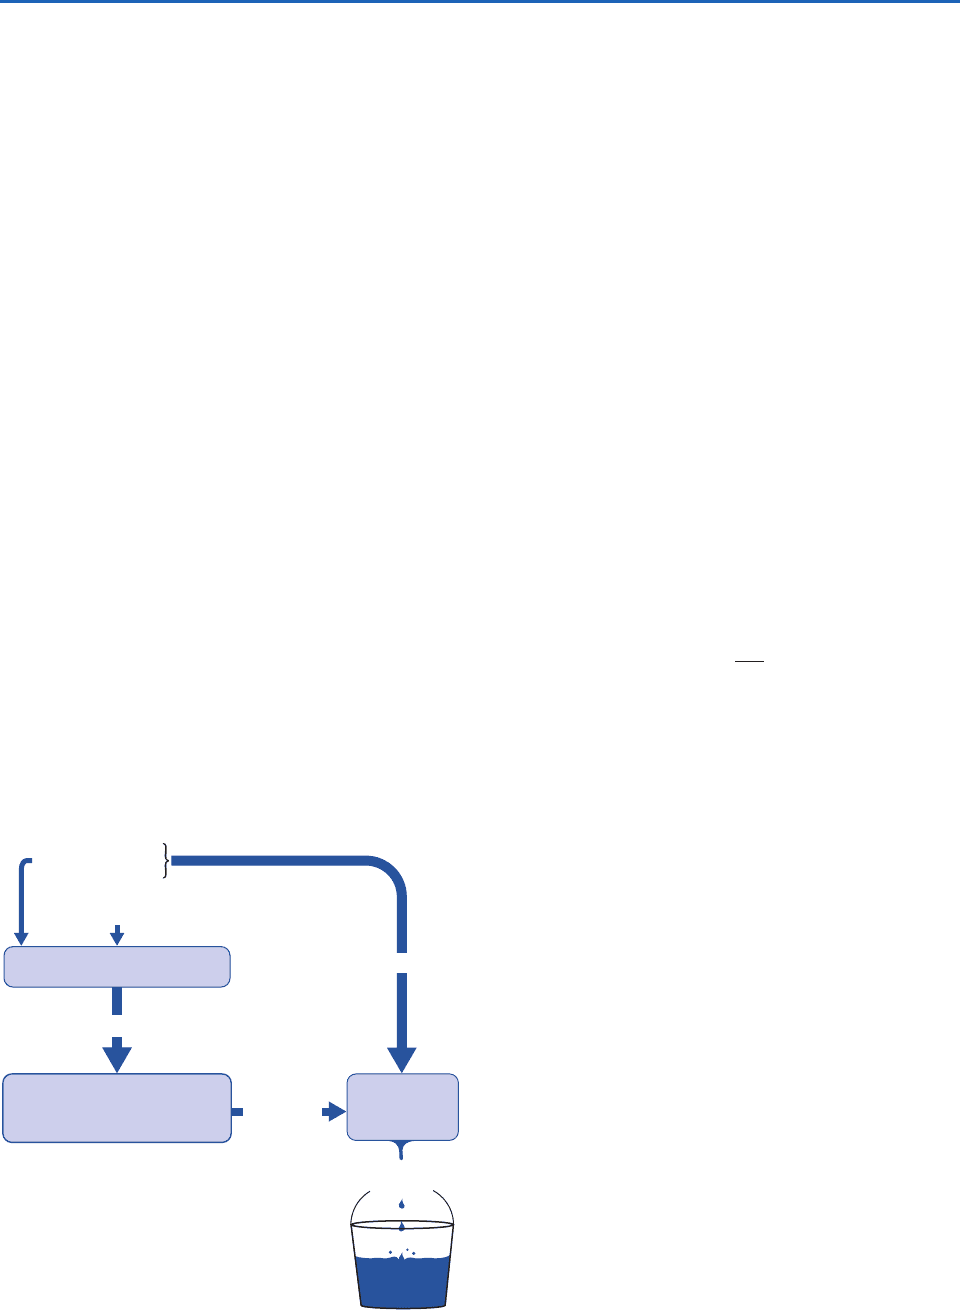
The kinetic energy cycle can be summarized in
terms of the flowchart presented in Fig. 7.24.
Potential energy generated by heating gradients is
converted to kinetic energy of both large-scale and
smaller scale convective motions. Kinetic energy is
drained from the large-scale reservoir by shear insta-
bility and flow over rough surfaces, both of which
generate small-scale turbulence and wave motions, as
discussed in Chapter 9. Kinetic energy in the small-
scale reservoir is transferred to smaller and smaller
scales until it becomes indistinguishable from ran-
dom molecular motions and thus becomes incorpo-
rated into the atmosphere’s reservoir of internal
energy. This final step is represented in Fig. 7.24 as “a
drop in the bucket” to emphasize that it is a small
contribution to the atmosphere’s vast internal energy
reservoir: only locally in regions of very strong winds
such as those near the centers of tropical cyclones
is frictional dissipation strong enough to affect the
temperature.
7.4.2 The Atmosphere as a Heat Engine
The primary tropospheric heat sources tend to be
concentrated within the planetary boundary layer, as
discussed in the previous chapter, and in regions of
heavy precipitation. The primary heat sink, radiative
cooling in the infrared, is more diffuse. In a gross sta-
tistical sense, the center of mass of the heating is
located at a slightly lower latitude and at a slightly
lower altitude than the center of mass of the cooling,
and is therefore at a somewhat higher temperature.
The atmospheric general circulation can be viewed as
a heat engine that is continually receiving heat at a
rate Q
H
at that higher temperature T
H
and rejecting
heat at a rate Q
C
at the lower temperature T
C
.By
analogy with (3.78) for the Carnot cycle, we can write
an expression for the thermal efficiency of the atmos-
pheric heat engine
(7.43)
where W is the rate at which work is done in generat-
ing kinetic energy in thermally direct circulations.
The integral of the kinetic energy generation term
V
over the mass of the atmosphere is esti-
mated to be 1–2W m
2
. Q
H
, the net incoming solar
radiation averaged over the surface of the Earth, is
240 W m
2
. Hence, based on this definition, the
thermal efficiency of the atmospheric heat engine is
less than 1%. In contrast to the situation in the
Carnot cycle, much of the heat transfer that takes
place within the atmosphere is irreversible. For
example, cold, polar air masses that penetrate into
the tropics are rapidly modified by the heat fluxes
from the underlying surfaces and radiative transfer.
It follows that relationships derived from the
reversible Carnot cycle are not strictly applicable to
the atmospheric heat engine.
7.5 Numerical Weather Prediction
Until the 1950s, day-to-day weather forecasting was
largely based on subjective interpretation of synop-
tic charts. From the time of the earliest synoptic
networks, it has been possible to make forecasts
by extrapolating the past movement of the major
#
W
Q
H
Thermally direct circulations
Shear
instability
Boundary
effects
Kinetic energy
of random
molecular motions
Kinetic energy
of large-scale motions
Convection
Horizontal
heating gradients
Low-level heating
High-level cooling
Available potential energy
Energy
cascade
Kinetic energy
of small-scale
motions
Fig. 7.24 Schematic flow diagram for the kinetic energy
cycle in the atmospheric general circulation.
P732951-Ch07.qxd 12/16/05 11:05 AM Page 300

7.5 Numerical Weather Prediction 301
features on the charts. As forecasters began to
acquire experience from a backlog of past weather
situations, they were able to refine their forecasts
somewhat by making use of historical analogs of
the current weather situation, without reference to
the underlying dynamical principles introduced in
this chapter. However, it soon became apparent
that the effectiveness of this so-called “analog tech-
nique” is inherently limited by the unavailability of
very close analogs in the historical records. On a
global basis the three-dimensional structure of the
atmospheric motion field is so complicated that a
virtually limitless number of distinctly different
flow patterns are possible, and hence the probabil-
ity of two very similar patterns being observed, say,
during the same century, is extremely low. By 1950
the more advanced weather forecasting services
were already approaching the limit of the skill that
could be obtained strictly by the use of empirical
techniques.
The earliest attempts at numerical weather predic-
tion, based on the methodology described in Section
7.2.9, date back to the 1950s and primitive equation
models came into widespread use soon afterward. In
comparison to the models developed in these pio-
neering efforts, today’s numerical weather prediction
models have much higher spatial resolution and con-
tain a much more accurate and detailed representa-
tion of the physical processes that enter into the
primitive equations. The increase in the physical
complexity of the models would not have been possi-
ble without the rapid advances in computer technol-
ogy that have taken place during the past 50 years: to
make a single forecast for 1 day in advance by run-
ning current operational models on a computer of
the type available 50 years ago would require millen-
nia of computer time! The payoff of this monumental
effort is the remarkable improvement in forecast
skill documented in Fig. 1.1.
The initial conditions for modern numerical
weather prediction are based on an array of global
observations, an increasing fraction of which are
remote measurements from radiometers carried on
board satellites. In situ observations include surface
reports, radiosonde data, and flight level data from
commercial aircraft. In situ measurements of pres-
sure, wind, temperature, and moisture are combined
with satellite-derived radiances in dynamically con-
sistent, multivariate four-dimensional data assimila-
tion systems like the one described in the Appendix
of chapter 8 on the book web site.
The global observing system describes only the
resolvable scales of atmospheric variability, and the
analysis is subject to measurement errors even at
the largest scales. The data assimilation scheme is
designed to correct for the systematic errors in the
observations and to minimize the impact of random
errors on the forecasts. The errors in the initial con-
ditions for numerical weather prediction have been
continually shrinking in response to a host of incre-
mental improvements in the observing and data
assimilation systems. Nevertheless, there will always
remain some degree of uncertainty (or errors) in
the initial conditions and, due to the nonlinearity
of atmospheric motions, these errors inevitably
amplify with time. Beyond some threshold forecast
interval the forecast fields are, on average, no more
like the observed fields against which they are veri-
fied than two randomly chosen observed fields for
the same time of year are like one another. For the
extratropical atmosphere this so-called limit of
deterministic predictability is believed to be on the
order of 2 weeks.
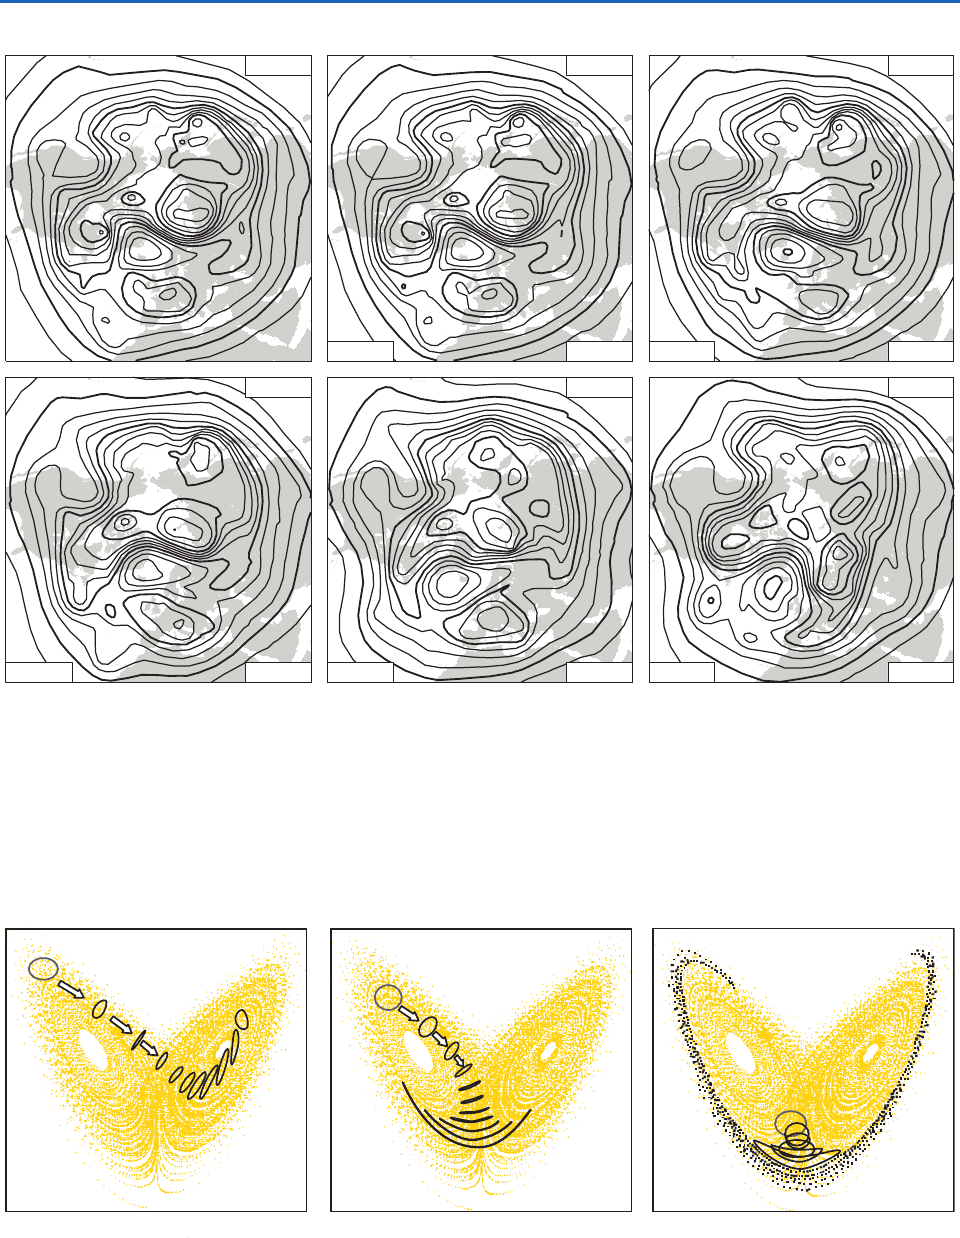
Figure 7.25 shows a set of forecasts, made on suc-
cessive days, for the same time, together with the ver-
ifying analysis (i.e., the corresponding “observed”
fields for the time that matches the forecast). This
particular example was chosen because the level of
skill is typical of wintertime forecasts made with
today’s state-of-the art numerical weather prediction
systems. Forecast skill declines monotonically as the
forecast interval lengthens. The 1- and 3-day fore-
casts replicate the features in the verifying analysis
with a high degree of fidelity; the 7-day forecast still
captures all the major features in the field, but misses
many of the finer details. The 10-day forecast is
worthless over much of the hemisphere, but even at
this long lead time, the more prominent features in
the verifying analysis are already apparent over the
Atlantic, European, and western North American
sectors.
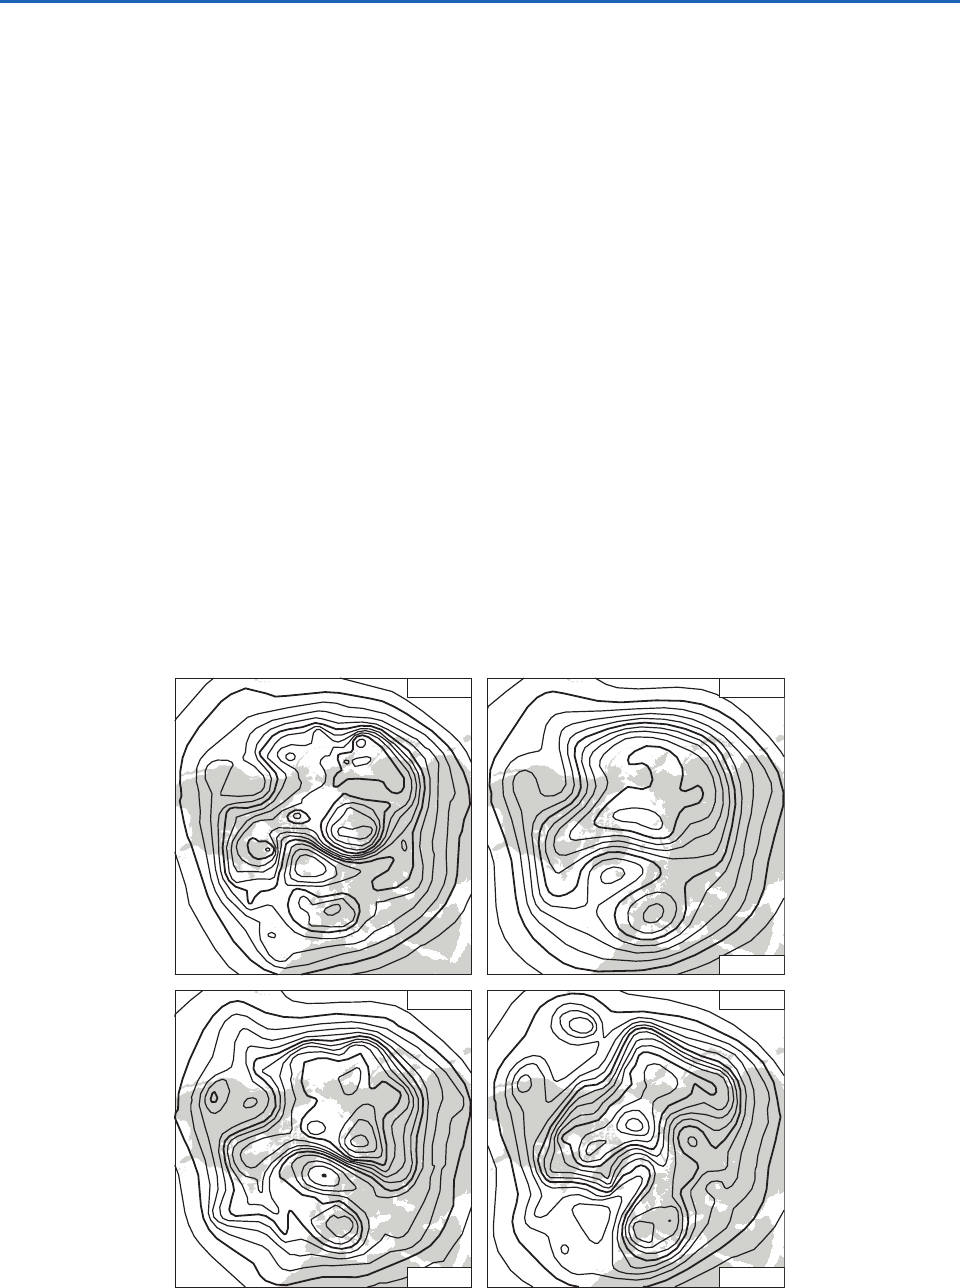
The increase in the uncertainty of the forecasts
with increasing forecast interval is illustrated in
Fig. 7.26 in the context of a simplified forecast
model based on the Lorenz attractor described in
Box 1.1. In the first experiment shown in the left
panel, the initial conditions that make up the
ensemble lie within a region of the attractor for
which the forecast uncertainty actually declines for
a while as the numerical integration proceeds,
as evidenced by the decreasing size of successive
forecast ellipses. In the second experiment (middle
P732951-Ch07.qxd 12/16/05 11:05 AM Page 301
302 Atmospheric Dynamics
L
H
H
ANALYSISANALYSISANALYSIS
L
DAY 1
8m 99.7%
L
DAY 3
36m 95.3%
H
L
DAY 5
53m 89.8%
H
DAY 7
81m 76.1%
DAY 10
109m 56.8%
H
H
H
L
L
L
L
L
L
L
H
H
H
L
L
L
L
L
L
L
H
H
H
H
H
L
L
L
L
L
H
H
H
L
L
L
L
L
L
L
H
H
H
L
L
L
L
L
H
H
H
H
L
L
L
L
L
L
Fig. 7.25 Forecasts and verifying analysis of the northern hemisphere 500-hPa height field for 00 UTC February 24, 2005. The
number printed in the lower left corner is the root mean squared error and the percentage shown in the lower right corner of each
panel is the anomaly correlation, a measure of the hemispherically averaged skill of the forecast. [Courtesy of Adrian J. Simmons,
European Centre for Medium Range Weather Forecasts (ECMWF).]
Fig. 7.26 Three sets of ensemble forecasts performed using the highly simplified three-variable representation of the atmosphere
described in Box 1.1. The time-dependent solution of the governing governing equations traces out the three-dimensional geo-
metric pattern, referred to as the Lorenz attractor. Each panel represents a numerical experiment in which the initial conditions are
the ensemble of points that lie along the purple ellipse and the forecasts at successive forecast times are represented by the
“down-stream” black ellipses. Each point on the ellipse of initial conditions is uniquely identified with a point on each of the suc-
cessive forecast ellipses. [Courtesy of T. N. Palmer, ECMWF.]
P732951-Ch07.qxd 12/16/05 11:05 AM Page 302
7.5 Numerical Weather Prediction 303
panel), successive forecast ellipses widen markedly
as the points representing the individual forecasts
that make up the ensemble approach the bottom of
the attractor and spread out into the two separate
loops. In the third experiment (right panel) the
rapid increase in the uncertainty of the forecasts
begins earlier in the forecast interval, and the
points along the bottom of the attractor spread rap-
idly around their respective loops as the forecast
proceeds. Hence the predictability of this simple
model is highly dependent on the initial state.
Ensemble forecasts carried out with the full set of
governing equations for large-scale atmospheric
motions provide a means of estimating the uncertain-
ties inherent in weather forecasts at the time when
they are issued. The results are not as easy to interpret
as those for the idealized model based on the Lorenz
attractor, but they are nonetheless informative. As in
the idealized experiments, the ensemble forecasts also
provide an indication of the range of atmospheric
states that could develop out of the observed initial
conditions. In current operational practice, different
forecast models, as well as perturbed initial conditions,
are used to generate different members of the ensem-
ble. At times when the entire hemispheric circulation
is relatively predictable, members of the ensemble do
not diverge noticeably from one another until rela-
tively far into the forecast. Often the errors grow most
rapidly over one particular sector of the hemisphere
due to the presence of local instability in the hemi-
spheric flow pattern. The rate of divergence of the
individual members of the ensemble provides a meas-
ure of the credibility of the forecasts in various sectors
of the hemisphere and the length of the time interval
over which the forecasts can be trusted.
Figure 7.27 shows 7-day ensemble forecasts for a
typical winter day. The mean is considerably smoother
than its counterpart in Fig. 7.25 because it represents
an average over many individual forecasts. Some of
the individual forecasts, like the one in the lower left
panel, capture the features in the verifying analysis
with remarkable fidelity. Unfortunately, there is no
way of identifying these highly skillful forecasts at the
time that the ensemble forecast is made.
ANALYSIS
DAY 7
MEAN
H
DAY 7
BEST
DAY 7
WORST
L
L
L
L
L
L
L
H
H
H
H
L
H
H
H
H
L
L
L
L
H
H
H
L
L
L
L
L
L
L
H
H
L
L
L
Fig. 7.27 As in Fig. 7.25 but for the 7-day forecasts generated by the ensemble forecasting system in current use at ECMWF.
Mean is the average of the 50 members of the ensemble Best and Worst forecasts are selected based on anomaly correlations with
the verifying analysis. [Courtesy of Adrian J. Simmons, ECMWF.]
P732951-Ch07.qxd 12/16/05 11:05 AM Page 303
