Voet D., Voet Ju.G. Biochemistry
Подождите немного. Документ загружается.

these, ⬃1200 have already been observed, with around
half of the proteins of known structure belonging to only
20 fold groups.
Although there are numerous ways in which domain
structures might be categorized (see, e.g., Section 8-3C),
perhaps the simplest way to do so is to classify them as
␣ domains (containing secondary structural elements that
are exclusively ␣ helices),  domains (containing only
 sheets), and ␣/ domains (containing both ␣ helices and
 sheets).The ␣/ domain category may be further divided
into two main groups: ␣/ barrels and open  sheets. In the
following paragraphs we describe some of the most com-
mon folds in each of these domain categories.
f. ␣ Domains
We are already familiar with a fold that contains only
␣ helices: the globin fold, which contains 8 helices in two
layers and occurs in myoglobin (Fig. 8-39) and in both the
␣ and  chains of hemoglobin (Section 10-2B). In another
common all-␣ fold, two ␣␣ motifs combine to form a 4-helix
bundle such as occurs in cytochrome b
562
(Fig. 8-47a, oppo-
site). The helices in this fold are inclined such that their
contacting side chains intermesh and are therefore out of
contact with the surrounding aqueous solution. They are
consequently largely hydrophobic. The 4-helix bundle is a
relatively common fold that occurs in a variety of proteins.
However, not all of them have the up-down-up-down
topology (connectivity) of cytochrome b
562
. For example,
human growth hormone is a 4-helix bundle with up-up-
down-down topology (Fig. 8-47b). The successive parallel
helices in this fold are, of necessity, joined by longer loops
than those joining successive antiparallel helices.
Different types of ␣ domains occur in transmembrane
proteins. We study these proteins in Section 12-3A.
g.  Domains
 Domains contain from 4 to ⬎10 predominantly an-
tiparallel  strands that are arranged into two sheets that
pack against each other to form a  sandwich. For example,
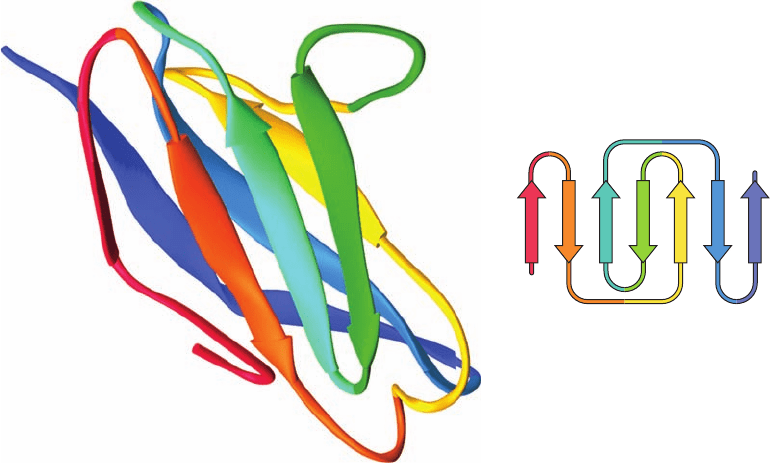
the immunoglobulin fold (Fig. 8-48), which forms the basic
domain structure of most immune system proteins (Section
35-2Be), consists of a 4-stranded antiparallel  sheet in
face-to-face contact with a 3-stranded antiparallel  sheet.
Note that the strands in the two sheets are not parallel to
one another, a characteristic of stacked  sheets. The side
chains between the two stacked  sheets are out of contact
with the aqueous medium and thereby form the domain’s
hydrophobic core. Since successive residues in a  strand
alternately extend to opposite sides of the  sheet (Fig.
8-17), these residues are alternately hydrophobic and hy-
drophilic.
The inherent curvature of  sheets (Section 8-1C) often
causes sheets of more than 6 strands to roll up into  barrels.
Indeed,  sandwiches may be considered to be flattened
 barrels. Several different  barrel topologies have been
observed, most commonly:
1. The up-and-down  barrel, which consists of 8 suc-
cessive antiparallel  strands that are arranged like the
staves of a barrel.An example of an up-and-down  barrel
Section 8-3. Globular Proteins 251
N
C
Figure 8-48 The immunoglobulin fold. The X-ray structure of
the N-terminal domain of the human immunoglobulin fragment
Fab New shows its immunoglobulin fold.The peptide backbone
of this 103-residue domain is drawn in ribbon form colored in
rainbow order from N-terminus (red) to C-terminus (blue) with
its  strands represented by flat arrows pointing toward the
C-terminus.The inset is the topological diagram of the
immunoglobulin fold showing the connectivity of its stacked
4-stranded and 3-stranded antiparallel  sheets. [Based on an
X-ray structure by Roberto Poljak, Johns Hopkins School of
Medicine. PDBid 7FAB.]
JWCL281_c08_221-277.qxd 2/23/10 1:58 PM Page 251
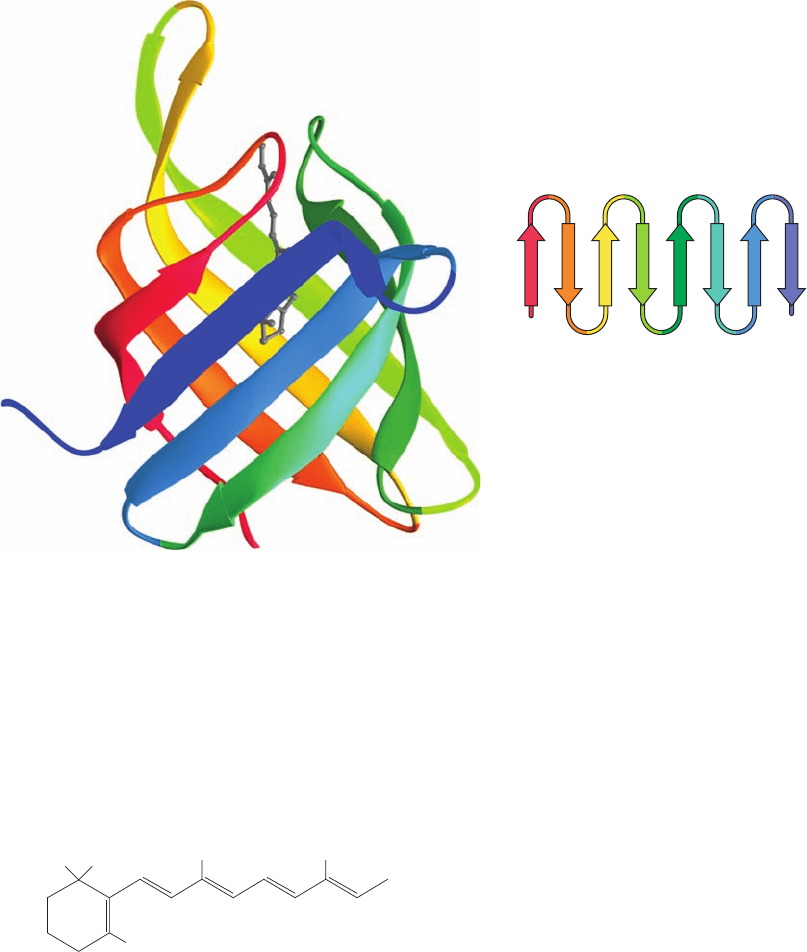
occurs in retinol binding protein (Fig 8-49), which functions
to transport the nonpolar visual pigment precursor retinol
(vitamin A) in the bloodstream:
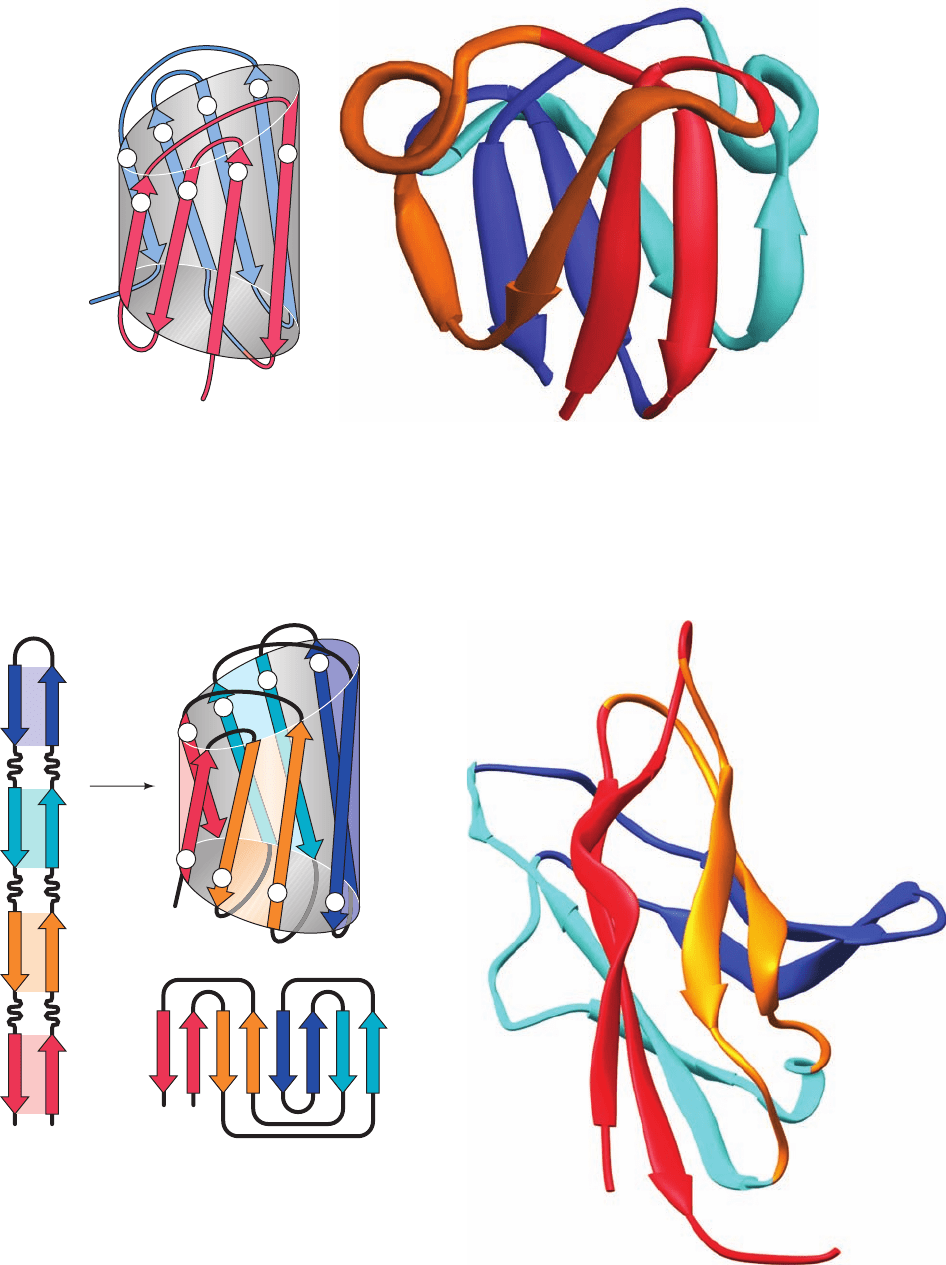
2. A fold consisting of two Greek key motifs, which
thereby constitutes an alternative way of connecting the
strands of an 8-stranded antiparallel  barrel. Figure 8-50
indicates how two Greek key motifs in the C-terminal do-
main of the eye lens protein ␥-B crystallin are arranged to
form a  barrel.
3. The jelly roll or Swiss roll barrel (which is named for
its topological resemblance to these rolled up pastries), in
which a 4-segment  hairpin is rolled up into an 8-stranded
antiparallel  barrel of yet different topology, as is dia-
grammed in Fig. 8-51a. The X-ray structure of the enzyme
peptide-N
4
-(N-acetyl--D-glucosaminyl)asparagine ami-
dase F contains a domain consisting of a jelly roll barrel
(Fig. 8-51b).
CH
3
CH
3
CH
2
OH
CH
3
H
3
C
CH
3
Retinol
h. ␣/ Barrels
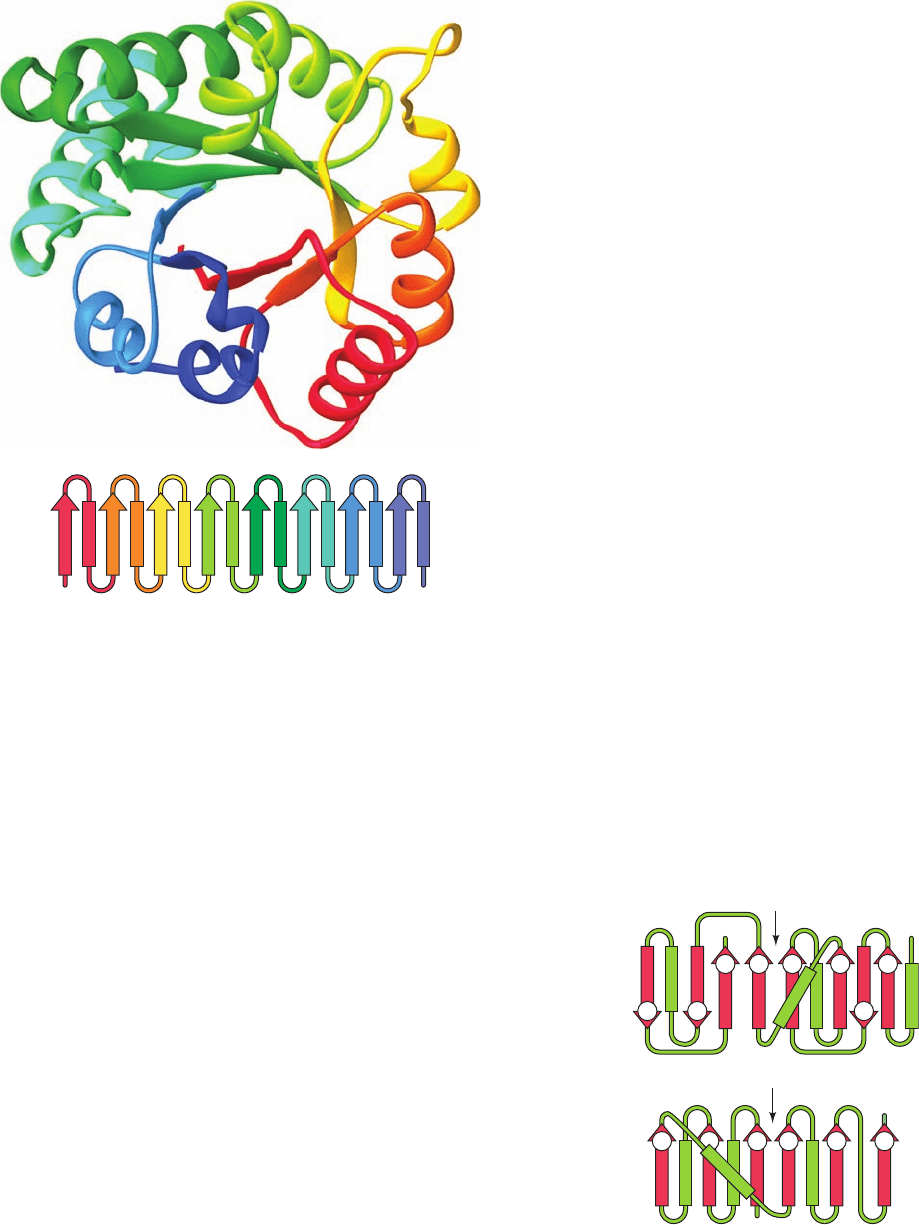
In ␣/ domains, a central parallel or mixed  sheet is
flanked by ␣ helices. The ␣/ barrel, which is diagrammed
in Fig. 8-19b, is a remarkably regular structure that consists
of 8 tandem ␣ units (essentially 8 overlapping ␣ mo-
tifs) wound in a right-handed helical sense to form an inner
8-stranded parallel  barrel concentric with an outer barrel
of 8 ␣ helices. Each  strand is approximately antiparallel
to the succeeding ␣ helix and all are inclined at around the
same angle to the barrel axis. Figure 8-52 shows the X-ray
structure of chicken triose phosphate isomerase (TIM), de-
termined by David Phillips, which consists of an ␣/ barrel.
This is the first known structure of an ␣/ barrel, which is
therefore also called a TIM barrel.
The side chains that point inward from the ␣ helices in-
terdigitate with the side chains that point outward from the
 strands. A large fraction (⬃40%) of these side chains are
those of the branched aliphatic residues Ile, Leu, and Val.
The side chains that point inward from the  strands tend
to be bulky and hence fill the core of the  barrel (contrary
to the impression that Figs. 8-19b and 8-52 might provide,
␣/ barrels, with one known exception, do not have hollow
cores). Those side chains that fill the ends of the barrel are
in contact with solvent and hence tend to be polar, whereas
those in its center are out of contact with solvent and are
therefore nonpolar. Thus, ␣/ barrels have four layers of
polypeptide backbone interleaved by regions of hydrophobic
252 Chapter 8. Three-Dimensional Structures of Proteins
N
C
Figure 8-49 Retinol binding protein. Its X-ray structure shows
its up-and-down  barrel (residues 1⫺142 of this 182-residue
protein). Its peptide backbone is drawn in ribbon form colored in
rainbow order from N-terminus (red) to C-terminus (blue). Note
that each  strand is linked via a short loop to its clockwise-adjacent
strand as seen from the top. The protein’s bound retinol molecule
is represented by a gray ball-and-stick model.The inset is the
protein’s topological diagram. [Based on an X-ray structure by T.
Alwyn Jones, Uppsala University, Uppsala, Sweden. PDBid
1RBP.]
JWCL281_c08_221-277.qxd 2/23/10 1:59 PM Page 252
Section 8-3. Globular Proteins 253
Figure 8-50 X-ray structure of the C-terminal domain of
bovine ␥-B crystallin. (a) A topological diagram showing how its
two Greek key motifs are arranged in a  barrel. One Greek key
motif (red) is formed by  strands 1 to 4 and the other (blue) is
formed by  strands 5 to 8. [After Branden, C. and Tooze, J.,
Introduction to Protein Structure (2nd ed.), p. 75, Garland (1999).]
(b) The 83-residue peptide backbone displayed in ribbon form.
N
C
4
1
2
3
8
7
6
5
NC
18
72
36
54
fold
4
7
2
1
8
5
6
3
7812 3456
NC
Here the members of an antiparallel pair of  strands in a Greek
key motif are colored alike with the N-terminal Greek key colored
red (strands 1 & 4) and orange (2 & 3) and the C-terminal Greek
key colored blue (5 & 8) and cyan (6 & 7).The N-terminal
domain of this two-domain protein is nearly superimposable on
its C-terminal domain. [Based on an X-ray structure by Tom
Blundell, Birkbeck College, London, U.K. PDBid 4GCR.]
Figure 8-51 X-ray structure of the enzyme peptide-N
4
-
(N-acetyl--
D-glucosaminyl)asparagine amidase F from
Flavobacterium meningosepticum. (a) A diagram indicating how
an 8-stranded  barrel is formed by rolling up a 4-segment 
hairpin.A topological diagram of the jelly roll barrel is also shown.
[After Branden, C. and Tooze, J., Introduction to Protein Structure
(2nd ed.), pp. 77–78, Garland (1999).] (b) A ribbon diagram of the
domain formed by residues 1 to 140 of this 314-residue enzyme.
Here the two  strands in each segment of the  hairpin are
colored alike, with strands 1 & 8 (the N- and C-terminal strands)
red, strands 2 & 7 orange, strands 3 & 6 cyan, and strands 4 & 5
blue. [Based on an X-ray structure by Patrick Van Roey, New York
State Department of Health,Albany, New York. PDBid 1PNG.]
(a)
(b)
(a)
(b)
JWCL281_c08_221-277.qxd 2/23/10 1:59 PM Page 253
side chains. In contrast, both ␣ domains and  domains
consist of two layers of polypeptide backbone sandwiching
a hydrophobic core.
Around 10% of known enzyme structures contain an
␣/ barrel, making it the most common fold assumed by
enzymes. Moreover, nearly all known ␣/ barrel proteins
are enzymes. Intriguingly, the active sites of ␣/ barrel en-
zymes are almost all located in funnel-shaped pockets
formed by the loops that link the C-termini of the  strands
to the succeeding ␣ helices and hence surround the mouth
of the  barrel, an arrangement that has no obvious struc-
tural rationale. Thus, despite the observation that few ␣/
barrel proteins exhibit significant sequence homology, it
has been postulated that all of them descended from a
common ancestor and are therefore (distantly) related by
divergent evolution. On the other hand, it has been argued
that the ␣/ barrel is structurally so well suited for its enzy-
matic roles that it independently arose several times and
hence that ␣/ enzymes are related by convergent evolu-
tion (i.e., nature has discovered the same fold on several
occasions). Convincing evidence supporting either view
has not been forthcoming, so that the nature of the evolu-
tionary relationships among the ␣/ barrel enzymes re-
mains an open question.
i. Open  Sheets
We have previously encountered examples of an open 
sheet in the structures of carboxypeptidase A (Fig. 8-19a)
and the N-terminal domain of glyceraldehyde-3-phosphate
dehydrogenase (Fig. 8-45). Their topological diagrams are
drawn in Fig. 8-53.The X-ray structures and topological di-
agrams of two other such proteins, those of the enzymes
lactate dehydrogenase (N-terminal domain) and adenylate
kinase, are shown in Fig. 8-54. Such folds consist of a cen-
tral parallel or mixed  sheet flanked on both sides by ␣ he-
lices that form the right-handed crossover connections be-
tween successive parallel  strands (Fig. 8-20b).The strands
of such a  sheet do not follow their order in the peptide
sequence. Rather, the  sheet has a long crossover that re-
verses the direction of the succeeding section of sheet and
turns it upside down, thereby putting its helical crossovers
on the opposite side of the sheet from those of the preced-
ing section (Fig. 8-55). Such assemblies are therefore also
known as doubly wound sheets (in contrast to singly
wound ␣/ barrels, whose helices are all on the same side of
their  sheets). Doubly wound sheets consist of three lay-
ers of polypeptide backbone interspersed by regions of hy-
drophobic side chains (in contrast to four such layers for
␣/ barrels and two for ␣ domains and  domains). Note
that both types of domains containing parallel  sheets are
hydrophobic on both sides of the sheet, whereas antiparal-
lel sheets are hydrophobic on only one side.This additional
stabilization of parallel  sheets probably compensates for
the reduced strength of their nonlinear hydrogen bonds
relative to the linear hydrogen bonds of antiparallel 
sheets (Fig. 8-16).
254 Chapter 8. Three-Dimensional Structures of Proteins
Figure 8-53 Topological diagrams of (a) carboxypeptidase A
and (b) the N-terminal domain of glyceraldehyde-3-phosphate
dehydrogenase. The X-ray structures of these proteins are
diagrammed in Figs. 8-19a and 8-45.The thin black vertical
arrows mark the proteins’ topological switch points.
Figure 8-52 X-ray structure of the 247-residue enzyme triose
phosphate isomerase (TIM) from chicken muscle. The protein is
viewed approximately along the axis of its ␣/ barrel.The
peptide backbone is shown as a ribbon diagram with its successive
␣ units colored, from N- to C-terminus, in rainbow order, red to
blue. The inset is its topological diagram (with ␣ helices
represented by rectangles).Two other views of this protein are
drawn in Figures 8-19b and 8-19c [Based on an X-ray structure
by David Phillips, Oxford University, U.K. PDBid 1TIM.]
4123 8567
CN
65
C
N
12
2
N
3 1
67
C
8
(a)
(b)
5 4
43
JWCL281_c08_221-277.qxd 2/23/10 1:59 PM Page 254
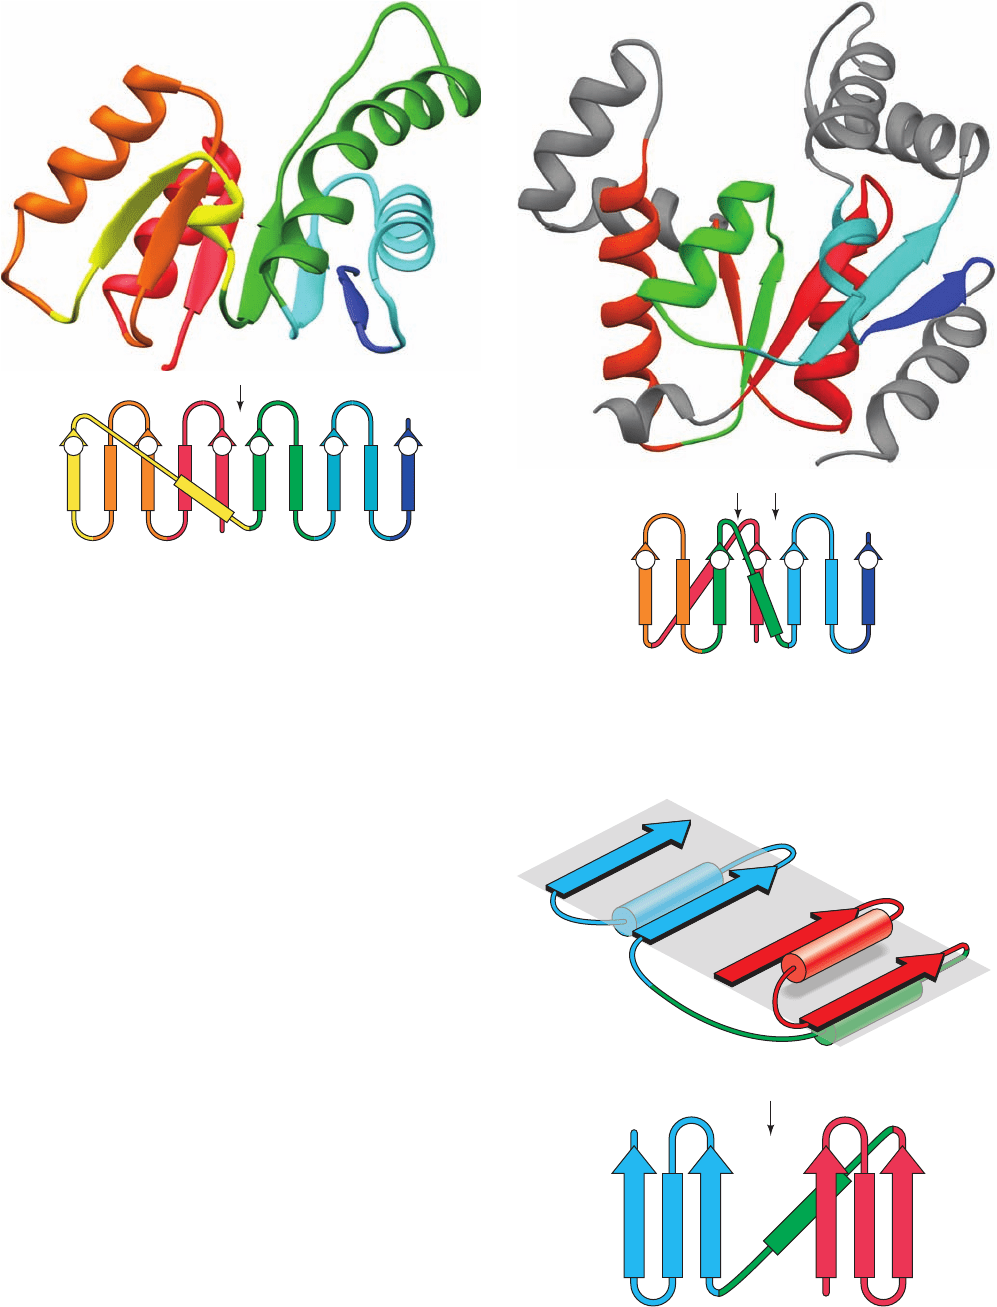
There are few geometric constraints on the number of
strands in open  sheets; they have been observed to con-
tain from 4 to 10  strands, with 6  strands being the most
common. Since the position where the chain reverses its
winding direction, the so-called topological switch point,
can occur between any consecutive ␣ helix and  strand,
doubly wound sheets can have many different folds. More-
over, some  strands may run in an antiparallel direction to
yield mixed sheets (e.g., carboxypeptidase A; Figs. 8-19a
and 8-53a), and in several instances, there is more than one
topological switch point (e.g., adenylate kinase; Fig. 8-54b).
The open  sheet is the most common domain structure
that occurs in globular proteins. Moreover, nearly all such
Section 8-3. Globular Proteins 255
Figure 8-54 X-ray structures of open  sheet–containing
enzymes. (a) Dogfish lactate dehydrogenase, N-terminal domain
(residues 20–163 of this 330-residue protein), and (b) porcine
adenylate kinase (195 residues).The peptide backbones are
shown as ribbon diagrams with successive ␣ units colored, from
N- to C-terminus, in rainbow order, red to blue. In Part b,
structural elements that are not components of the open  sheet
are gray. The insets are topological diagrams of these proteins,
with the thin black vertical arrows marking their topological
Figure 8-55 Doubly wound sheets. (a) A schematic diagram of
a doubly wound sheet indicating how the long crossover (green)
between its N- and C-terminal segments (red and blue) reverses
the direction of the sheet’s C-terminal segment and places its ␣
helical crossover connections on the opposite side of the sheet.
(b) The corresponding topological diagram, with the thin black
vertical arrow marking the topological switch point. [After
Branden, C. and Tooze, J., Introduction to Protein Structure
(2nd ed.), p. 49, Garland (1999).]
2 4 5 6
C
1
N
3
12 5
C
N
43
N
C
α
3,4
β
4
β
3
β
1
β
2
α
1,2
α
2,3
(b)
N
C
β
4
β
3
β
1
β
2
α
2,3
α
1,2
α
3,4
(a)
switch points. [Based on X-ray structures by (a) Michael
Rossmann, Purdue University, and (b) Georg Schulz, Institut für
Organische Chemie und Biochemie, Freiburg, Germany. PDBids
(a) 6LDH and (b) 3ADK.]
(a)
(b)
JWCL281_c08_221-277.qxd 2/23/10 1:59 PM Page 255

proteins are enzymes, many of which bind mono- or dinu-
cleotides. In fact, the fold exemplified by lactate dehydro-
genase (LDH; Fig. 8-54a) is known as the dinucleotide-
binding fold or Rossmann fold (after Michael Rossmann,
who first pointed out its significance). This is because
mononucleotide units are commonly bound by ␣␣
units, of which LDH (which binds the dinucleotide NAD
⫹
)
has two. In some proteins, the second ␣ helix in a ␣␣
unit is replaced by a length of nonhelical polypeptide. This
occurs, for example, between the 5 and 6 strands of
glyceraldehyde-3-phosphate dehydrogenase (Figs. 8-45
and 8-53b), which also binds NAD
⫹
.
At the topological switch point of an open  sheet, the
loops emerging from the C-terminal ends of the flanking 
strands go to opposite sides of the sheet and thereby form
a crevice between them. In nearly all of the ⬎100 known
structures of open  sheet–containing enzymes, as Carl-
Ivar Brändén first pointed out, this crevice forms at least
part of the enzyme’s active site.Thus the active sites of both
␣/ barrels and the open  sheet enzymes are formed by
loops emanating from the C-terminal ends of the  strands.
In contrast, the active sites of enzymes that have other
types of domain structures exhibit no apparent regularities
in the positions of their active sites.
C. Structural Bioinformatics
In Section 7-4, we discussed the rapidly developing field of
inquiry known as bioinformatics as it applies to the se-
quences of proteins and nucleic acids, that is, how sequence
alignments are determined and how phylogenetic trees are
generated. An equally important aspect of bioinformatics,
which we discuss below, is how macromolecular structures
are displayed and compared.
a. The Protein Data Bank
The atomic coordinates of most known macromolecular
structures are archived in the Protein Data Bank (PDB).
Indeed, most scientific journals that publish macromolecu-
lar structures require that authors deposit their structure’s
coordinates in the PDB. The PDB contains the atomic co-
ordinates of ⬃70,000 macromolecular structures (proteins,
nucleic acids, and carbohydrates as determined by X-ray
and other diffraction-based techniques, NMR, and electron
microscopy) and is growing exponentially at a rate that is
presently ⬃7500 structures per year. The PDB’s Website
(URL), from which these coordinates are publicly avail-
able, is listed in Table 8-4.
Each independently determined structure in the PDB is
assigned a unique four-character identifier (its PDBid) in
which the first character must be a digit (1–9) and no distinc-
tion is made between uppercase and lowercase letters (e.g.,
1 MBO is the PDBid of the myoglobin structure illustrated
in Fig. 8-39c, although PDBids do not necessarily have a re-
lationship to the corresponding macromolecule’s name). A
coordinate file begins with information that identifies/de-
scribes the macromolecule, the date the coordinate file was
deposited, its source (the organism from which it was ob-
tained),the author(s) who determined the structure,and key
journal references. The file continues with a synopsis of how
the structure was determined together with indicators of its
accuracy and information that could be helpful in its inter-
pretation, such as a description of its symmetry and which
residues, if any, were not observed. The sequences of the
256 Chapter 8. Three-Dimensional Structures of Proteins
Table 8-4 Structural Bioinformatics Websites (URLs)
Structural Databases
Protein Data Bank (PDB): http://www.rcsb.org/
Nucleic Acid Database: http://ndbserver.rutgers.edu/
Molecular Modeling Database (MMDB): http://www.ncbi.nlm.nih.gov/Structure/MMDB/mmdb.shtml
Most Representative NMR Structure in an Ensemble: http://www.ebi.ac.uk/msd-srv/olderado
PISA (Protein Interfaces, Surfaces and Assemblies): http://www.ebi.ac.uk/msd-srv/prot_int/pistart.html
Proteopedia: http://www.proteopedia.org
Molecular Graphics Programs/Plug-ins
Cn3D: http://www.ncbi.nlm.nih.gov/Structure/CN3D/cn3d.shtml
FirstGlance: http://molvis.sdsc.edu/fgij/
Jmol: http://jmol.sourceforge.net/
KiNG: http://kinemage.biochem.duke.edu/software/king.php
Swiss-Pdb Viewer: http://spdv.vital-it.ch
Structural Classification Algorithms
CATH (class, architecture, topology, and homologous superfamily): http://www.cathdb.info/index.html
CE (combinatorial extension of optimal pathway): http://cl.sdsc.edu/
Pfam (protein families): http://pfam.sanger.ac.uk/ or http://pfam.janelia.org/
SCOP (structural classification of proteins): http://scop.mrc-lmb.cam.ac.uk/scop/
VAST (vector alignment search tool): http://www.ncbi.nlm.nih.gov/Structure/VAST/
JWCL281_c08_221-277.qxd 2/23/10 1:59 PM Page 256
structure’s various chains are then listed together with the
descriptions and formulas of its so-called HET (for hetero-
gen) groups, which are molecular entities that are not among
the “standard” amino acid or nucleotide residues (e.g., or-
ganic molecules such as the heme group, nonstandard
residues such as Hyp, metal ions, and bound water mole-
cules). The positions of the structure’s secondary structural
elements and its disulfide bonds are then provided.
The bulk of a PDB file consists of a series of ATOM (for
“standard” residues) and HETATM (for heterogens)
records (lines), each of which provides the coordinates for
one atom in the structure. An ATOM or HETATM record
identifies its corresponding atom according to its serial
number (usually just its sequence in the list), atom name
(e.g., C and O for an amino acid residue’s carbonyl C and O
atoms, CA and CB for C
␣
and C

atoms, N1 for atom N1 of
a nucleic acid base, C4* for atom C4¿ of a ribose or deoxyri-
bose residue), residue name [e.g., PHE, G (for a guanosine
residue), HEM (for a heme group), MG (for an Mg
2⫹
ion),
and HOH (for a water molecule)], chain identifier (e.g.,A,
B, C, etc., for structures consisting of more than one chain,
whether or not the chains are chemically identical), and the
residue sequence number in the chain. The record then
continues with the atom’s Cartesian (orthogonal) coordi-
nates (X,Y, Z), in angstroms relative to an arbitrary origin,
the atom’s occupancy (which is the fraction of sites that ac-
tually contain the atom in question, a quantity that is usu-
ally 1.00 but, for groups that have multiple conformations
or for molecules/ions that are only partially bound to a pro-
tein, may be a positive number less than 1.00), and its
isotropic temperature factor (a quantity that is indicative
of the atom’s thermal motion, with larger numbers denot-
ing a greater degree of motion). The ATOM records are
listed in the order of the residues in a chain. For NMR-
based structures, the PDB file contains a full set of ATOM
and HETATM records for each member of the ensemble
of structures that were calculated in solving the structure
(Section 8-3A; the most representative member of such a
coordinate set can be obtained from http://www.ebi.ac.uk/
msd-srv/olderado). PDB files usually end with CONECT
(connectivity) records, which denote the nonstandard
connectivities between ATOMs such as disulfide bonds
and hydrogen bonds as well as connectivities between
HETATMs.
A particular PDB file may be located according to its
PDBid or, if this is unknown, by searching with a variety of
criteria including a protein’s name, its source, the author(s),
keywords, and/or the experimental technique used to de-
termine the structure. Selecting a particular macromole-
cule in the PDB initially displays a Structure Summary
page with options for interactively viewing the structure,
for viewing or downloading the coordinate file, and for
classifying or analyzing the structure in terms of its geo-
metric properties and sequence (see below).
b. The Nucleic Acid Database
The Nucleic Acid Database (NDB) archives the atomic
coordinates of structures that contain nucleic acids. Its co-
ordinate files have substantially the same format as do
those of the PDB, where this information is also kept. How-
ever, the NDB’s organization and search algorithms are
specialized for dealing with nucleic acids. This is useful, in
part, because many nucleic acids of known structure are
identified only by their sequences rather than by names, as
are proteins (e.g., myoglobin), and consequently could eas-
ily be overlooked in a search of the PDB.
c. Viewing Macromolecular Structures in
Three Dimensions
The most informative way to examine a macromolecu-
lar structure is through the use of molecular graphics pro-
grams that permit the user to interactively rotate a macro-
molecule and thereby perceive its three-dimensional
structure. This impression may be further enhanced by si-
multaneously viewing the macromolecule in stereo. Most
molecular graphics programs use PDB files as input. The
programs described here can be downloaded from the In-
ternet addresses listed in Table 8-4, some of which also pro-
vide instructions for the program’s use.
Jmol, which functions as both a Web browser–based ap-
plet or as a standalone program, allows the user to display
user-selected macromolecules in a variety of colors and
formats (e.g., ball and stick, backbone, wireframe, space-
filling, and cartoon).The Interactive Exercises on the Web-
site that accompanies this textbook (http://wiley.com/
college/voet/) all use Jmol (this site also contains a Jmol tu-
torial). FirstGlance uses Jmol to display macromolecules
via a user-friendly interface. KiNG, which also has Web
browser–based and standalone versions, displays the so-
called Kinemages on this textbook’s accompanying Web-
site. KiNG provides a generally more author-directed user
environment than does Jmol. Macromolecules can be dis-
played directly from their corresponding PDB page using
Jmol, KiNG, and several other viewers. The Swiss-Pdb
Viewer (also called DeepView), in addition to displaying
molecular structures, provides tools for basic model build-
ing, homology modeling, energy minimization, and multi-
ple sequence alignment. One advantage of the Swiss-PDB
Viewer is that it allows users to easily superimpose two or
more models. Proteopedia is a 3D interactive encyclopedia
of proteins and other macromolecules that resembles
Wikipedia in that it is user edited. It uses mainly Jmol as a
viewer.
d. Structural Classification and Comparison
Most proteins are structurally related to other proteins.
Indeed, as we shall see in Section 9-6, evolution tends to
conserve the structures of proteins rather than their se-
quences. The computational tools described below facili-
tate the classification and comparison of protein structures.
They can be accessed directly via their websites (Table 8-4)
and, in some cases, accessed directly from the PDB. Studies
using these programs yield functional insights, reveal dis-
tant evolutionary relationships that are not apparent from
sequence comparisons (Section 7-4B), generate libraries of
unique folds for structure prediction, and provide indica-
tions as to why certain types of structures are preferred
over others.
Section 8-3. Globular Proteins 257
JWCL281_c08_221-277.qxd 2/23/10 1:59 PM Page 257
1. CATH (for Class, Architecture, Topology, and Homol-
ogous superfamily), as its name suggests, categorizes pro-
teins in a four-level structural hierarchy. (1) “Class,” the
highest level, places the selected protein in one of four cate-
gories of gross secondary structure: Mainly ␣, Mainly , ␣/
(having both ␣ helices and  sheets), and Few Secondary
Structures. (2) “Architecture” is the description of the gross
arrangement of secondary structure independent of topol-
ogy. (3) “Topology” is indicative of both the overall shape
and connectivity of the protein’s secondary structures. (4)
“Homologous superfamily” is those proteins of known
structure that are homologous to (share a common ancestor
with) the selected protein. For 1 MBO (sperm whale myo-
globin), the CATH classification is Class (C): Mainly alpha;
Architecture (A): Orthogonal bundle; Topology (T): Glo-
bin-like; and Homologous superfamily (H): Globin. CATH
permits the user to navigate up and down the various hierar-
chies and thereby structurally compare them.
2. CE (for Combinatorial Extension of the optimal
path) finds all proteins in the PDB that can be structurally
aligned with the query structure to within user-specified
geometric criteria. The amino acid sequences of these pro-
teins are also aligned on the basis of this structural align-
ment rather than sequence alignment (Section 7-4B). The
structurally aligned proteins can be simultaneously dis-
played by a Java applet called Compare3D that displays
both the aligned C
␣
backbones and the structurally aligned
sequences. CE can likewise align and display two user-
selected structures. The atomic coordinates of the aligned
structures can also be downloaded in PDB format for use
with other programs such as display by Jmol and KiNG.
3. Pfam (for Protein families) is a database of nearly
11,000 multiple sequence alignments of protein domains
(called Pfam families). Using Pfam, one can analyze a pro-
tein for Pfam matches (74% of proteins have at least one
match in Pfam), view Pfam family annotations and align-
ments, determine the domain organization of a protein
based on its sequence or its structure, find groups of related
Pfam families (called clans), examine the phylogenetic tree
of a Pfam family, and view the occurrence of a protein’s do-
mains across different species.
4. SCOP (Structural Classification Of Proteins) classi-
fies protein structures based mainly on manually generated
topological considerations according to a 6-level hierarchy:
Class [All-␣,All-, ␣/ (having ␣ helices and  strands that
are largely interspersed), ␣⫹ (having ␣ helices and 
strands that are largely segregated), and Multi-domain
(having domains of different classes)], Fold (groups that
have similar arrangements of secondary structural ele-
ments), Superfamily (indicative of distant evolutionary
relationships based on structural criteria and functional
features), Family (indicative of near evolutionary relation-
ships based on sequence as well as on structure), Protein,
and Species. For 1 MBO these are Class: All-␣; Fold:
Globin-like; Superfamily: Globin-like; Family: Globins;
Protein: Myoglobin; and Species: Sperm whale (Physeter
catodon). SCOP permits the user to navigate through its
treelike hierarchical organization and lists the known
members of any particular branch. Thus, with 1MBO,
SCOP displays a list of the 174 structures in the PDB that
contain sperm whale myoglobin (a protein that has re-
ceived far more structural study than most).
5. VAST (Vector Alignment Search Tool),a component
of the National Center for Biotechnology Information
(NCBI) Entrez system, reports a precomputed list of pro-
teins of known structure that structurally resemble the
query protein. The VAST system uses the Molecular Mod-
eling Database (MMDB), an NCBI-generated database
that is derived from PDB coordinates but in which mole-
cules are represented by connectivity graphs rather than
sets of atomic coordinates.VAST displays the superposition
of the query protein in its structural alignment with a user-
selected list of the related proteins using Cn3D [a molecu-
lar graphics program that displays MMDB files and that is
publicly available for a variety of computer platforms
(Table 8-4)]. VAST also reports the structure-based se-
quence alignment of these proteins.
In addition, several “Structure Analysis” tools can be in-
voked from a PDB Structure Summary page. The “Se-
quence Details” page provides the sequence of each chain
in the structure and, for polypeptides, indicates the second-
ary structure of each of its residues.
e. The Structural Genomics Project
As we shall see in Section 9-3B, proteins with similar se-
quences are likely to have similar three-dimensional struc-
tures.Yet, of the ⬃7 million polypeptides of known sequence,
only ⬍40,000 have known structures comprising ⬃1200 of
the estimated 8000 different protein folds. Consequently,
⬃40% of the open reading frames (ORFs; DNA sequences
that appear to encode proteins) in known genomes specify
proteins whose structures and functions are unknown. The
need to better characterize such proteins has led to the struc-
tural genomics project,a loosely organized international con-
sortium of structure determination centers dedicated to elu-
cidating the structures of representative proteins from every
protein family and hence making the structures of most pro-
teins readily obtainable from their gene sequences.
Traditionally, the determination of protein structures by
X-ray and NMR techniques has been carried out through
hypothesis-driven research, that is, the proteins are being
studied to solve specific biochemical problems, and hence
these proteins tend to be functionally well characterized. In
contrast, structural genomics endeavors to determine the
structures of large numbers of uncharacterized proteins
(except for their sequences) and has a long-range goal of
determining the structures of all members of selected pro-
teomes (the collections of all proteins encoded by the
corresponding genomes). To effectively do so required that
the rate of protein structure determination be greatly accel-
erated. Hence the first phase of the structural genomics
project concentrated on developing high-throughput (i.e.,
robotic) methods of expressing, purifying, crystallizing, and
structurally elucidating the proteins to be studied.This has
been followed, since 2005, by a production phase in which
large numbers of protein structures have been determined.
258 Chapter 8. Three-Dimensional Structures of Proteins
JWCL281_c08_221-277.qxd 2/23/10 1:59 PM Page 258
Indeed, ⬃14% of the structures in the PDB are products of
the structural genomics project (a percentage that is in-
creasing) with many of these proteins having novel folds.
Unfortunately, the knowledge of a protein’s structure does
not necessarily reveal its function. Hence even though the
cost of determining a protein’s X-ray structure by the
structural genomics project appears to be significantly less
than that by hypothesis-driven research (although the lat-
ter are adopting high-throughput methods), it is still a mat-
ter of debate as to whether the structural genomics project
is a cost-effective way of obtaining biochemically useful in-
formation relative to hypothesis-driven research.
4 PROTEIN STABILITY
Incredible as it may seem, thermodynamic measurements
indicate that native proteins are only marginally stable enti-
ties under physiological conditions. The free energy re-
quired to denature them is ⬃0.4 kJ ⴢ mol
⫺1
of amino acid
residues, so that 100-residue proteins are typically stable by
only around 40 kJ ⴢ mol
⫺1
. In contrast, the energy required
to break a typical hydrogen bond is ⬃20 kJ ⴢ mol
⫺1
.The
various noncovalent influences to which proteins are sub-
ject—electrostatic interactions (both attractive and repul-
sive), hydrogen bonding (both intramolecular and to wa-
ter), and hydrophobic forces—each have energetic
magnitudes that may total thousands of kilojoules per
mole over an entire protein molecule. Consequently, a pro-
tein structure arises from a delicate balance among powerful
countervailing forces. In this section we discuss the nature
of these forces and end by considering protein denatura-
tion, that is, how these forces can be disrupted.
A. Electrostatic Forces
Molecules are collections of electrically charged particles
and hence, to a reasonable degree of approximation, their
interactions are determined by the laws of classical electro-
statics (more exact calculations require the application of
quantum mechanics). The energy of association, U, of two
electric charges, q
1
and q
2
, that are separated by the dis-
tance r is found by integrating the expression for
Coulomb’s law, Eq. [2.1], to determine the work necessary
to separate these charges by an infinite distance:
[8.1]
Here k ⫽ 9.0 ⫻ 10
9
J ⴢ m ⴢ C
⫺2
and D is the dielectric con-
stant of the medium in which the charges are immersed
(recall that D ⫽ 1 for a vacuum and, for the most part, in-
creases with the polarity of the medium;Table 2-1).The di-
electric constant of a molecule-sized region is difficult to
estimate. For the interior of a protein, it is usually taken to
be in the range 3 to 5 in analogy with the measured dielec-
tric constants of substances that have similar polarities,
such as benzene and diethyl ether.
Coulomb’s law is only valid for point or spherically sym-
metric charges that are immersed in a medium of constant
U ⫽
kq
1
q
2
Dr
D. However, proteins are by no means spherical and their
internal D values vary with position. Moreover,a protein in
solution associates with mobile ions such as Na
⫹
and Cl
⫺
,
which modulate the protein’s electrostatic potential. Con-
sequently, calculating the electrostatic potential of a pro-
tein requires mathematically sophisticated and computa-
tionally intensive algorithms that are beyond the scope of
this text. These methods are widely used to calculate the
surface electrostatic potentials of proteins using a program
called GRASP (for Graphical Representation and Analy-
sis of Surface Properties) written by Anthony Nicholls,
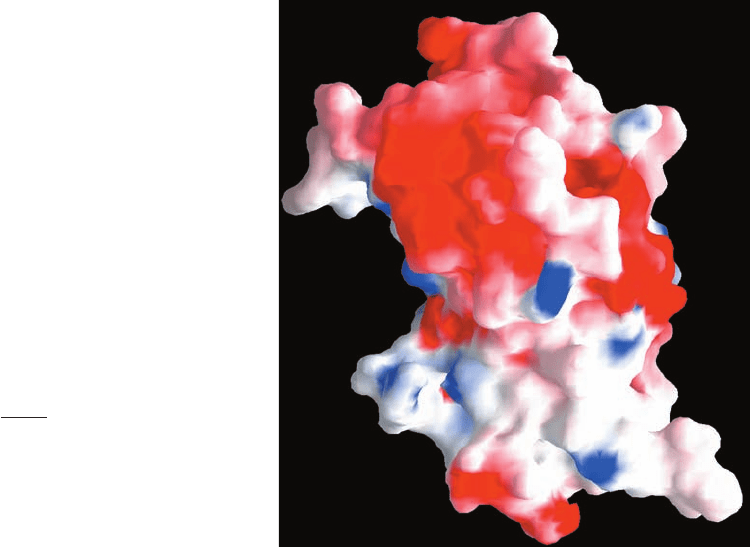
Kim Sharp, and Barry Honig. Figure 8-56 shows a GRASP
diagram of human growth hormone in which the protein’s
surface is colored according to its electrostatic potential.
Such diagrams are useful for assessing how a protein might
associate with charged molecules such as other proteins,
nucleic acids, and substrates. Similar computations are used
to predict the pK’s of protein surface groups, which can
have significant application in the elucidation of an en-
zyme’s mechanism of action (Section 15-1).
a. Ionic Interactions Are Strong but Do Not Greatly
Stabilize Proteins
The association of two ionic protein groups of opposite
charge is known as an ion pair or salt bridge. According to
Eq. [8.1], the energy of a typical ion pair, say the carboxyl
Section 8-4. Protein Stability 259
Figure 8-56 A GRASP diagram of human growth hormone.
The diagram shows the protein’s surface colored according to its
electrostatic potential, with its most negative areas dark red, its
most positive areas dark blue, and its neutral areas white. The
protein’s orientation is the same as that in Fig. 8-47b. [Based on
an X-ray structure by Alexander Wlodawer, National Cancer
Institute, Frederick, Maryland. PDBid 1HGU.]
JWCL281_c08_221-277.qxd 2/23/10 1:59 PM Page 259
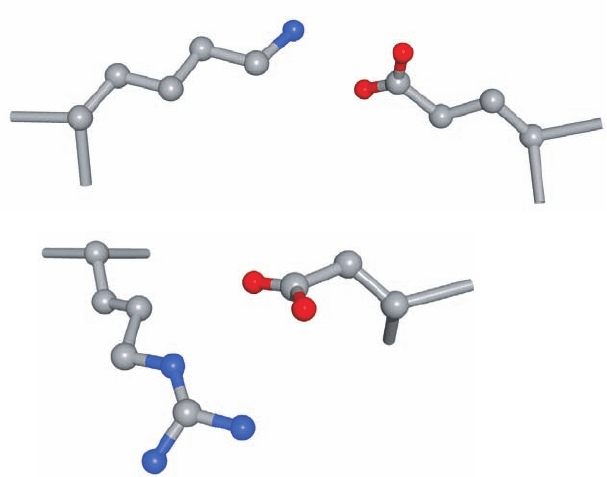
group of Glu and the ammonium group of Lys, whose
charge centers are separated by 4.0 Å in a medium of
dielectric constant 4, is –86 kJ ⴢ mol
⫺1
(one electronic charge
⫽ 16.0 ⫻ 10
⫺19
C). However, free ions in aqueous solution
are highly solvated, and the formation of a salt bridge has
the entropic penalty of localizing the salt bridge’s charged
side chains. Consequently, the free energy of solvation of
two separated ions is about equal to the free energy of for-
mation of their unsolvated ion pair.Ion pairs therefore con-
tribute little stability toward a protein’s native structure. This
accounts for the observations that although ⬃75% of
charged residues occur in ion pairs (e.g., Fig. 8-57), very few
ion pairs are buried (unsolvated), and ion pairs that are ex-
posed to the aqueous solvent tend to be but poorly con-
served among homologous proteins.
b. Dipole–Dipole Interactions Are Weak but
Significantly Stabilize Protein Structures
The noncovalent associations between electrically neu-
tral molecules, collectively known as van der Waals forces,
arise from electrostatic interactions among permanent
and/or induced dipoles. These forces are responsible for
numerous interactions of varying strengths between non-
bonded neighboring atoms. (The hydrogen bond, a special
class of dipolar interaction, is considered separately in Sec-
tion 8-4B.)
Interactions among permanent dipoles are important
structural determinants in proteins because many of
their groups, such as the carbonyl and amide groups of
the peptide backbone, have permanent dipole moments.
These interactions are generally much weaker than the
charge–charge interactions of ion pairs. Two carbonyl
groups, for example, each with dipoles of 4.2 ⫻ 10
⫺30
C ⴢ m
(1.3 debye units) that are oriented in an optimal head-to-
tail arrangement (Fig. 8-58a) and separated by 5 Å in a
medium of dielectric constant 4, have a calculated attrac-
tive energy of only ⫺9.3 kJ ⴢ mol
⫺1
. Furthermore, these en-
ergies vary with r
⫺3
, so they rapidly attenuate with distance.
In ␣ helices, however, the negative ends of the dipolar
amide and carbonyl groups of the polypeptide backbone
all point in the same direction (Fig. 8-11), so that their in-
teractions and bond dipoles are additive (these groups, of
course, also form hydrogen bonds, but here we are con-
cerned with their residual electric fields). The ␣ helix
therefore has a significant dipole moment that is positive
toward the N-terminus and negative toward the C-terminus.
Consequently, in the low dielectric constant core of a pro-
tein, dipole–dipole interactions significantly influence pro-
tein folding.
A permanent dipole also induces a dipole moment on a
neighboring group so as to form an attractive interaction
(Fig. 8-58b). Such dipole–induced dipole interactions are
generally much weaker than are dipole–dipole interactions.
Although nonpolar molecules are nearly electrically
neutral, at any instant they have a small dipole moment re-
sulting from the rapid fluctuating motions of their elec-
trons. This transient dipole moment polarizes the electrons
in a neighboring group, thereby giving rise to a dipole mo-
ment (Fig. 8-58c) such that, near their van der Waals con-
tact distances, the groups are attracted to one another (a
quantum mechanical effect that cannot be explained in
terms of only classical physics). These so-called London
dispersion forces are extremely weak. The 8.2-kJ ⴢ mol
⫺1
heat of vaporization of CH
4
, for example, indicates that the
attractive interaction of a nonbonded contact
between neighboring CH
4
molecules is roughly ⫺0.3
kJ ⴢ mol
⫺1
(in the liquid, a CH
4
molecule touches its 12
nearest neighbors with ⬃2 contacts each).
London forces are only significant for contacting groups
because their association energy is proportional to r
⫺6
.
Nevertheless, the great numbers of interatomic contacts in
the closely packed interiors of proteins make London forces
H
p
H
H
p
H
260 Chapter 8. Three-Dimensional Structures of Proteins
Lys 77
Arg 45
Asp 60
Glu 18
+
+
–
–
Figure 8-57 Examples of ion pairs in myoglobin. In each case, oppositely charged
side chain groups from residues far apart in sequence closely approach each other
through the formation of ion pairs.
JWCL281_c08_221-277.qxd 2/23/10 1:59 PM Page 260
