Voet D., Voet Ju.G. Biochemistry
Подождите немного. Документ загружается.

3 GLOBULAR PROTEINS
Globular proteins comprise a highly diverse group of sub-
stances that, in their native states, exist as compact spher-
oidal molecules. Enzymes are globular proteins, as are
transport and receptor proteins. In this section we consider
the tertiary structures of globular proteins. However, since
most of our detailed structural knowledge of proteins, and
thus to a large extent their function, has resulted from X-
ray crystal structure determinations of globular proteins
and, more recently, from their nuclear magnetic resonance
(NMR) structure determinations, we begin this section
with a discussion of the capabilities and limitations of these
powerful techniques.
A. Interpretation of Protein X-Ray
and NMR Structures
X-ray crystallography is a technique that directly images
molecules. X-rays must be used to do so because, accord-
ing to optical principles, the uncertainty in locating an ob-
ject is approximately equal to the wavelength of the radia-
tion used to observe it (covalent bond distances and the
wavelengths of the X-rays used in structural studies are
both ⬃1.5 Å; individual molecules cannot be seen in a
light microscope because visible light has a minimum
wavelength of 4000 Å).There is, however, no such thing as
an X-ray microscope because there are no X-ray lenses.
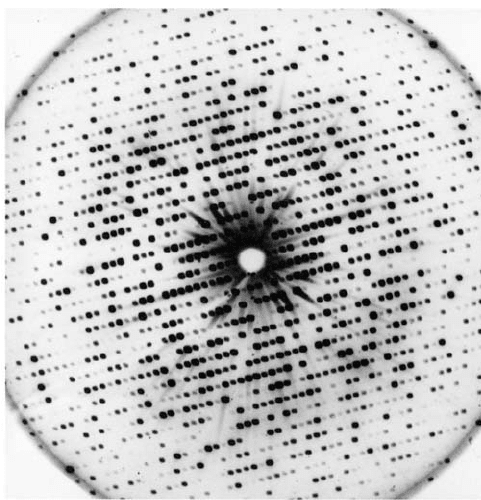
Rather, a crystal of the molecule to be imaged is exposed
to a collimated beam of X-rays and the consequent dif-
fraction pattern is recorded by a radiation detector or,
now infrequently, on photographic film (Fig. 8-35). The
X-rays used in structural studies are produced by laboratory
X-ray generators or, increasingly often, by synchrotrons, a
type of particle accelerator that produces X-rays of far
greater intensity. The intensities of the diffraction maxima
(darkness of the spots on a film) are then used to construct
mathematically the three-dimensional image of the crystal
structure through methods that are beyond the scope of
this text. In what follows, we discuss some of the special
problems associated with interpreting the X-ray crystal
structures of proteins.
X-rays interact almost exclusively with the electrons in
matter,not the far more massive nuclei.An X-ray structure
is therefore an image of the electron density of the object
under study. Such electron density maps may be presented
as a series of parallel sections through the object. On each
section, the electron density is represented by contours
(Fig. 8-36a) in the same way that altitude is represented by
the contours on a topographic map. A stack of such sec-
tions, drawn on transparencies, yields a three-dimensional
electron density map (Fig. 8-36b). Modern structural analy-
sis, however, is carried out with the aid of computers that
graphically display electron density maps that are con-
toured in three dimensions (Fig. 8-36c).
a.
Most Protein Crystal Structures Exhibit Less than
Atomic Resolution
The molecules in protein crystals, as in other crys-
talline substances, are arranged in regularly repeating
three-dimensional lattices. Protein crystals, however, dif-
fer from those of most small organic and inorganic mole-
cules in being highly hydrated; they are typically 40 to
60% water by volume. The aqueous solvent of crystalliza-
tion is necessary for the structural integrity of the protein
crystals, as J.D. Bernal and Dorothy Crowfoot Hodgkin
first noted in 1934 when they carried out the original
X-ray studies of protein crystals. This is because water is
required for the structural integrity of native proteins
themselves (Section 8-4).
The large solvent content of protein crystals gives them
a soft, jellylike consistency, so that their molecules often
lack the rigid order characteristic of crystals of small mole-
cules such as NaCl or glycine. The molecules in a protein
crystal are typically disordered by more than an angstrom,
so that the corresponding electron density map lacks infor-
mation concerning structural details of smaller size. The
crystal is therefore said to have a resolution limit of that
size. Protein crystals typically have resolution limits in the
range 1.5 to 3.0 Å, although some are better ordered (have
higher resolution, that is, a lesser resolution limit) and
many are less ordered (have lower resolution).
Since an electron density map of a protein must be in-
terpreted in terms of its atomic positions, the accuracy and
Section 8-3. Globular Proteins 241
Figure 8-35 X-ray diffraction photograph of a single crystal of
sperm whale myoglobin. The intensity of each diffraction
maximum (the darkness of each spot) is a function of the
myoglobin crystal’s electron density. The photograph contains
only a small fraction of the total diffraction information available
from a myoglobin crystal. [Courtesy of John Kendrew, Cambridge
University, U.K.]
JWCL281_c08_221-277.qxd 2/23/10 1:58 PM Page 241
even the feasibility of a crystal structure analysis depends
on the crystal’s resolution limit. Indeed, the ability to ob-
tain crystals of sufficiently high resolution is a major limit-
ing factor in determining the X-ray crystal structure of a
protein or other macromolecule. Figure 8-37 indicates how
the quality (degree of focus) of an electron density map
varies with its resolution limit. At 6-Å resolution, the pres-
ence of a molecule the size of diketopiperazine is difficult
to discern. At 2.0-Å resolution, its individual atoms cannot
yet be distinguished, although its molecular shape has be-
come reasonably evident. At 1.5-Å resolution, which
roughly corresponds to a bond distance, individual atoms
become partially resolved. At 1.1-Å resolution, atoms are
clearly visible.
Most protein crystal structures are too poorly resolved
for their electron density maps to reveal clearly the posi-
tions of individual atoms (e.g., Fig. 8-36). Nevertheless, the
distinctive shape of the polypeptide backbone usually per-
mits it to be traced, which, in turn, allows the positions and
orientations of its side chains to be deduced (e.g., Fig. 8-37c).
242 Chapter 8. Three-Dimensional Structures of Proteins
Figure 8-36 Electron density maps of proteins. (a) A section
through the 2.0-Å-resolution electron density map of sperm whale
myoglobin, which contains the heme group (red).The large peak
at the center of the map represents the electron-dense Fe atom.
[After Kendrew, J.C., Dickerson, R.E., Strandberg, B.E., Hart,
R.G., Davies, D.R., Phillips, D.C., and Shore,V.C., Nature 185, 434
(1960).] (b) A portion of the 2.4-Å-resolution electron density
map of myoglobin constructed from a stack of contoured
transparencies. Dots have been placed at the positions deduced for
the nonhydrogen atoms.The heme group is seen edge-on together
with its two associated His residues and a water molecule, W.An ␣
helix, the so-called E helix (Fig. 8-12), extends across the bottom of
the map. Another ␣ helix, the C helix, extends into the plane of the
paper on the upper right. Note the hole along its axis. [Courtesy
of John Kendrew, Cambridge University, U.K.] (c) A thin section
through the 1.5-Å-resolution electron density map of E. coli
6-hydroxymethyl-7,8-dihydropterin pyrophosphokinase (which
catalyzes the first reaction in the biosynthesis of folic acid; Section
26-4D) contoured in three dimensions. Only a single contour level
(cyan) is shown,together with an atomic model of the corresponding
polypeptide segments colored according to atom type (C yellow, O
red, and N blue, with a water molecule represented by a red
sphere). [Courtesy of Xinhua Ji, NCI–Frederick Cancer Research
and Development Center, Frederick, Maryland.]
(b)
(a)
(c)
JWCL281_c08_221-277.qxd 6/3/10 9:46 AM Page 242

Yet side chains of comparable size and shape, such as those
of Leu, Ile, and Thr, cannot always be differentiated with a
reasonable degree of confidence (hydrogen atoms, having
but one electron, are only visible in the few macromolecular
X-ray structures with resolution limits less than ⬃1.2 Å), so
that a protein structure cannot be elucidated from its elec-
tron density map alone. Rather, the primary structure of
the protein must be known, thereby permitting the se-
quence of amino acid residues to be fitted to its electron
density map. Mathematical refinement can then reduce the
uncertainty in the crystal structure’s atomic positions to as
little as 0.1 Å (in contrast, positional errors in the most
accurately determined small molecule X-ray structures are
as little as 0.001 Å).
b. Most Crystalline Proteins Maintain Their
Native Conformations
What is the relationship between the structure of a pro-
tein in a crystal and that in solution, where globular pro-
teins normally function? Several lines of evidence indicate
that crystalline proteins assume very nearly the same struc-
tures that they have in solution:
1. A protein molecule in a crystal is essentially in solu-
tion because it is bathed by the solvent of crystallization
over all of its surface except for the few, generally small
patches that contact neighboring protein molecules. In fact,
the 40 to 60% water content of typical protein crystals is
similar to that of many cells (e.g., see Fig. 1-13).
2. A protein may crystallize in one of several forms or
“habits,” depending on crystallization conditions, that dif-
fer in how the protein molecules are arranged in space
relative to each other. In the numerous cases in which
different crystal forms of the same protein have been
independently analyzed, the molecules have virtually iden-
tical conformations. Similarly, in the several cases in which
both the X-ray crystal structure and the solution NMR
structure of the same protein have been determined, the
two structures are, for the most part, identical to within ex-
perimental error (see below). Evidently, crystal packing
forces do not greatly perturb the structures of protein mol-
ecules.
3. The most compelling evidence that crystalline pro-
teins have biologically relevant structures, however, is the
observation that many enzymes are catalytically active in
the crystalline state. The catalytic activity of an enzyme is
very sensitive to the relative orientations of the groups in-
volved in binding and catalysis (Chapter 15). Active crys-
talline enzymes must therefore have conformations that
closely resemble their solution conformations.
c. Protein Structure Determination by NMR
The determination of the three-dimensional structures
of small globular proteins in aqueous solution has become
possible, since the mid 1980s, through the development of
two-dimensional (2D) NMR spectroscopy (and, more re-
cently, of 3D and 4D techniques), in large part by Kurt
Wüthrich. Such NMR measurements, whose description is
beyond the scope of this text, yield the interatomic dis-
tances between specific protons that are ⬍5 Å apart in a
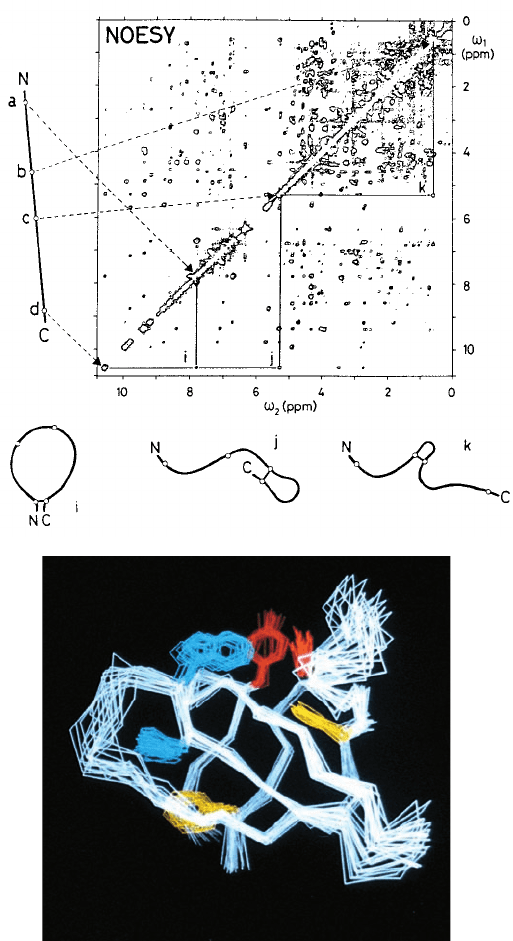
protein of known sequence. The interproton distances may
be either through space, as determined by nuclear Over-
hauser effect spectroscopy (NOESY, Fig. 8-38a), or
through bonds, as determined by correlated spectroscopy
(COSY). These distances, together with known geometric
constraints such as covalent bond distances and angles,
group planarity, chirality, and van der Waals radii, are used
to compute the protein’s three-dimensional structure.
However,since interproton distance measurements are im-
precise, they are insufficient to imply a unique structure.
Rather, they are consistent with an ensemble of closely re-
lated structures. Consequently, an NMR structure of a pro-
tein (or any other macromolecule with a well-defined
structure) is often presented as a representative sample of
structures that are consistent with the constraints (e.g., Fig-
ure 8-38b).The “tightness” of a bundle of such structures is
Section 8-3. Globular Proteins 243
1.1-Å resolution1.5-Å resolution2.0-Å resolution6.0-Å resolution
CHN
NH
CH
2
C
H
2
C
O
O
(a) (b) (c) (d)
Figure 8-37 Sections through the electron density map of diketopiperazine calculated at the
indicated resolution levels. Hydrogen atoms are not apparent in this map because of their low
electron density. [After Hodgkin, D.C., Nature 188, 445 (1960).]
JWCL281_c08_221-277.qxd 2/23/10 1:58 PM Page 243
indicative both of the accuracy with which the structure is
known, which in the most favorable cases is roughly com-
parable to that of an X-ray crystal structure with a resolu-
tion of 2 to 2.5 Å, and of the conformational fluctuations
that the protein undergoes (Section 9-4).Although present
NMR methods are limited to determining the structures of
macromolecules with molecular masses no greater than
⬃100 kD, advances in NMR technology suggest that this
limit may increase to ⬃1000 kD or more.
In most of the several cases in which both the NMR
and X-ray crystal structures of a particular protein have
been determined, the two structures are in good agree-
ment. There are, however, a few instances in which there
are real differences between the corresponding X-ray
and NMR structures. These, for the most part, involve
surface residues that, in the crystal, participate in inter-
molecular contacts and are thereby perturbed from their
solution conformations. NMR methods, besides provid-
ing mutual cross-checks with X-ray techniques, can de-
termine the structures of proteins and other macromole-
cules that fail to crystallize. Moreover, since NMR can
probe motions over time scales spanning 10 orders of
magnitude, it can be used to study protein folding and dy-
namics (Chapter 9).
d. Protein Molecular Structures Are Most Effectively
Illustrated in Simplified Form
The several hundred nonhydrogen atoms of even a small
protein makes understanding a protein’s detailed struc-
ture a considerable effort. This complexity makes build-
ing a skeletal or ball-and-stick model of a protein such a
time-consuming task that such models are rarely avail-
able. Moreover,a drawing of a protein showing all its non-
hydrogen atoms (e.g., Fig. 8-39a) is too complicated to be
of much use. In order to be intelligible, drawings of pro-
teins must be selectively simplified. One way of doing so
is to represent the polypeptide backbone only by its C
␣
atoms (its C
␣
backbone) and to display only a few key
side chains (e.g, Fig. 8-39b). A further level of abstraction
244 Chapter 8. Three-Dimensional Structures of Proteins
(a )
Figure 8-38 The 2D proton NMR structures of proteins. (a) A
NOESY spectrum of a protein presented as a contour plot with
two frequency axes,
1
and
2
.The conventional 1D-NMR
spectrum of the protein, which occurs along the diagonal of the
plot (
1
⫽
2
), is too crowded with peaks to be directly
interpretable (even a small protein has hundreds of protons).
The off-diagonal peaks, the so-called cross peaks, each arise from
the interaction of two protons that are ⬍5 Å apart in space and
whose 1D-NMR peaks are located where the horizontal and
vertical lines through the cross peak intersect the diagonal [a
nuclear Overhauser effect (NOE)]. For example, the line to the
left of the spectrum represents the extended polypeptide chain
with its N- and C-terminal ends identified by the letters N and C
and with the positions of four protons, a to d, represented by
small circles.The dashed arrows indicate the diagonal NMR
peaks to which these protons give rise. Cross peaks, such as i, j,
and k, which are each located at the intersections of the
horizontal and vertical lines through two diagonal peaks, are
indicative of an NOE between the corresponding two protons,
indicating that they are ⬍5 Å apart.These distance relationships
are schematically indicated by the three looped structures drawn
below the spectrum. Note that the assignment of a distance
relationship between two protons in a polypeptide requires that
the NMR peaks to which they give rise and their positions in the
polypeptide be known, which requires that the polypeptide’s
amino acid sequence has been previously determined. [After
Wüthrich, K., Science 243, 45 (1989).] (b) The NMR structure of
a 64-residue polypeptide comprising the Src protein SH3 domain
(Section 19-3C).The drawing represents 20 superimposed
structures that are consistent with the 2D- and 3D-NMR spectra
of the protein (each calculated from a different, randomly
generated starting structure).The polypeptide backbone, as
represented by its connected C
␣
atoms, is white and its Phe,Tyr,
and Trp side chains are yellow, red, and blue, respectively. It can
be seen that the polypeptide backbone folds into two
three-stranded antiparallel  sheets that form a sandwich.
[Courtesy of Stuart Schreiber, Harvard University.]
(b)
JWCL281_c08_221-277.qxd 2/23/10 1:58 PM Page 244
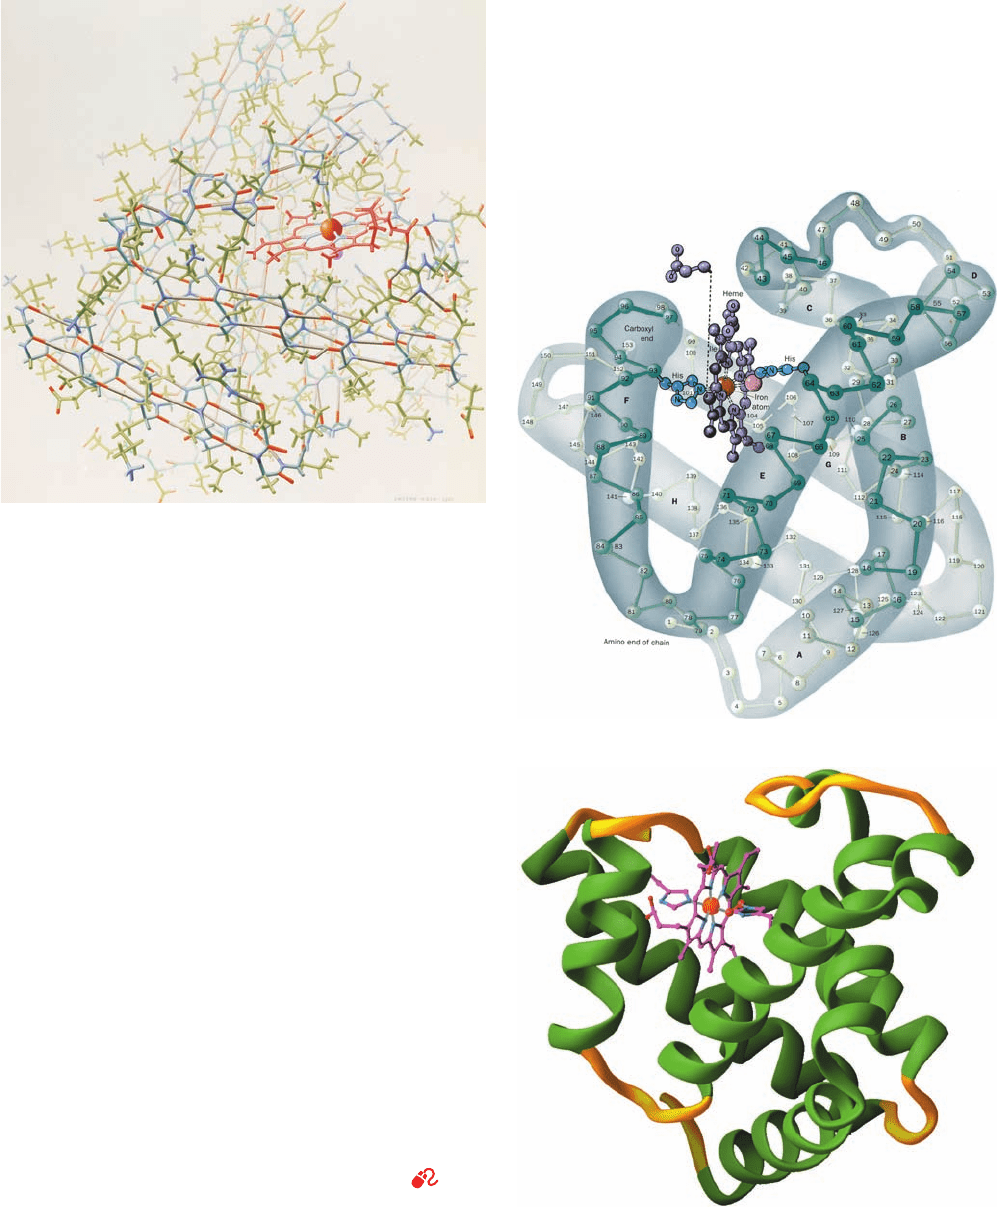
may be obtained by representing the protein in a cartoon
form that emphasizes its secondary structure (e.g., Figs.
8-39c and 8-19). Computer-generated drawings of space-
filling models, such as Figs. 8-12 and 8-18, may also be em-
ployed to illustrate certain features of protein structures.
However, the most instructive way to examine a macro-
molecular structure is through the use of interactive com-
puter graphics programs. The use of such programs is dis-
cussed in Section 8-3Cc.
B. Tertiary Structure
The tertiary structure (3° structure) of a protein is its three-
dimensional arrangement; that is, the folding of its 2° struc-
tural elements, together with the spatial dispositions of its
side chains. The first protein X-ray structure, that of sperm
Section 8-3. Globular Proteins 245
Figure 8-39 Representations of the X-ray structure of sperm
whale myoglobin. (a) The protein and its bound heme are drawn
in stick form, with protein C atoms green, heme C atoms red, N
atoms blue, and O atoms red.The Fe and its bound water
molecule are shown as orange and gray spheres and hydrogen
bonds are gray. In this one-of-a-kind painting of the first known
protein structure, the artist has employed “creative distortions”
to emphasize the protein’s structural features, particularly its ␣
helices. (b) A diagram in which the protein is represented by its
computer-generated C
␣
backbone, with its C
␣
atoms, shown as
balls, consecutively numbered from the N-terminus. The
153-residue polypeptide chain is folded into eight ␣ helices
(highlighted here by hand-drawn envelopes), designated A
through H, that are connected by short polypeptide links. The
protein’s bound heme group (purple, with its Fe atom represented
by a red sphere), in complex with a water molecule (orange
sphere), is shown together with its two closely associated His side
chains (blue). One of the heme group’s propionic acid side chains
has been displaced for clarity. Hydrogen atoms are not visible in
the X-ray structure. (c) A computer-generated cartoon drawing
in an orientation similar to that of Part b, emphasizing the protein’s
secondary structure. Here helices are green and the intervening
coil regions are yellow. The heme group with its bound O
2
molecule and its two associated His side chains are shown in
ball-and-stick form with C magenta, N blue, O red, and Fe orange.
[Parts a and b are based on an X-ray structure by John Kendrew,
MRC Laboratory of Molecular Biology, Cambridge, U.K. PDBid
1MBN. [Illustration, Irving Geis. Image from the Irving Geis
Collection, Howard Hughes Medical Institute. Reprinted with
permission.] Part c is based on an X-ray structure by Simon
Phillips, University of Leeds, Leeds, U.K. PDBid 1MBO.]
See
Kinemage Exercise 6-1
(a)
(b)
(c)
JWCL281_c08_221-277.qxd 8/10/10 11:48 AM Page 245
whale myoglobin, was elucidated in the late 1950s by John
Kendrew and co-workers. Its polypeptide chain follows
such a tortuous, wormlike path (Fig. 8-39) that these inves-
tigators were moved to indicate their disappointment at its
lack of regularity. In the intervening years, ⬃70,000 protein
structures have been reported. Each of them is a unique,
highly complicated entity. Nevertheless, their tertiary struc-
tures have several outstanding features in common, as we
shall see below.
a. Globular Proteins May Contain Both ␣ Helices
and  Sheets
The major types of secondary structural elements, ␣ he-
lices and  pleated sheets, commonly occur in globular pro-
teins but in varying proportions and combinations. Some
proteins, such as myoglobin, consist only of ␣ helices
spanned by short connecting links that have coil conforma-
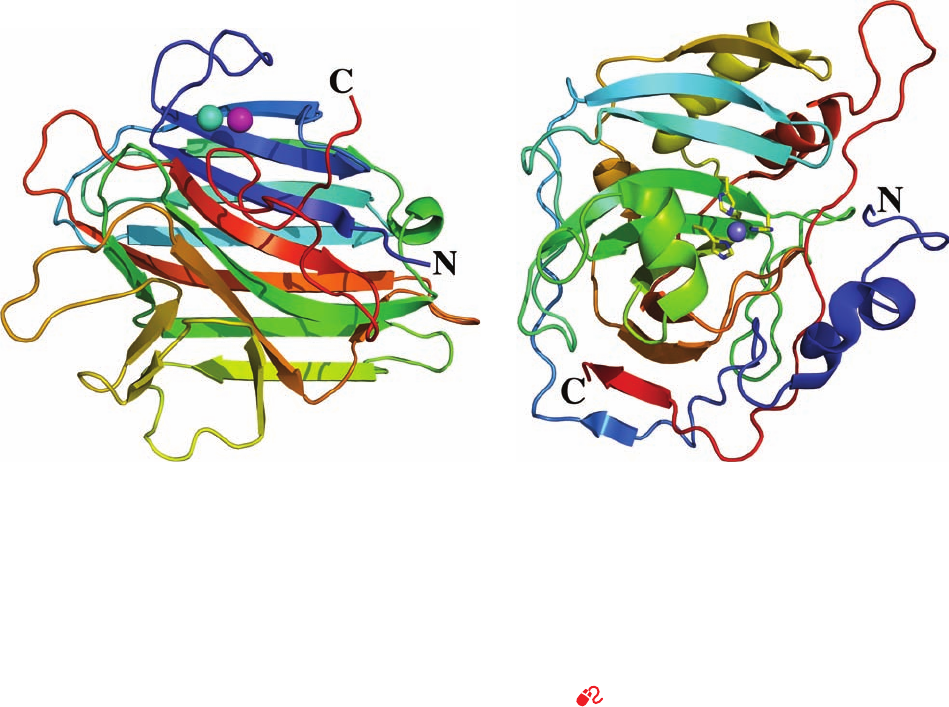
tions (Fig. 8-39). Others, such as concanavalin A, have a
large proportion of  sheets but are devoid of ␣ helices
(Fig.8-40). Most proteins, however,have significant amounts
of both types of secondary structure (on average, ⬃31%
␣ helix and ⬃28%  sheet, with nearly all of their inner cores
so arranged). Human carbonic anhydrase (Fig. 8-41) as well
as carboxypeptidase A and triose phosphate isomerase
(Fig. 8-19) are examples of such proteins.
b. Side Chain Location Varies with Polarity
The primary structures of globular proteins generally
lack the repeating or pseudorepeating sequences that are re-
sponsible for the regular conformations of fibrous proteins.
The amino acid side chains in globular proteins are, never-
theless, spatially distributed according to their polarities:
1. The nonpolar residues Val, Leu, Ile, Met, and Phe
largely occur in the interior of a protein, out of contact with
the aqueous solvent. The hydrophobic interactions that
promote this distribution, which are largely responsible for
the three-dimensional structures of native proteins, are fur-
ther discussed in Section 8-4C.
2. The charged polar residues Arg,His, Lys,Asp, and Glu
are largely located on the surface of a protein in contact with
the aqueous solvent. This is because the immersion of an
ion in the virtually anhydrous interior of a protein results
in the uncompensated loss of much of its hydration energy.
In the instances that these groups occur in the interior of a
protein, they often have a specific chemical function such
as promoting catalysis or participating in metal ion bind-
ing (e.g., the metal ion–liganding His residues in Figs. 8-39
and 8-41).
3. The uncharged polar groups Ser, Thr, Asn, Gln, Tyr,
and Trp are usually on the protein surface but frequently
246 Chapter 8. Three-Dimensional Structures of Proteins
Figure 8-40 X-ray structure of the jack bean protein
concanavalin A. This protein largely consists of antiparallel 
pleated sheets, here represented by flat arrows pointing toward
the polypeptide chain’s C-terminus. The polypeptide chain is
colored in rainbow order from its N-terminus (blue) to its
C-terminus (red).The spheres represent protein-bound Mn
2⫹
(magenta) and Ca
2⫹
(cyan) ions.The front sheet is shown in a
space-filling representation in Fig. 8-18 but viewed from the
opposite side as seen here. [Based on an X-ray structure by
George Reeke, Jr., Joseph Becker, and Gerald Edelman,The
Rockefeller University. PDBid 2CNA.]
Figure 8-41 X-ray structure of human carbonic anhydrase.
The polypeptide backbone is drawn in ribbon form colored in
rainbow order from its N-terminus (blue) to its C-terminus (red).
The purple sphere in the center represents a Zn
2⫹
ion that is
coordinated by three His side chains in stick form colored with C
yellow and N blue. Note that the C-terminus is tucked through
the plane of a surrounding loop of polypeptide chain, so that
carbonic anhydrase is one of the rare native proteins in which a
polypeptide chain forms a knot. [Based on an X-ray structure by
T. Alwyn Jones, Uppsala University, Uppsala, Sweden. PDBid
2CAB.]
See Interactive Exercise 3
JWCL281_c08_221-277.qxd 10/19/10 7:13 AM Page 246
occur in the interior of the molecule. In the latter case,
these residues are almost always hydrogen bonded to other
groups in the protein. In fact, nearly all buried hydrogen
bond donors form hydrogen bonds with buried acceptor
groups; in a sense, the formation of a hydrogen bond “neu-
tralizes” the polarity of a hydrogen bonding group.
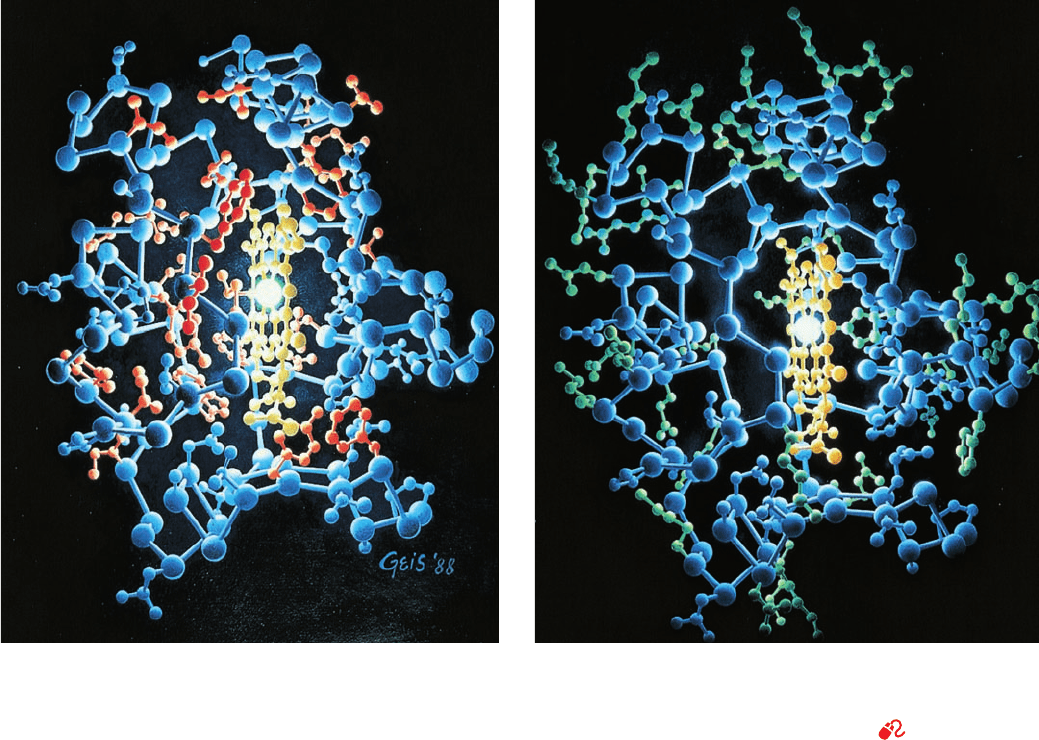
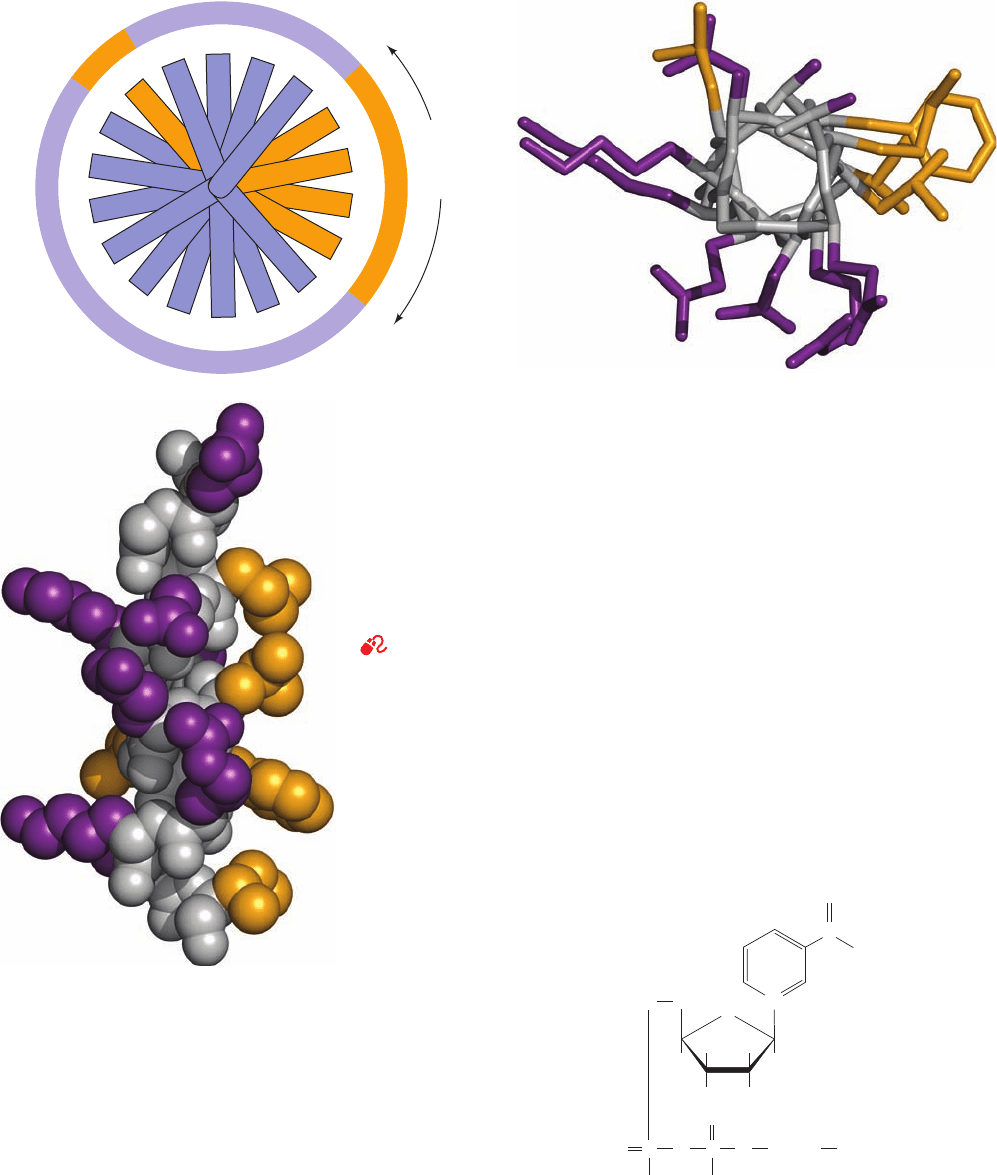
Such a side chain distribution is clearly apparent in Fig. 8-42,
which displays the X-ray structure of cytochrome c. This
arrangement is also seen in Fig. 8-43, which shows the sur-
face and interior exposures of the amino acid side chains of
myoglobin’s H helix, and in Fig. 8-44, which shows one of
the antiparallel  pleated sheets of concanavalin A.
c. Globular Protein Cores Are Efficiently Arranged
with Their Side Chains in Relaxed Conformations
Globular proteins are quite compact; there is very little
space inside them, so that water is largely excluded from
their interiors. The micellelike arrangement of their side
chains (polar groups outside, nonpolar groups inside) has
led to their description as “oil drops with polar coats.”This
generalization, although picturesque, lacks precision. The
packing density (ratio of the volume enclosed by the van
der Waals envelopes of the atoms in a region to the total
volume of the region) of the internal regions of globular
proteins averages ⬃0.75, which is in the same range as that
of molecular crystals of small organic molecules. In com-
parison, equal-sized close-packed spheres have a packing
density of 0.74, whereas organic liquids (oil drops) have
packing densities that are mostly between 0.60 and 0.70.
The interior of a protein is therefore more like a molecular
crystal than an oil drop; that is, it is efficiently packed.
The bonds of protein side chains, including those occu-
pying protein cores, almost invariably have low-energy
staggered torsion angles (Fig. 8-5a). Evidently, interior side
chains adopt relaxed conformations despite their profusion
of intramolecular interactions (Section 8-4).
d. Large Polypeptides Form Domains
Polypeptide chains that consist of more than ⬃200
residues usually fold into two or more globular clusters
known as domains, which often give these proteins a bi- or
multilobal appearance. Most domains consist of 100 to 200
amino acid residues and have an average diameter of ⬃25 Å.
Section 8-3. Globular Proteins 247
Figure 8-42 X-ray structure of horse heart cytochrome c. The
protein (blue) is illuminated by the Fe atom of its heme group
(orange). In Part a, the hydrophobic side chains are red, and in
Part b, the hydrophilic side chains are green. [Based on an X-ray
structure by Richard Dickerson, UCLA; [Illustration, Irving
Geis. Image from the Irving Geis Collection, Howard Hughes
Medical Institute. Reprinted with permission.]
See Kinemage
Exercise 5 and Interactive Exercise 4
(a)
(b)
JWCL281_c08_221-277.qxd 10/19/10 11:02 AM Page 247
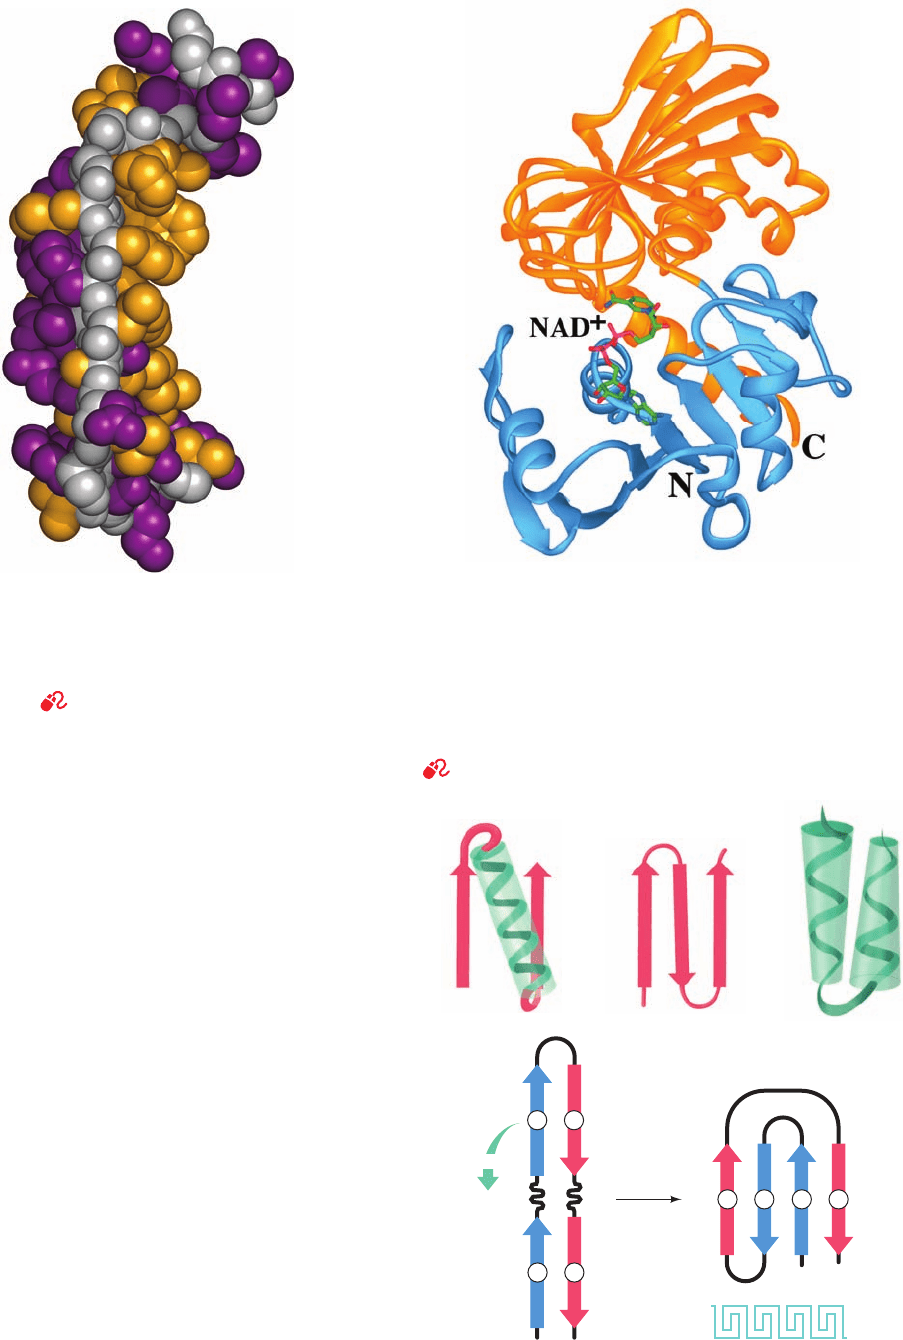
Each subunit of the enzyme glyceraldehyde-3-phosphate
dehydrogenase, for example, has two distinct domains
(Fig. 8-45). A polypeptide chain wanders back and forth
within a domain, but neighboring domains are usually con-
nected by one, or less commonly two, polypeptide seg-
ments. Domains are therefore structurally independent units
that each have the characteristics of a small globular protein.
Indeed, limited proteolysis of a multidomain protein often
liberates its domains without greatly altering their struc-
tures or enzymatic activities. Nevertheless, the domain
structure of a protein is not always obvious since its do-
mains may make such extensive contacts with each other
that the protein appears to be a single globular entity.
An inspection of the various protein structures dia-
grammed in this chapter reveals that domains consist of
two or more layers of secondary structural elements. The
reason for this is clear:At least two such layers are required
to seal off a domain’s hydrophobic core from the aqueous
environment.
Domains often have a specific function, such as the
binding of a small molecule. In Fig. 8-45, for example, the
dinucleotide nicotinamide adenine dinucleotide (NAD
⫹
)
binds to the first domain of the enzyme glyceraldehyde-3-
phosphate dehydrogenase. Small molecule binding sites in
multidomain proteins often occur in the clefts between do-
mains; that is, the small molecules are bound by groups
from two domains. This arrangement arises, in part, from
O
HH
H
H
OH OH
CH
2
O
NH
2
C
O
Nicotinamide adenine dinucleotide (NAD
ⴙ
)
N
PP
O
O
⫺
O
⫺
OO
Ribose Adenine
O
⫹
248 Chapter 8. Three-Dimensional Structures of Proteins
Figure 8-43 The H helix of sperm whale myoglobin. (a) A helical wheel representation
in which side chain positions about the ␣ helix are projected down the helix axis onto
a plane. Here each residue is identified both according to its sequence in the
polypeptide chain and according to its order in the H helix.The residues lining the
side of the helix facing the protein’s interior regions are all nonpolar (orange).The
other residues, except Leu 137, which contacts the protein segment linking helices E
and F (Fig. 8-39b), are exposed to the solvent and are all more or less polar (purple).
(b) A stick model, viewed as in Part a, in which the polypeptide backbone is gray,
nonpolar side chains are orange, and polar side chains are purple. (c) A space-filling
model, viewed from the bottom of Part b such that the helix axis is vertical and
colored as in Part b. [Parts b and c based on an X-ray structure by Ilme Schlichting,
Max Planck Institut für Molekulare Physiologie, Dortmund, Germany. PDBid 1A6M.]
See Kinemage Exercise 3-2 for another example
(b)
(c)
(a)
Asp
Ala
Ala
Ala
Ala
Ala
Asn
Arg
Gln
Leu
Ile
Met
Phe
Glu
Gly
Lys
Lys
Leu
141 H18
132 H9
134 H11
127 H4
138 H15
131 H8
130 H7
137 H14
144 H21
133 H10
139 H16
128 H5
135 H12
142 H19
143 H20
136 H13
129 H6
140 H17
Residues
exposed
to surface
Residues
facing
protein
interior
JWCL281_c08_221-277.qxd 2/23/10 1:58 PM Page 248
the need for a flexible interaction between the protein and
the small molecule that the relatively pliant covalent con-
nection between the domains can provide.
e. Supersecondary Structures Are the Building
Blocks of Proteins
Certain groupings of secondary structural elements,
named supersecondary structures or motifs, occur in many
unrelated globular proteins:
1. The most common form of supersecondary structure
is the ␣ motif (Fig. 8-46a), in which the usually right-
handed crossover connection between two consecutive
parallel strands of a  sheet consists of an ␣ helix.
2. Another common supersecondary structure, the 
hairpin motif (Fig. 8-46b), consists of an antiparallel  sheet
formed by sequential segments of polypeptide chain that
are connected by relatively tight reverse turns.
3. In an ␣␣ motif (Fig. 8-46c), two successive antiparallel
␣ helices pack against each other with their axes inclined so
Section 8-3. Globular Proteins 249
Figure 8-44 A space-filling model of an antiparallel  sheet
from concanavalin A. The  sheet is shown in side view with the
interior of the protein (the surface of a second antiparallel 
sheet; Fig. 8-40) to the right and the exterior to the left. The main
chain is gray, nonpolar side chains are orange, and polar side
chains are purple.
See Kinemage Exercise 3-3
Figure 8-45 One subunit of the enzyme glyceraldehyde-3-
phosphate dehydrogenase from Bacillus stearothermophilus.
The polypeptide folds into two distinct domains. The N-terminal
domain (light blue, residues 1–146) binds NAD
⫹
(drawn in stick
form with C green, N blue, O red, and P magenta) near the
C-terminal ends of its parallel  strands, and the C-terminal
domain (orange, residues 148–333) binds glyceraldehyde-3-
phosphate (not shown). [After Biesecker, G., Harris, J.I.,Thierry,
J.C.,Walker, J.E., and Wonacott,A., Nature 266, 331 (1977).]
See Interactive Exercise 5
Greek key
NC
4123
NC
41
2 3
fold
(d)
(a) (b) (c)
Figure 8-46 Schematic diagrams of supersecondary structures.
(a) A ␣ motif, (b) a  hairpin motif, (c) an ␣␣ motif, and (d) a
Greek key motif, showing how it is constructed from a folded-over
 hairpin.
JWCL281_c08_221-277.qxd 10/19/10 7:14 AM Page 249
as to permit their contacting side chains to interdigitate ef-
ficiently. Such energetically favorable associations stabilize
the coiled coil conformation of ␣ keratin (Section 8-2A).
4. In the Greek key motif (Fig. 8-46d; named after an
ornamental design commonly used in ancient Greece; see
inset), a  hairpin is folded over to form a four-stranded an-
tiparallel  sheet.Of the 10 possible ways of connecting the
strands of a four-stranded antiparallel  sheet, the two that
form Greek key motifs are, by far, the most common in
proteins of known structure.
Groups of motifs combine in overlapping and nonoverlap-
ping ways to form the tertiary structure of a domain, which
is called a fold.
The number of possible different folds would, of
course, seem to be unlimited. However, comparisons of
the now large number of known protein structures have
revealed that few protein folds are unique; that is, most
proteins of known structure have folds that also occur in
unrelated proteins. Indeed, theoretical considerations sug-
gest there are less than 8000 naturally occurring folds. Of
250 Chapter 8. Three-Dimensional Structures of Proteins
NC
NC
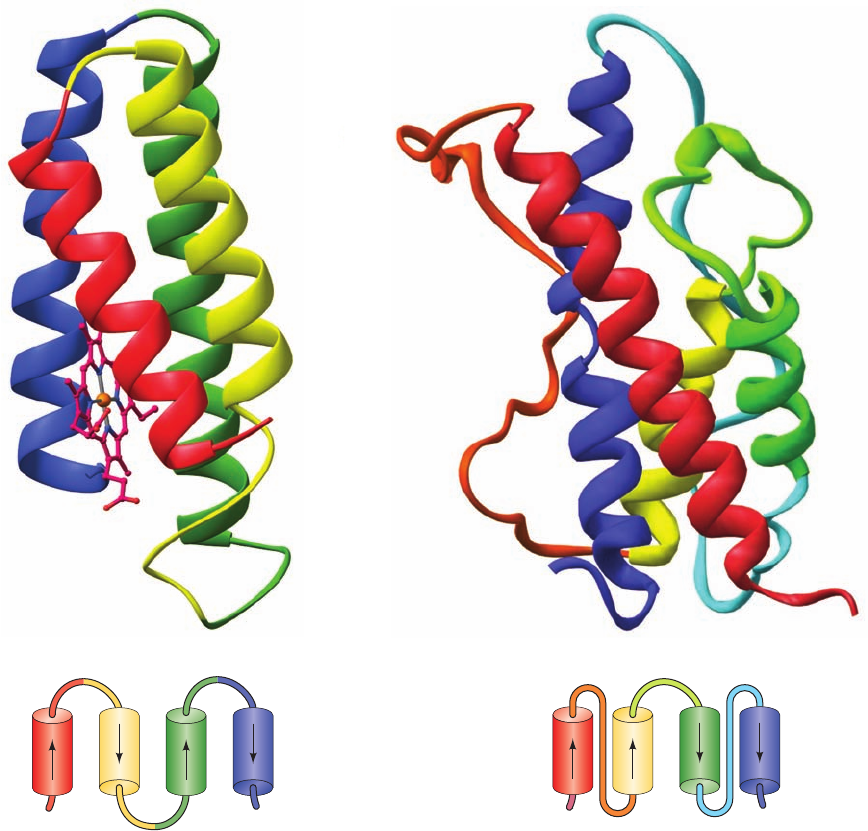
Figure 8-47 X-ray structures of 4-helix bundle proteins. (a) E.
coli cytochrome b
562
and (b) human growth hormone.The proteins
are represented by their peptide backbones drawn in ribbon
form colored in rainbow order from N-terminus (red) to
C-terminus (blue). Cytochrome b
562
’s bound heme group is
shown in ball-and-stick form with C magenta, N blue, O red, and
Fe orange.The inset below each ribbon diagram is a topological
diagram indicating the connectivity of the ␣ helices in each
4-helix bundle. Cytochrome b
562
(106 residues) has up-down-up-
down topology, whereas human growth hormone (191 residues)
has up-up-down-down topology. Note that the N- and C-terminal
helices of human growth hormone are longer than its other two
helices, so that, at one end, these longer helices associate as an
␣␣ motif. [Based on X-ray structures by (a) F. Scott Matthews,
Washington University School of Medicine, and (b) Alexander
Wlodawer, National Cancer Institute, Frederick, Maryland.
PDBids (a) 256B and (b) 1HGU.]
(a)
(b)
JWCL281_c08_221-277.qxd 6/3/10 9:47 AM Page 250
