Tsoulfanidis N. Measurement and detection of radiation
Подождите немного. Документ загружается.

58
MEASUREMENT
AND
DETECTION OF RADIATION
Equation 2.87 should not be used if it is specified what the change of
variable is, i.e., if the change is a decrease or an 'increase. If the change is
known, one should calculate the function f(x,, x,,
. . .
,
x,) using the new values
of the x's and obtain Af by subtracting the new from the old value.
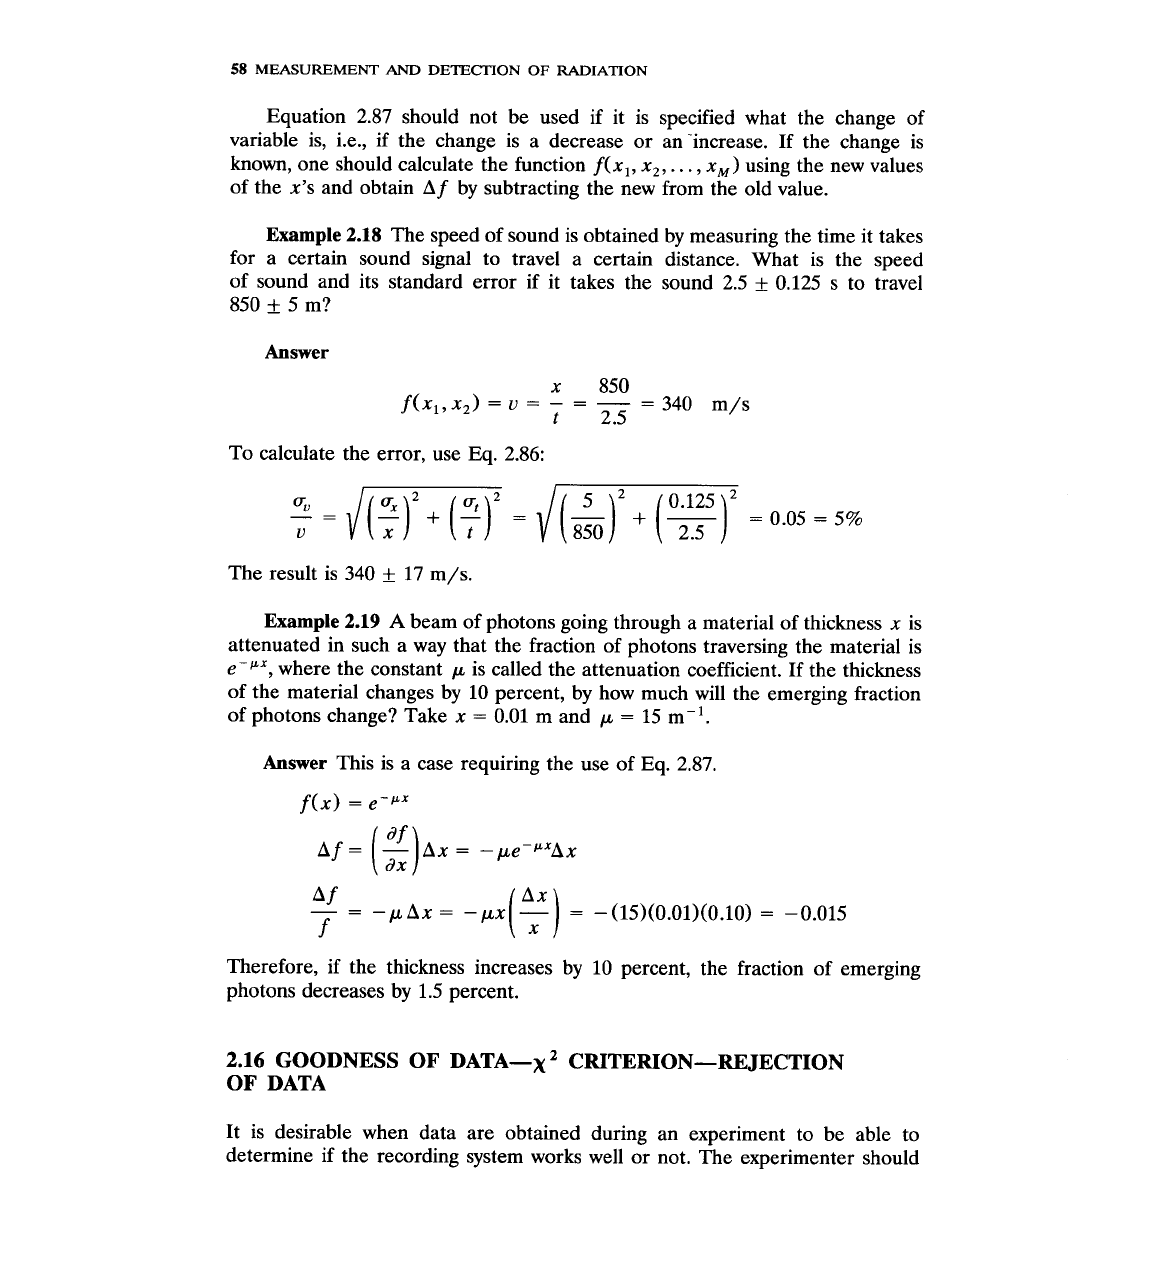
Example
2.18
The speed of sound is obtained by measuring the time it takes
for a certain sound signal to travel a certain distance. What is the speed
of sound and its standard error if it takes the sound 2.5
+
0.125 s to travel
850
+
5 m?
Answer
To calculate the error, use Eq. 2.86:
The result is 340
f
17 m/s.
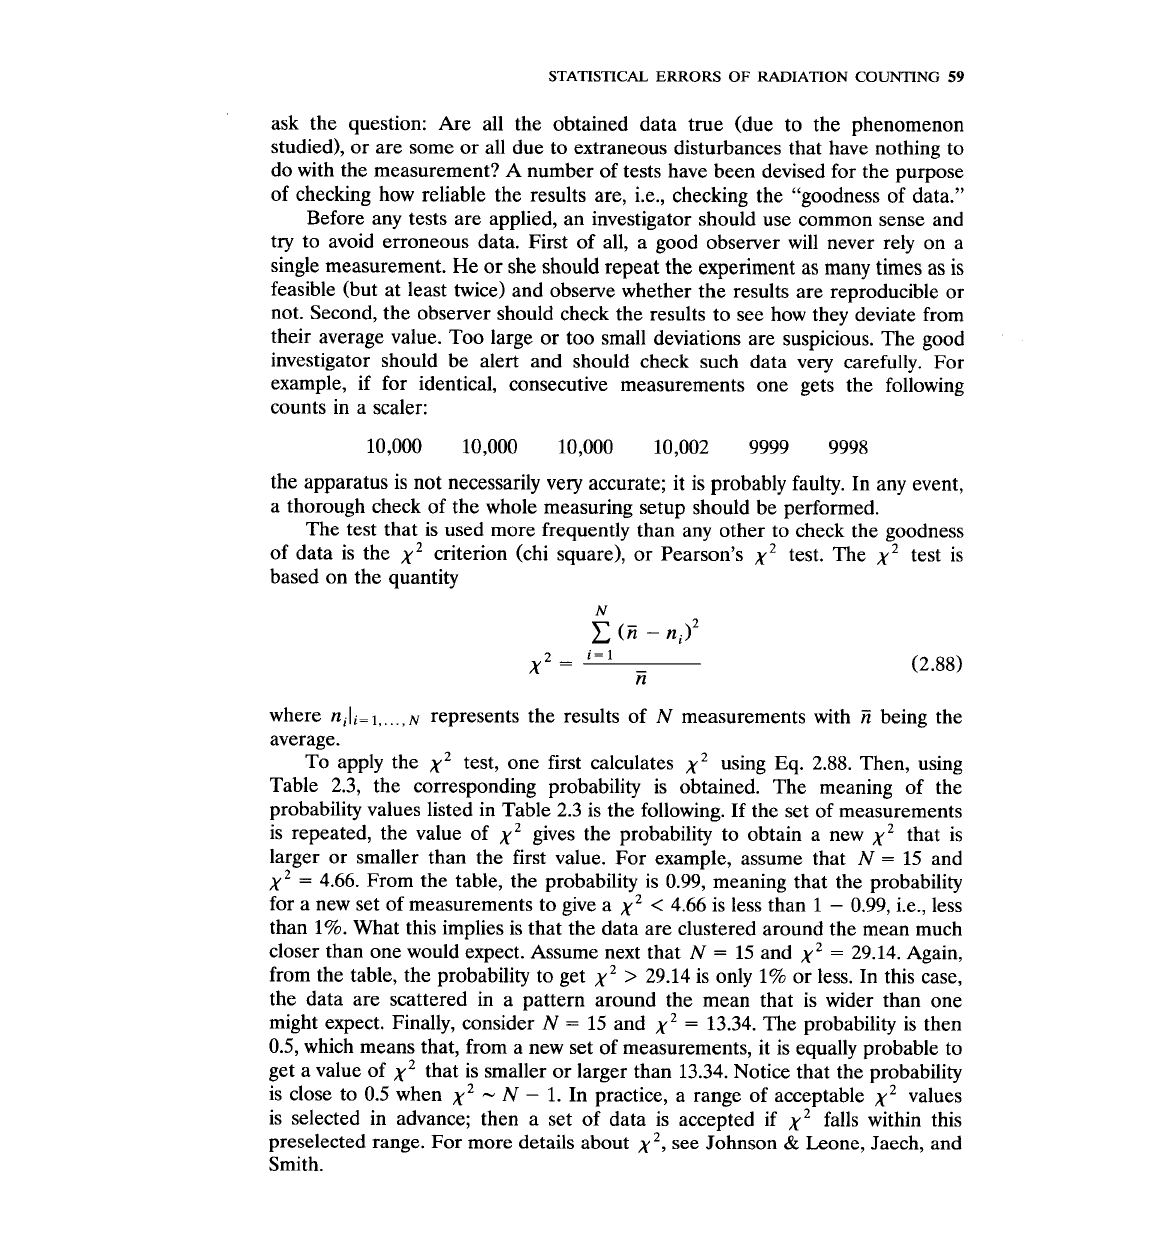
Example
2.19
A
beam of photons going through a material of thickness x is
attenuated in such a way that the fraction of photons traversing the material is
e-PX, where the constant
p
is called the attenuation coefficient. If the thickness
of the material changes by 10 percent, by how much will the emerging fraction
of photons change? Take x
=
0.01
m
and
p
=
15 m-'.
Answer
This is a case requiring the use of Eq. 2.87.
f(x)
=
e-Px
Therefore, if the thickness increases by 10 percent, the fraction of emerging
photons decreases by 1.5 percent.
2.16
GOODNESS OF DATA-x CRITERION-REJECTION
OF DATA
It is desirable when data are obtained during an experiment to be able to
determine if the recording system works well or not. The experimenter should
STATISTICAL ERRORS OF RADIATION COUNTING
59
ask the question: Are all the obtained data true (due to the phenomenon
studied), or are some or all due to extraneous disturbances that have nothing to
do with the measurement? A number of tests have been devised for the purpose
of checking how reliable the results are, i.e., checking the "goodness of data."
Before any tests are applied, an investigator should use common sense and
try to avoid erroneous data. First of all, a good observer will never rely on a
single measurement. He or she should repeat the experiment as many times as is
feasible (but at least twice) and observe whether the results are reproducible or
not. Second, the observer should check the results to see how they deviate from
their average value. Too large or too small deviations are suspicious. The good
investigator should be alert and should check such data very carefully. For
example, if for identical, consecutive measurements one gets the following
counts in a scaler:
the apparatus is not necessarily very accurate; it is probably faulty. In any event,
a thorough check of the whole measuring setup should be performed.
The test that is used more frequently than any other to check the goodness
of data is the
x2
criterion (chi square), or Pearson's
x2
test. The
X2
test is
based on the quantity
where
nili=l,,,.,N
represents the results of
N
measurements with
E
being the
average.
To apply the
X2
test, one first calculates
X2
using
Eq.
2.88.
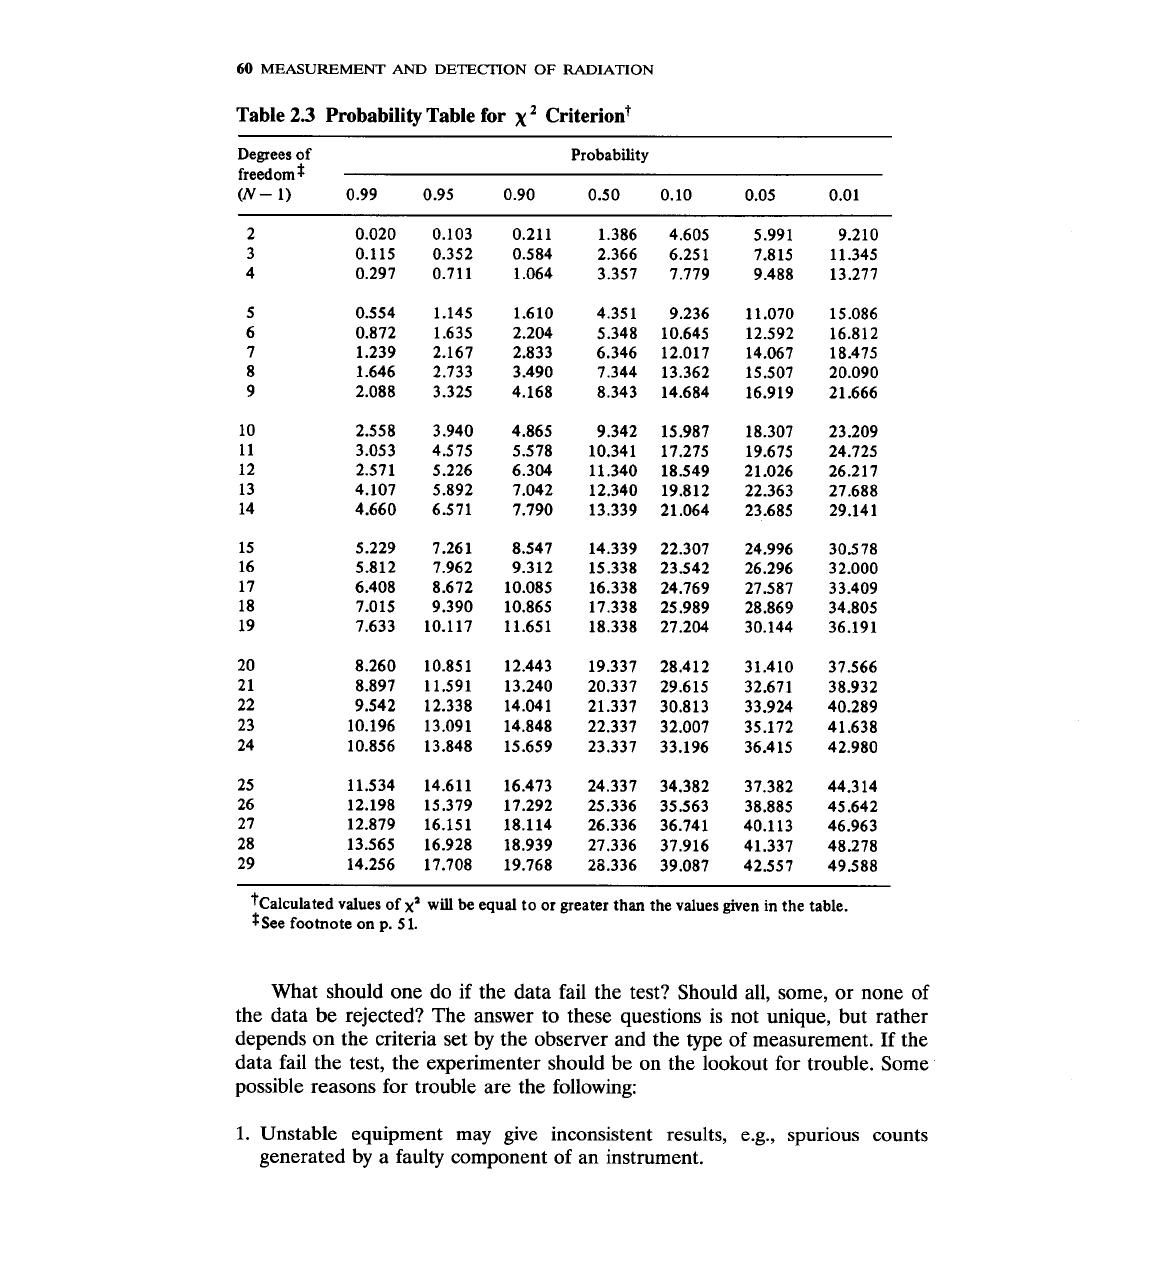
Then, using
Table 2.3, the corresponding probability is obtained. The meaning of the
probability values listed in Table 2.3 is the following. If the set of measurements
is repeated, the value of
x2
gives the probability to obtain a new
X2
that is
larger or smaller than the first value. For example, assume that
N
=
15 and
x2
=
4.66. From the table, the probability is 0.99, meaning that the probability
for a new set of measurements to give a
x2
<
4.66 is less than
1
-
0.99, i.e., less
than 1%. What this implies is that the data are clustered around the mean much
closer than one would expect. Assume next that
N
=
15
and
X2
=
29.14. Again,
from the table, the probability to get
X2
>
29.14 is only 1% or less. In this case,
the data are scattered in a pattern around the mean that is wider than one
might expect. Finally, consider
N
=
15 and
X2
=
13.34. The probability is then
0.5, which means that, from a new set of measurements, it is equally probable to
get a value of
x2
that is smaller or larger than 13.34. Notice that the probability
is close to 0.5 when
x2
N
-
1.
In practice, a range of acceptable
X2
values
is selected in advance; then a set of data is accepted if
x2
falls within this
preselected range. For more details about
X2,
see Johnson
&
Leone, Jaech, and
Smith.
60
MEASUREMENT
AND
DETECTION OF
RADIATION
Table
2.3
Probability Table for
x
Criteriont
Degrees of Probability
freedom
$
(N-
1) 0.99 0.95 0.90 0.50 0.10 0.05 0.01
?calculated values of
xa
will
be equal to or greater than the values given in the table.
$see footnote on
p. 5
1.
What should one do if the data fail the test? Should all, some, or none of
the data be rejected? The answer to these questions is not unique, but rather
depends on the criteria set by the observer and the type of measurement. If the
data fail the test, the experimenter should be on the lookout for trouble. Some
possible reasons for trouble are the following:
1.
Unstable equipment may give inconsistent results, e.g., spurious counts
generated by
a
faulty component of an instrument.
STATISTICAL
ERRORS
OF
RADIATION
COUNTING
61
2. External signals may be picked up by the apparatus and be "recorded."
Sparks, radio signals, welding machines, etc., produce signals that may be
recorded by a pulse-type counting system.
3.
If a number of samples are involved, widely scattered results may be caused
by lack of sample uniformity.
4.
A
large
X2
may result from one or two measurements that fall far away from
the average. Such results are called the "outliers." Since the results are
governed by the normal distribution, which extends from
-m
to +m, in
theory, at least, all results are possible. In practice, it is somewhat disturbing
to have a few results that seem to be way out of line.
Should the outliers be rejected? And by what criterion? One should be
conservative when rejecting data for three reasons:
1.
The results are random variables following the Gaussian distribution. There-
fore, outliers are possible.
2.
As
the number of measurements increases, the probability of an outlier
increases.
3.
In a large number of measurements, the rejection of an outlier has small
effect on the average, although it makes the data look better by decreasing
the dispersion.
One of the criteria used for data rejection is Chauvenet's criterion, stated as
follows:
A
reading or outcome may be rejected if it has a deviation from the mean greater than that
corresponding to the
1
-
1/2N
error, where
N
is the number of measurements.
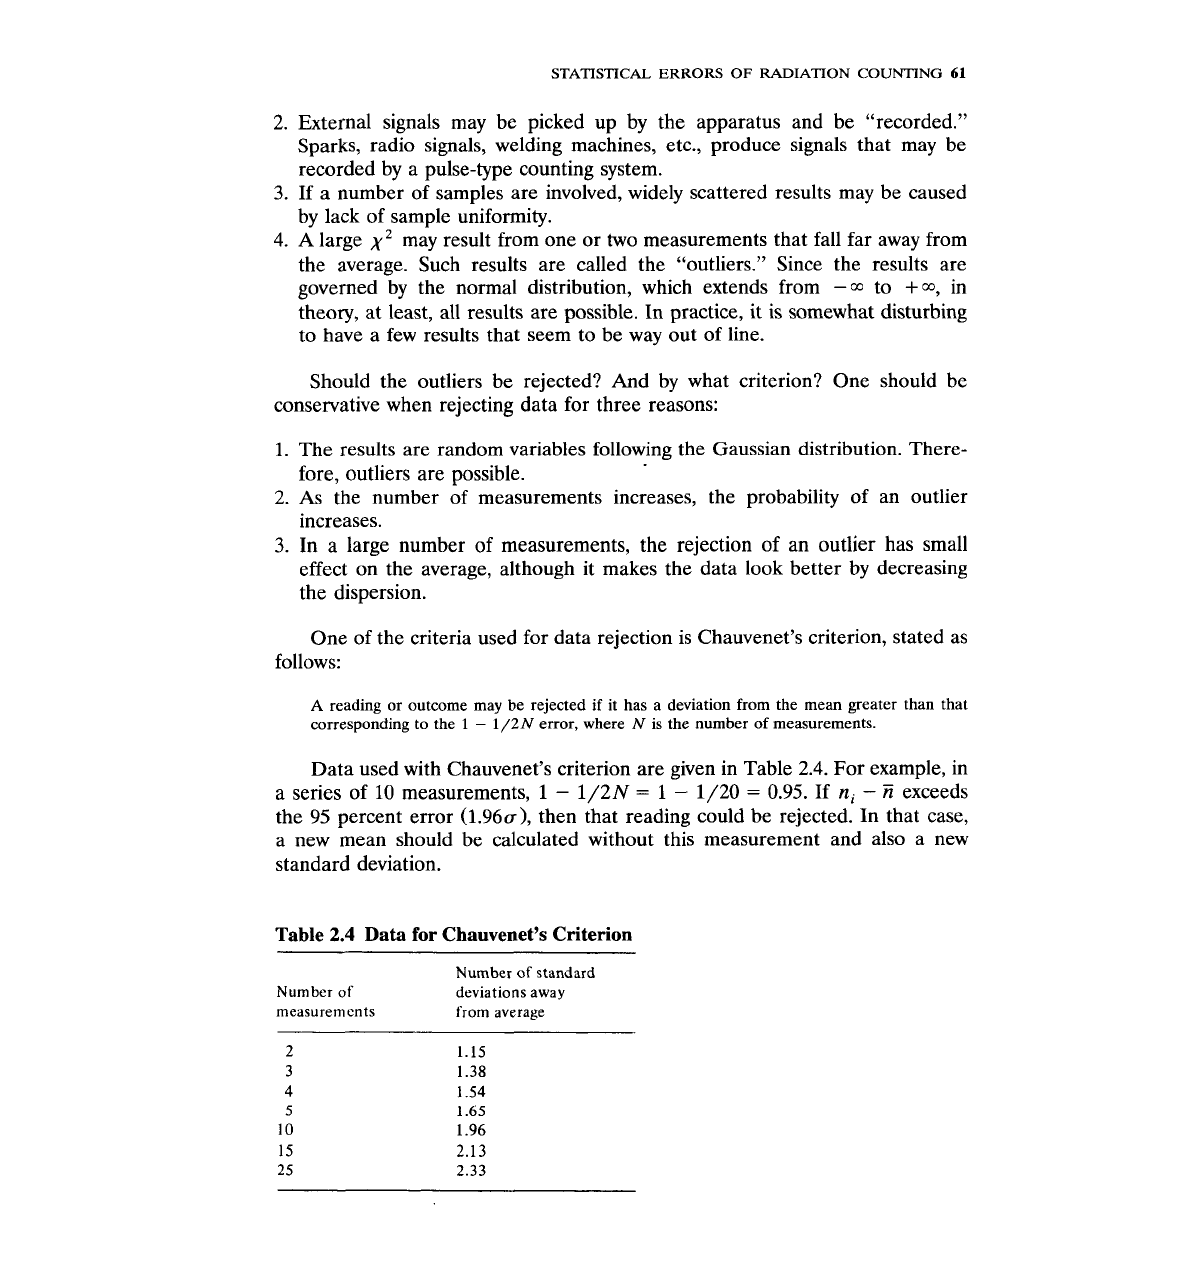
Data used with Chauvenet's criterion are given in Table
2.4.
For example, in
a series of 10 measurements,
1
-
1/2N
=
1
-
1/20
=
0.95. If
ni
-
Ti
exceeds
the
95
percent error
(1.96a),
then that reading could be rejected. In that case,
a new mean should be calculated without this measurement and also a new
standard deviation.
Table
2.4
Data for Chauvenet's Criterion
Number
of
standard
Number
of
deviations away
measurements
from average
62
MEASUREMENT
AND
DETECTION
OF
RADIATION
The use of Chauvenet's, or any other, criterion is not mandatory. It is up to
the observer to decide if a result should be rejected or not.
2.17
THE STATISTICAL ERROR OF
RADIATION MEASUREMENTS
Radioactive decay is a truly random process that obeys the Poisson distribution,
according to which the standard deviation of the true mean
m
is
6.
However,
the true mean is never known and can never be found from a finite number of
measurements. But is there a need for a large number of measurements?
Suppose one performs only one measurement and the result is
n
counts.
The best estimate of the true mean, as a result of this single measurement, is
this number
n.
If one takes this to be the mean, its standard deviation will be
6.
Indeed, this is what is done in practice. The result of a single count
n
is
reported as
n
f
6, which implies that
1.
The outcome
n
is considered the true mean.
2.
The standard deviation is reported as the standard error of
n.
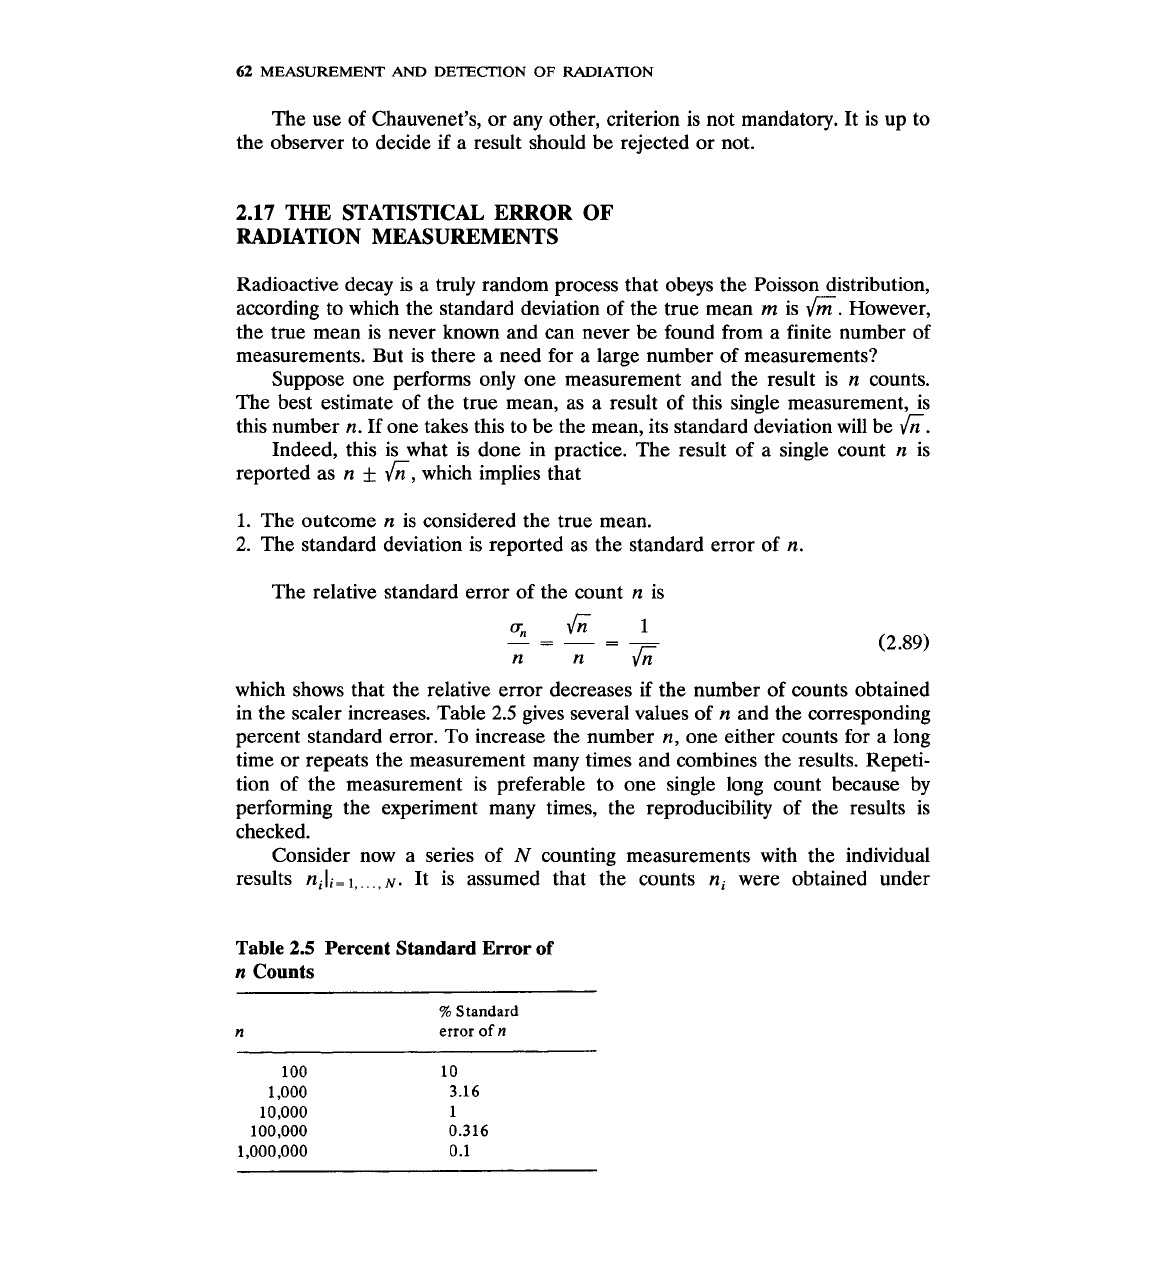
The relative standard error of the count
n
is
which shows that the relative error decreases if the number of counts obtained
in the scaler increases. Table
2.5
gives several values of
n
and the corresponding
percent standard error. To increase the number
n,
one either counts for a long
time or repeats the measurement many times and combines the results. Repeti-
tion of the measurement is preferable to one single long count because by
performing the experiment many times, the reproducibility of the results is
checked.
Consider now
a
series of
N
counting measurements with the individual
results
nili=
It is assumed that the counts
ni
were obtained under
Table
2.5
Percent Standard Error of
n
Counts
%
Standard
error of
n
STATISTICAL
ERRORS
OF
RADIATION
COUNTING
63
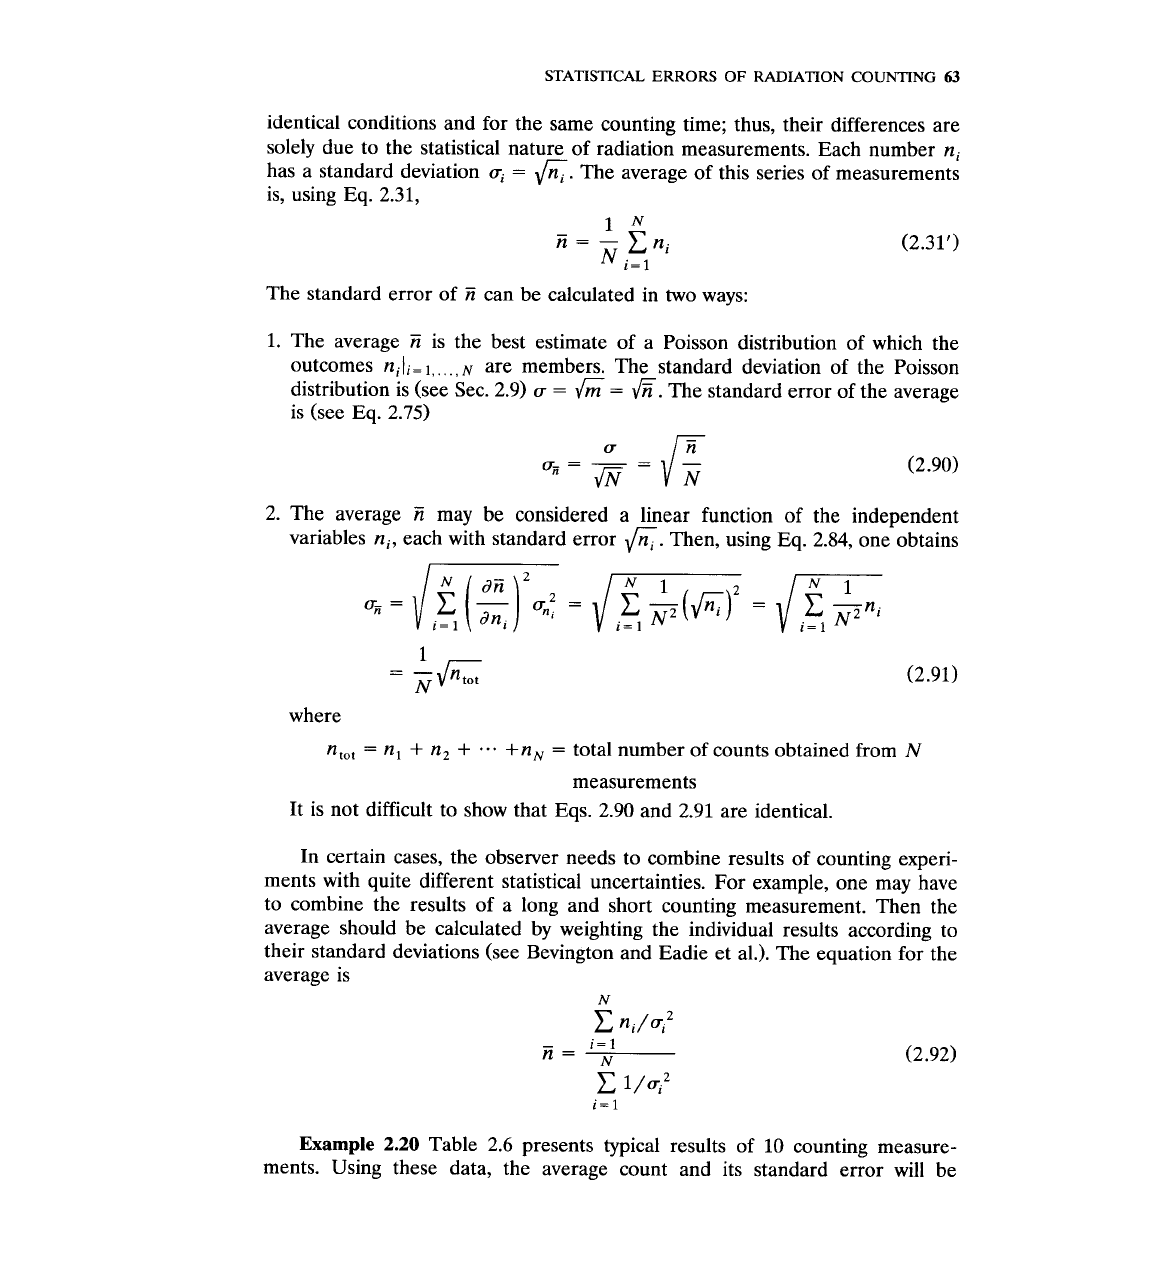
identical conditions and for the same counting time; thus, their differences are
solely due to the statistical nature of radiation measurements. Each number ni
has a standard deviation
ui
=
fi.
The average of this series of measurements
is, using Eq. 2.31,
-
1
N
n=-
C
ni (2.31')
N
The standard error of
7i
can be calculated in two ways:
1.
The average
7i
is the best estimate of a Poisson distribution of which the
outcomes nili=
I,.
.
.
,
N
are members. The standard deviation of the Poisson
distribution is (see Sec. 2.9)
u
=
6
=
6.
The standard error of the average
is (see Eq. 2.75)
2. The average
7i
may be considered a linear function of the independent
variables ni, each with standard error
6.
Then, using
Eq.
2.84, one obtains
where
n,,,
=
n,
+
n,
+
...
+n,
=
total number of counts obtained from
N
measurements
It is not difficult to show that Eqs. 2.90 and 2.91 are identical.
In certain cases, the observer needs to combine results of counting experi-
ments with quite different statistical uncertainties. For example, one may have
to combine the results of a long and short counting measurement. Then the
average should be calculated by weighting the individual results according to
their standard deviations (see Bevington and Eadie et al.). The equation for the
average is
N
C
ni/ui2
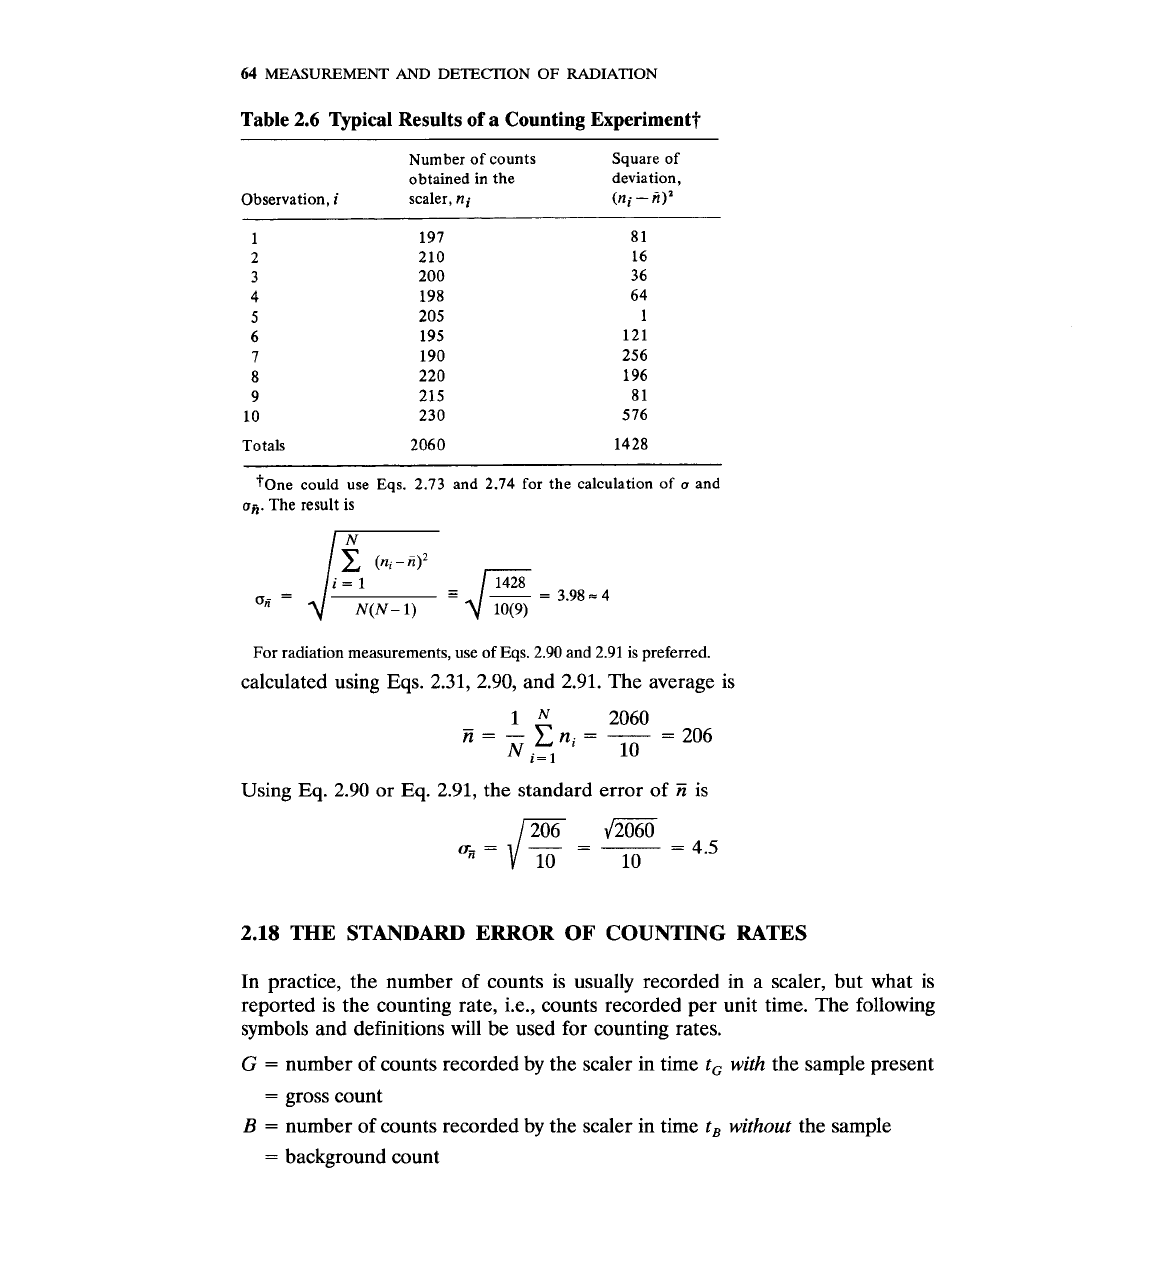
Example
2.20
Table
2.6
presents typical results of 10 counting measure-
ments. Using these data, the average count and its standard error will be
64
MEASUREMENT
AND
DETECTION OF RADIATION
Table
2.6
Typical Results of a Counting Experiment?
Number of counts Square of
obtained in the deviation,
Observation,
i
scaler,
ni
(ni
-
ii)'
Totals
tone could use Eqs. 2.73 and 2.74 for the calculation of
o
and
on
The result is
For radiation measurements, use of
Eqs.
2.90
and
2.91
is preferred.
calculated using Eqs. 2.31, 2.90, and 2.91. The average is
Using
Eq.
2.90 or
Eq.
2.91, the standard error of
E
is
2.18
THE STANDARD ERROR OF COUNTING RATES
In practice, the number of counts is usually recorded in a scaler, but what is
reported is the counting rate, i.e., counts recorded per unit time. The following
symbols and definitions will be used for counting rates.
G
=
number of counts recorded by the scaler in time
t, with
the sample present
=
gross count
B
=
number of counts recorded by the scaler in time
t, without
the sample
=
background count
STATISTICAL
ERRORS
OF
RADIATION
COUNTING
65
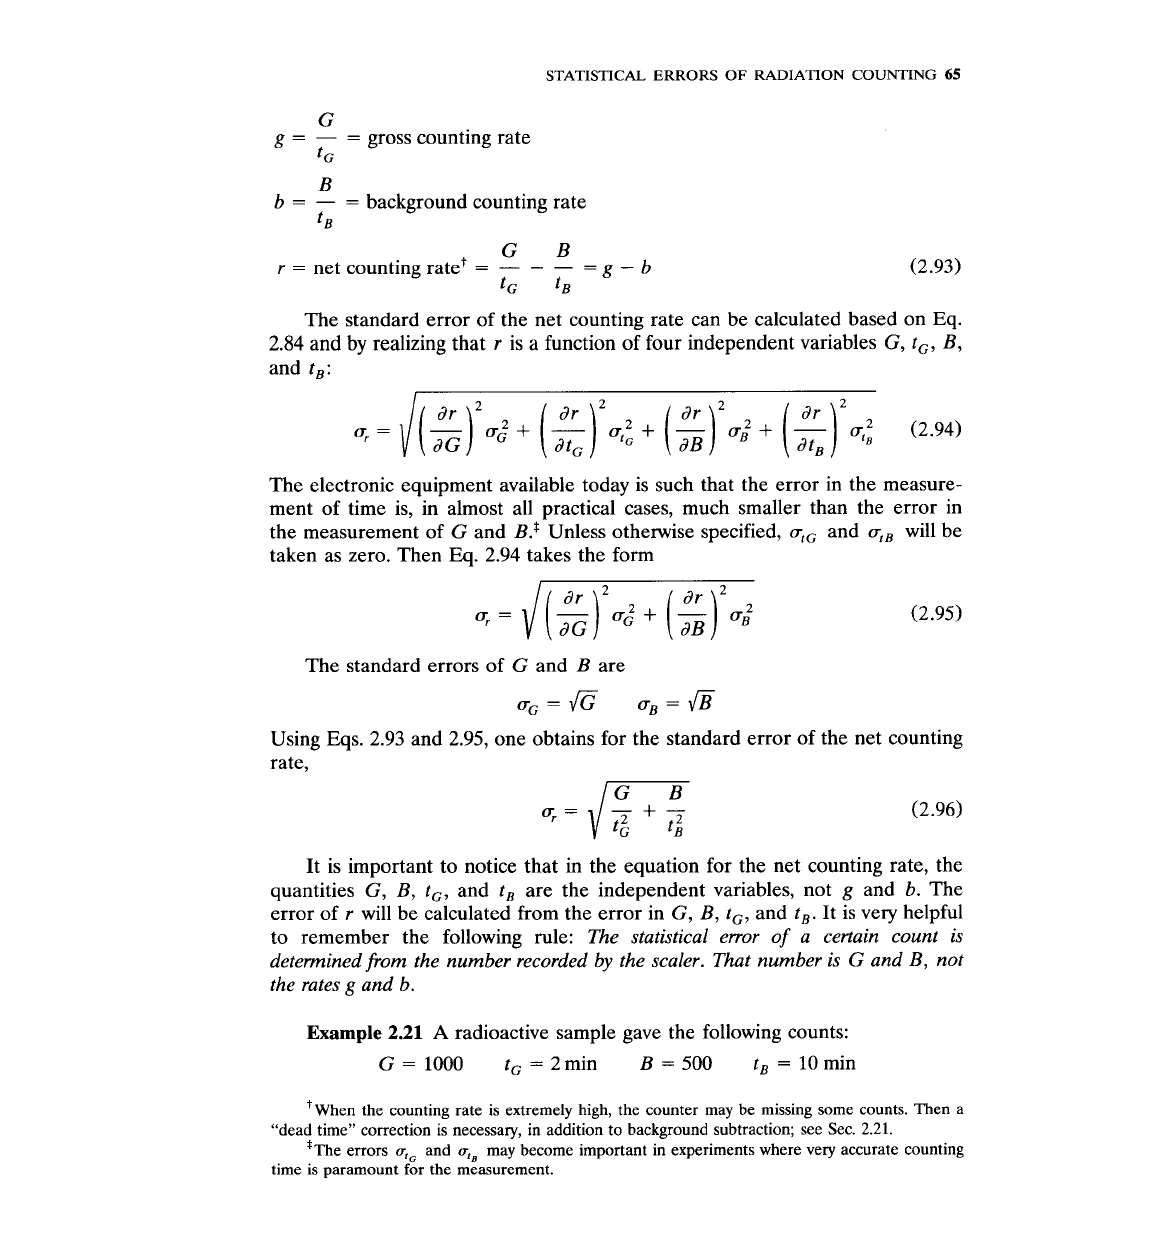
G
g=
-
=
gross counting rate
t
G
B
b
=
-
=
background counting rate
t
B
r
=
net counting ratet
=
-
-
-
=
g-b
tG t,
The standard error of the net counting rate can be calculated based on
Eq.
2.84
and by realizing that
r
is a function of four independent variables
G, t,, B,
and
t,:
The electronic equipment available today is such that the error in the measure-
ment of time is, in almost all practical cases, much smaller than the error in
the measurement of
G
and
B.*
Unless otherwise specified,
ut,
and
ul,
will be
taken as zero. Then Eq.
2.94
takes the form
The standard errors of
G
and
B
are
uG=G uB=@
Using Eqs.
2.93
and 2.95, one obtains for the standard error of the net counting
rate,
It is important to notice that in the equation for the net counting rate, the
quantities
G,
B,
t,,
and
t,
are the independent variables, not
g
and
b.
The
error of
r
will be calculated from the error in
G,
B,
t,,
and
t,.
It is very helpful
to remember the following rule:
The statistical error of a certain count is
determined from the number recorded by the scaler. That number is
G
and B, not
the rates g and b.
Example
2.21
A
radioactive sample gave the following counts:
G
=
1000
t,
=
2min
B
=
500
t,
=
10
min
'when the counting rate is extremely high, the counter may be missing some counts. Then a
"dead time" correction is necessary, in addition to background subtraction; see Sec.
2.21.
?he errors
utG
and
utB
may become important in experiments where very accurate counting
time is paramount for the measurement.
66
MEASUREMENT
AND
DETECTION OF RADIATION
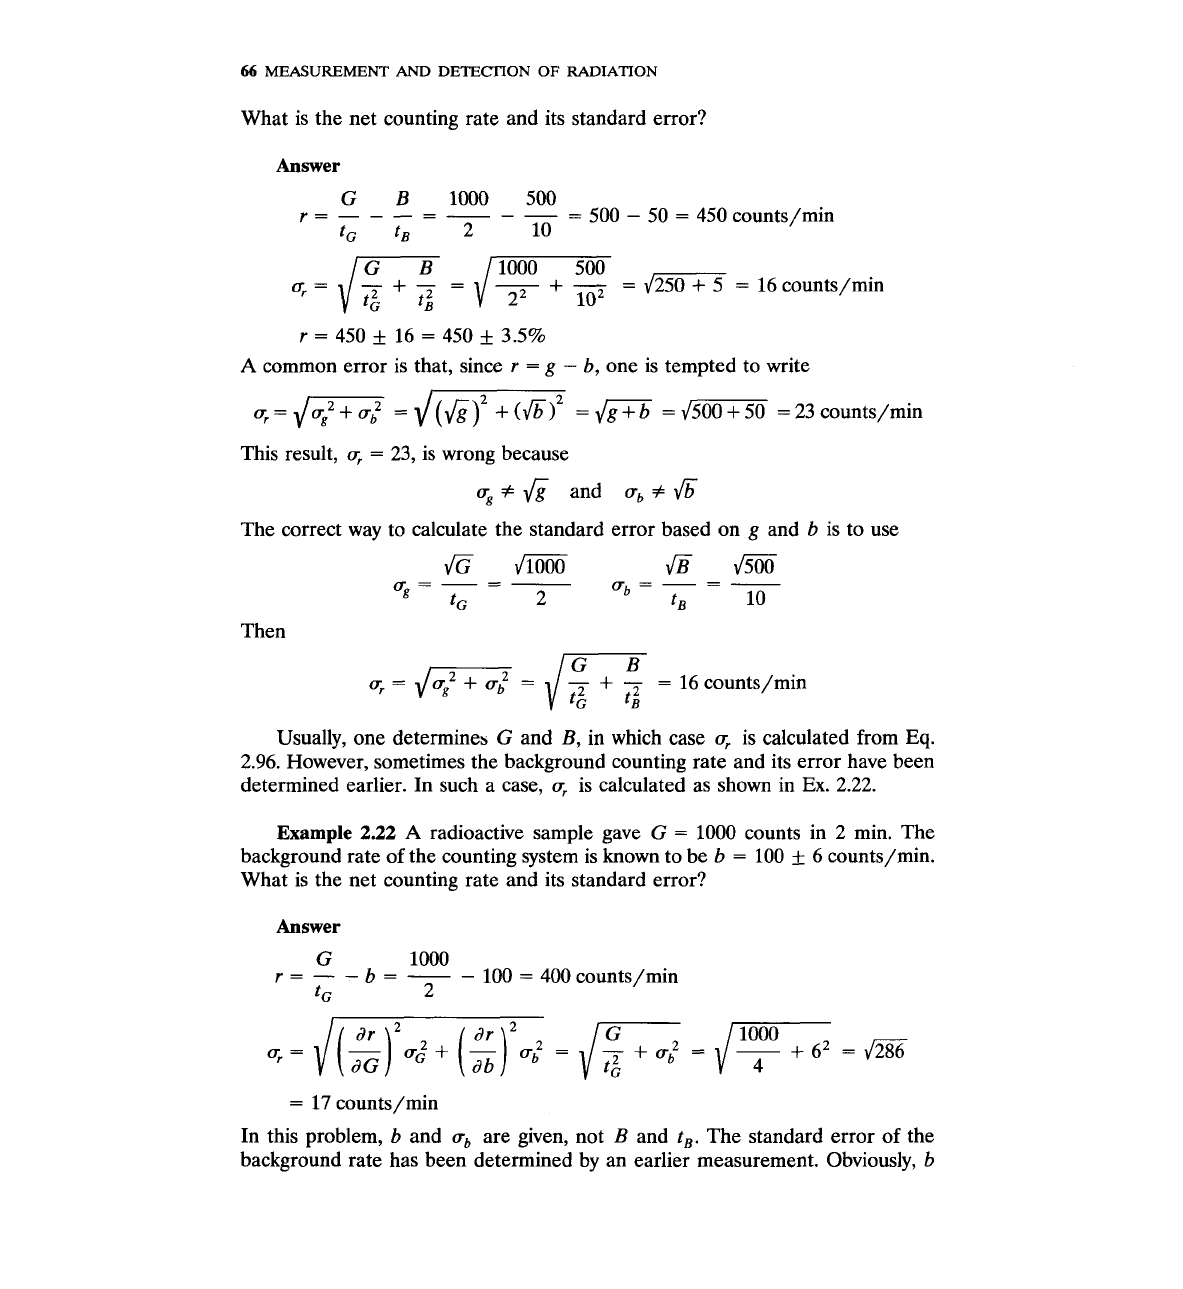
What is the net counting rate and its standard error?
Answer
r
=
450
f
16
=
450
f
3.5%
A
common error is that, since
r
=
g
-
b,
one is tempted to write
This result,
a,
=
23,
is wrong because
u-
#
&
and
ub #
6'
The correct way to calculate the standard error based on
g
and
b
is to use
G
m
g==-
JB
m
-
g
2
a,=---
t,
t
B
10
Then
Usually, one determines
G
and B,
in
which case
a,
is calculated from
Eq.
2.96.
However, sometimes the background counting rate and its error have been
determined earlier. In such a case,
a,
is calculated as shown in
Ex.
2.22.
Example
2.22
A
radioactive sample gave
G
=
1000 counts in
2
min. The
background rate of the counting system is known to be
b
=
100
k
6 counts/min.
What is the net counting rate and its standard error?
Answer
In this problem,
b
and
a,,
are given, not B and
t,.
The standard error of the
background rate has been determined by an earlier measurement. Obviously,
b
STATISTICAL
ERRORS
OF
RADIATION
COUNTING
67
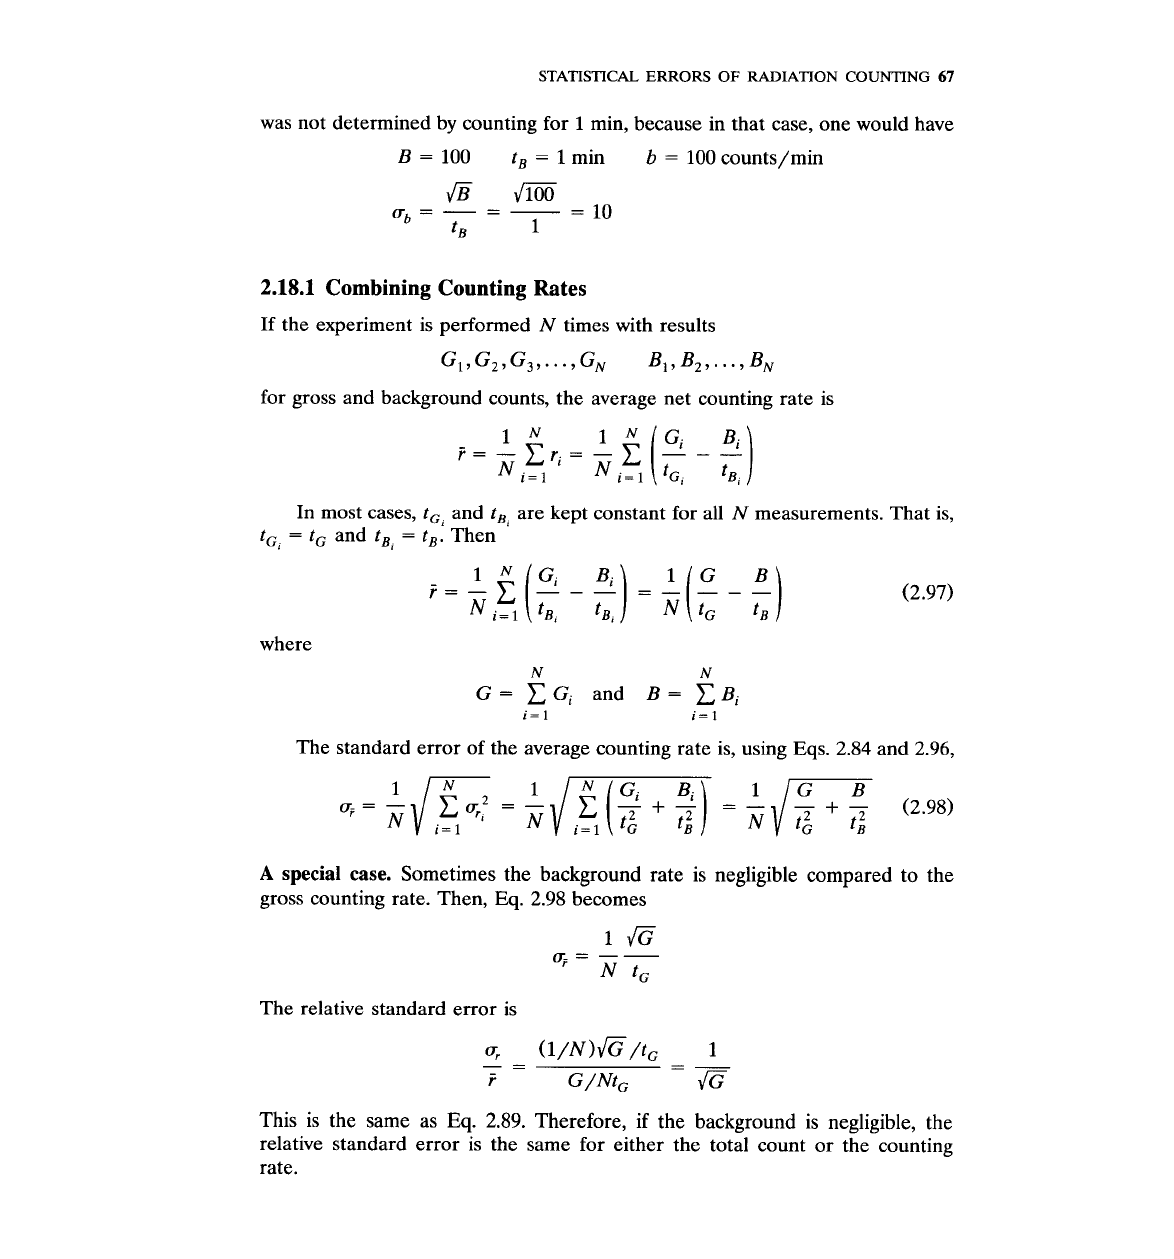
was not determined by counting for
1
min, because in that case, one would have
B
=
100
t,
=
1
min
b
=
100
counts/min
2.18.1
Combining Counting Rates
If the experiment is performed
N
times with results
G~,G,,G~,...,GN B~,B~,...,BN
for gross and background counts, the average net counting rate is
In most cases,
t,,
and
t,,
are kept constant for all
N
measurements. That is,
t,,
=
t,
and
t,,
=
t,.
Then
where
N
N
G
=
C
Gi
and
B
=
C
Bi
The standard error of the average counting rate is, using Eqs. 2.84 and 2.96,
A
special case.
Sometimes the background rate is negligible compared to the
gross counting rate. Then,
Eq.
2.98 becomes
1
a
(T.
=
--
N
t,
The relative standard error is
This is the same as
Eq.
2.89.
Therefore, if the background is negligible, the
relative standard error is the same for either the total count or the counting
rate.