Stewart J. College Algebra: Concepts and Contexts
Подождите немного. Документ загружается.

CONTEXTS
x y
3 0.003
6 0.012
9 0.042
12 0.153
15 0.551
18 1.992
21 7.239
24 26.279
x y
1 1.5
2 5.1
3 11.3
4 20.1
5 32.4
6 45.5
7 62.1
8 81.1
9 102.8
10 127.0
x y
10 29
20 82
30 151
40 235
50 330
60 430
70 546
80 669
90 797
100 935
x y
2 0.08
4 0.12
6 0.18
8 0.25
10 0.36
12 0.52
14 0.73
16 1.06
524 CHAPTER 6
■
Power, Polynomial, and Rational Functions
11. 12. 13. 14.
17. Lead Emissions The table at the left gives U.S. lead emissions into the environment
in millions of metric tons for 1970–1992.
(a) Make a scatter plot of the data.
(b) Find an exponential model for these data. (Use for the year 1970.)
(c) Find a fourth-degree polynomial that models the data.
(d) Which of these curves gives a better model for the data? Use graphs of the two
models to decide.
t = 0
15. A Falling Ball In a physics experiment a lead ball is dropped from a height of 5 meters.
The students record the distance the ball has fallen every one-tenth of a second. (This can
be done by using a camera and a strobe light.)
(a) Make a scatter plot of the data.
(b) Use a graphing calculator to find a power function of the form that models
the distance d that the ball has fallen after t seconds.
(c) Draw a graph of the function you found and the scatter plot on the same graph.
How well does the model fit the data?
(d) Use your model to predict how far a dropped ball would fall in 3 seconds.
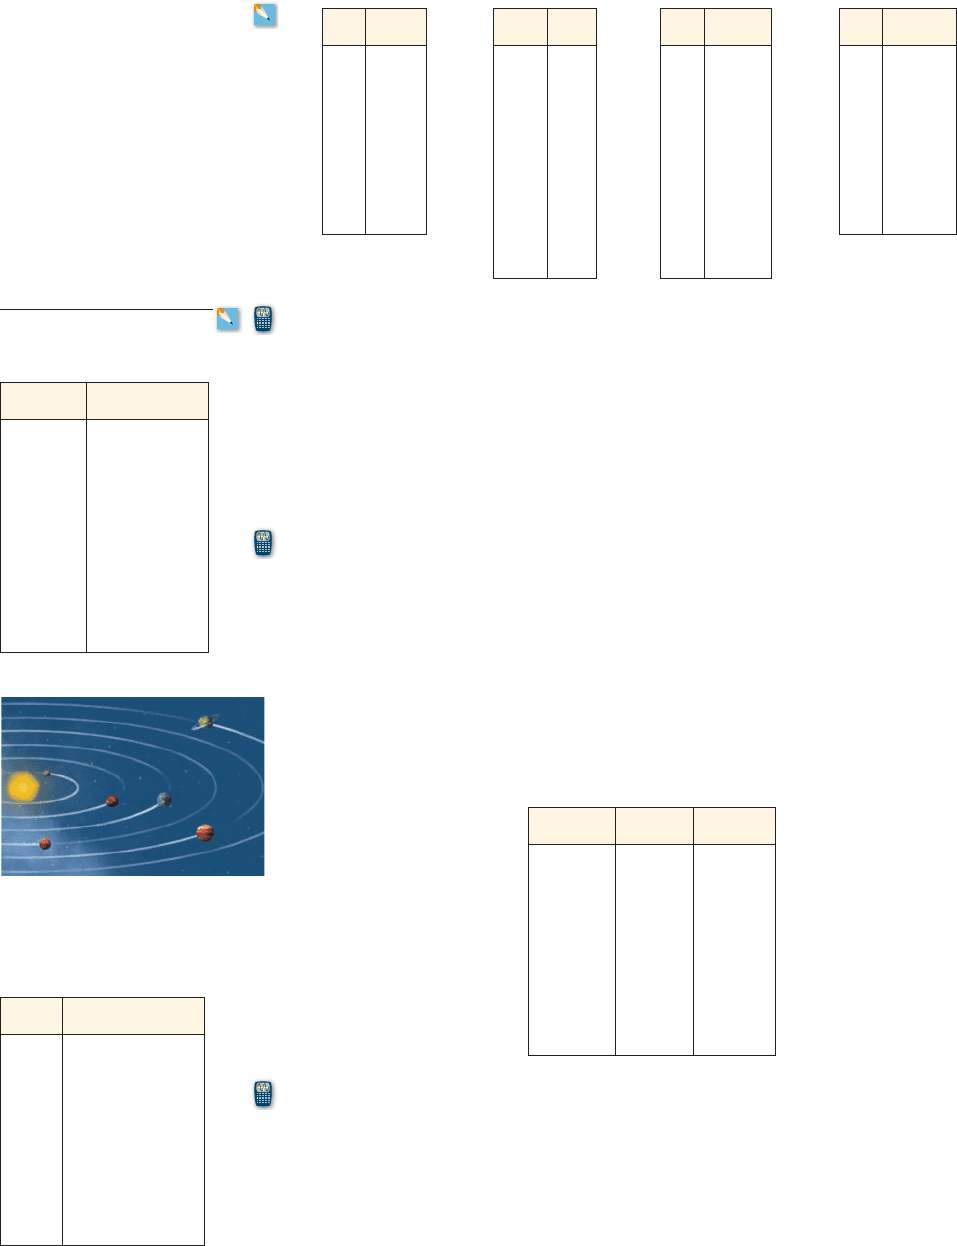
16. Kepler’s Law for Periods of the Planets For each planet, its mean distance d from
the sun [in astronomical units (AU)] and its period T (in years) are given in the table.
(Although Pluto is no longer considered a planet, we include it in the table because the
distance-period relationship we study here applies to any body orbiting the sun.)
(a) Make a scatter plot of the data. Is a linear model appropriate?
(b) Find a power function that models the data.
(c) Draw a graph of the function you found and the scatter plot on the same graph.
How well does the model fit the data?
(d) Use the model that you found to calculate the period of an asteroid whose mean
distance from the sun is 5 AU.
d = at
b
Time (s) Distance (m)
0.1 0.048
0.2 0.197
0.3 0.441
0.4 0.882
0.5 1.227
0.6 1.765
0.7 2.401
0.8 3.136
0.9 3.969
1.0 4.902
Year Lead emissions
1970 199.1
1975 143.8
1980 68.0
1985 18.3
1988 5.9
1989 5.5
1990 5.1
1991 4.5
1992 4.7
Planet d (AU) T (yr)
Mercury 0.387 0.241
Venus 0.723 0.615
Earth 1.000 1.000
Mars 1.523 1.881
Jupiter 5.203 11.861
Saturn 9.541 29.457
Uranus 19.190 84.008
Neptune 30.086 164.784
Pluto 39.507 248.350
Mercury
Sun
Mars
Venus
Earth
Saturn
Jupiter
Distance and period

SECTION 6.4
■
Fitting Power and Polynomial Curves to Data 525
18. Experimenting with “Forgetting” Curves Every one of us is all too familiar with
the phenomenon of forgetting. Facts that we clearly understood at the time we first
learned them sometimes fade from our memory by the time the final exam rolls around.
Psychologists have proposed several ways to model this process. To develop her own
model, a psychologist performs an experiment on a group of volunteers by asking them
to memorize a list of 100 related words. She then tests how many of these words they
can recall after various periods of time. The average results for the group are shown in
the table.
(a) Use a graphing calculator to find a power function of the form that models
the average number of words y that the volunteers remember after t hours. Then
find an exponential function of the form to model the data.
(b) Make a scatter plot of the data, and graph both functions that you found in part (a)
on your scatter plot.
(c) Which of these curves gives a better model for the data? Use graphs of the two
models to decide.
y = ab
t
y = at
b
Time Words recalled
15 min 64.3
1 h 45.1
8 h 37.3
1 day 32.8
2 days 26.9
3 days 25.6
5 days 22.9
19. Bird Flight Ornithologists measured and catalogued the wingspans and weights of
many different species of birds that can fly. The table below shows the wingspan L for a
bird of weight W.
(a) Use a graphing calculator to find a power function of the form to model
the data.
(b) Use a graphing calculator to find an exponential function of the form to
model the data.
(c) Make a scatter plot of the data, and graph the models that you found in parts (a) and
(b) on your scatter plot. Which of these curves gives a better model for the data?
(d) The extinct dodo weighed about 45 pounds and had a wingspan of about 20 in. Use
the model chosen in part (c) to find the wingspan of a 45-pound (20 kg) bird. Use
this to show why a dodo bird couldn’t fly.
L = ab
W
L = aW
b
Bird Weight (lb) Wingspan (in.)
Turkey vulture 4.40 69
Bald eagle 6.82 84
Great horned owl 3.08 44
Cooper’s hawk 1.03 28
Sandhill crane 9.02 79
Atlantic puffin 0.95 24
California condor 17.82 109
Common loon 7.04 48
Yellow warbler 0.022 8
Common grackle 0.20 16
Wood stork 5.06 63
Mallard 2.42 35
The dodo (now extinct)
Study of a Dodo (oil on canvas), Hart, F (19th Century)/
Royal Albert Memorial Museum, Exeter, Devon, UK/
The Bridgeman Art Library International

526 CHAPTER 6
■
Power, Polynomial, and Rational Functions
20. Biodiversity To test for the biodiversity of trees in a tropical rain forest, biologists
collected data in the Pasoh Forest Reserve of Malaysia. The table in the margin shows
the number of tree species S found for a given area A in the rain forest.*
(a) Use a graphing calculator to find a power function of the form that models
the number of tree species S that are in an area of size A. Then find an exponential
function of the form to model the data.
(b) Make a scatter plot of the data, and graph both functions that you found in part (a)
on your scatter plot.
(c) Which of these curves gives a better model for the data? Use graphs of the two
models to decide.
21. How Fast Can You Name Your Favorite Things? If you are asked to make a list of
objects in a certain category, the speed with which you can list them follows a
predictable pattern. For example, if you try to name as many vegetables as you can,
you’ll probably think of several right away—for example, carrots, peas, beans, corn,
and so on. Then after a pause you might think of ones you eat less frequently—perhaps
zucchini, eggplant, and asparagus. Finally, more exotic vegetables might come to
mind—artichokes, jicama, bok choy, and the like. A psychologist performs this
experiment on a number of subjects. The table below gives the average number of
vegetables that the subjects named within a given number of seconds.
(a) Find the cubic polynomial that best fits the data.
(b) Draw a graph of the polynomial from part (a) together with a scatter plot of the data.
(c) Use your result from part (b) to estimate the number of vegetables that subjects
would be able to name in 40 seconds.
(d) According to the model, how long (to the nearest 0.1 second) would it take a person
to name five vegetables?
S = ab
A
S = aA
b
*K. M. Kochummen, J.V. LaFrankie, and N. Manokaran, “Floristic Composition of Pasoh Forest Reserve,
a Lowland Rain Forest in Peninsular Malaysia,” Journal of Tropical Forest Science, 3:1–13, 1991.
Area
1m
2
2
Observed
number of
species
3.81 3
7.63 3
15.26 12
30.52 13
61.04 31
122.07 70
244.14 112
488.28 134
976.56 236
Seconds Number of vegetables
1 2
2 6
5 10
10 12
15 14
20 15
25 18
30 21
Tree species of the Pasoh
Forest of Malaysia
Layers 1 2 3 4 5 6
Blocks
1 5 14
22. Polynomial Pattern The figure shows a sequence of pyramids made of cubic blocks.
(a) Complete the table for the number of blocks in a pyramid with n layers.
(b) Find the cubic polynomial P that best fits the data you obtained.
(c) Compare the values with the data in the table. Does the
polynomial you found model the data exactly?
P112, P122, P132, p

SECTION 6.5
■
Power Functions: Negative Powers 527
In this section we investigate the behavior of the power function when
the power p is a negative number. We will see that the cases in which p is or
give rise to important applications.
- 2- 1
f 1x2= Cx
p
2
6.5 Power Functions: Negative Powers
■
The Reciprocal Function
■
Inverse Proportionality
■
Inverse Square Laws
IN THIS SECTION… we study power functions with negative powers, their graphs, and
their applications, particularly to inverse square laws.
GET READY… by reviewing the rules for working with exponents in Algebra Toolkits
A.3 and A.4. Test your skills in working with exponents by doing the Algebra Checkpoint
at the end of this section.
2
■ The Reciprocal Function
If C is 1 and p is , the power function is
which is called the reciprocal function.
f 1x2= x
-1
=
1
x
- 1
example
1
The Graph of the Reciprocal Function
Sketch a graph of the reciprocal function .
Solution
The function f is not defined when x is zero. The following tables show that when x
is close to zero, the magnitude of is large, and the closer x gets to zero, the larger
the magnitude of .f 1x 2
f 1x2
f 1x2= 1>x
x
f 1x 2
0.1 10
0.01 100
0.00001 100,000
x
f 1x 2
- 0.1 - 10
- 0.01 - 100
- 0.00001 - 100,000
Approaching
0
-
Approaching
- q
Approaching
0
+
Approaching
q
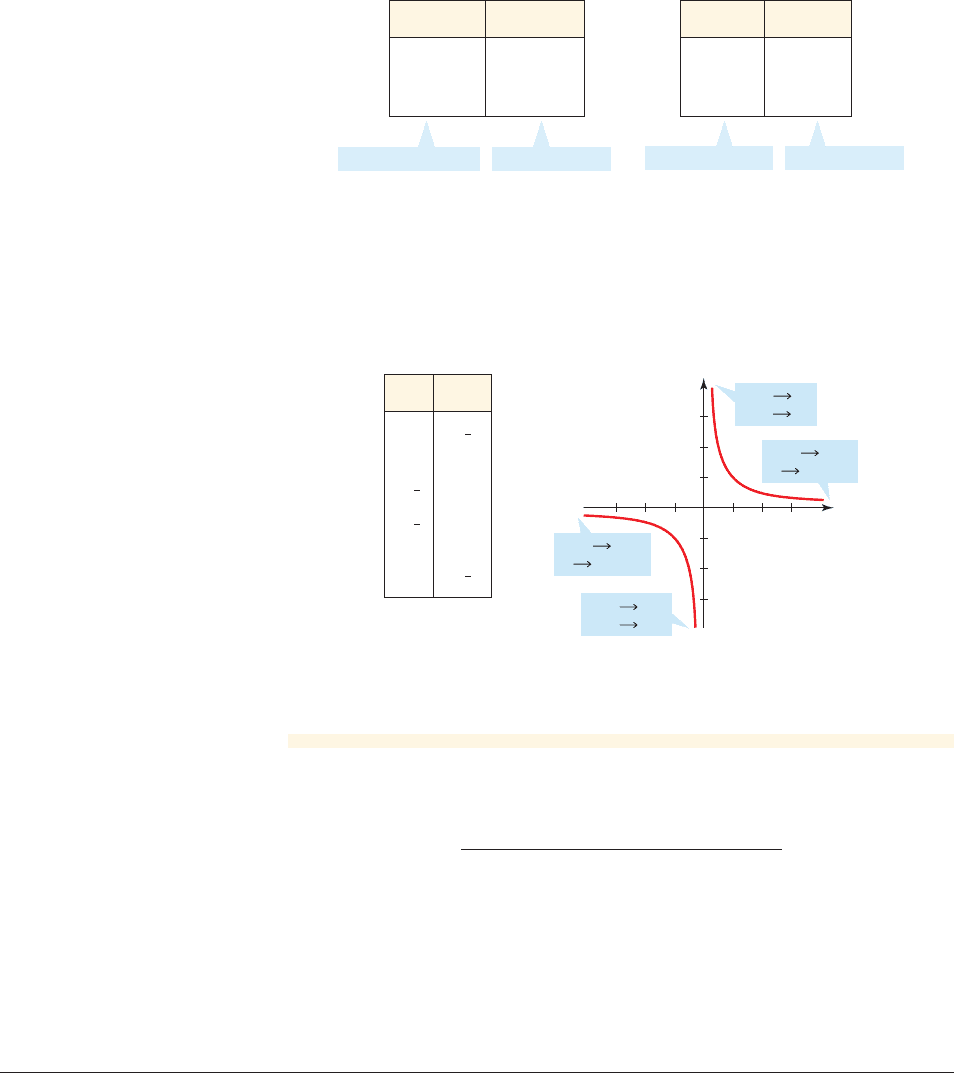
The first table shows that as x approaches zero from the left, the values of
become large in the negative direction. The second table shows that as x approaches
zero from the right, the values of x become large in the positive direction. We de-
scribe this behavior in symbols and in words as follows.
y approaches negative infinity as
x approaches zero from the left
y approaches infinity as
x approaches zero from the right
y Sq
asx S 0
+
y S - qasx S 0
-
y = f 1x2
y
x
f(x)
as x 0–
_`
f(x)
x
0 as
_`
f(x)
x
0 as
`
f(x)
as x
`
0±
2
2
0
figure 1 Graph of y = 1>x
528 CHAPTER 6
■
Power, Polynomial, and Rational Functions
The next two tables show how the values of change as x becomes large in
the positive or negative direction.
y = f 1x2
These tables show that as x becomes large, the values of get closer and
closer to zero. We describe this situation in symbols as follows:
Using the information in these tables and plotting a few additional points, we obtain
the graph shown in Figure 1.
y S 0asx S - qandy S 0asx Sq
y = f 1x2
x
f 1x 2
10 0.1
100 0.01
100,000 0.00001
x
f 1x 2
- 10 - 0.1
- 100 - 0.01
- 100,000 - 0.00001
Approaching
- q
Approaching 0
Approaching
q
Approaching 0
■ NOW TRY EXERCISES 5 AND 13 ■
In Example 1 we used the following arrow notation.
Symbol Meaning
x S a
-
x approaches a from the left
x S a
+
x approaches a from the right
The line is called a vertical asymptote of the graph in Figure 1, and the line
is called a horizontal asymptote. Informally, an asymptote of a function is
a line to which the graph of the function gets closer and closer as one travels along
the line.
y = 0
x = 0
2
■ Inverse Proportionality
A quantity Q is inversely proportional to a quantity R if it is proportional to the re-
ciprocal of R.
x
x
ⴚ1
- 2
-
1
2
- 1 - 1
-
1
2
- 2
1
2
2
1 1
2
1
2

SECTION 6.5
■
Power Functions: Negative Powers 529
If the quantities Q and R are related by the equation
for some nonzero constant k, we say that Q is inversely proportional to R.
The constant k is called the constant of proportionality.
Q =
k
R
So if y is inversely proportional to x, the equation says that y is proportional
to the reciprocal function.
y = k>x
Inverse Proportionality
example
2
Inverse Proportionality
Boyle’s Law states that when a sample of gas is compressed at a constant tempera-
ture, the pressure of the gas is inversely proportional to the volume of the gas.
(a) Write the equation that expresses this inverse proportionality.
(b) Suppose the pressure of a sample of air that occupies 0.106 cubic meters at
is 50 kilopascals.
(c) If the sample expands to a volume of 0.3 cubic meters, find the new pressure.
Solution
(a) Let P be the pressure of the sample of gas, and let be its volume. Then, by
the definition of inverse proportionality we have
where k is a constant.
(b) To find k, we use the fact that P is 50 when is 0.106.
Equation of proportionality
Replace P by 50 and by 0.106
Multiply by 0.106, and switch sides
Calculate
Putting this value of k into the proportionality equation, we have .
(c) We use the equation that we found, replacing by 0.3.
Equation of proportionality
Replace by 0.3
Calculator
So the new pressure is 17.7 kPa.
■ NOW TRY EXERCISES 25 AND 31 ■
P L 17.7
V P =
5.3
0.3
P =
5.3
V
V
P =
5.3
V
k = 5.3
k = 150210.106 2
V 50 =
k
0.106
P =
k
V
V
P =
k
V
V
25°C
530 CHAPTER 6
■
Power, Polynomial, and Rational Functions
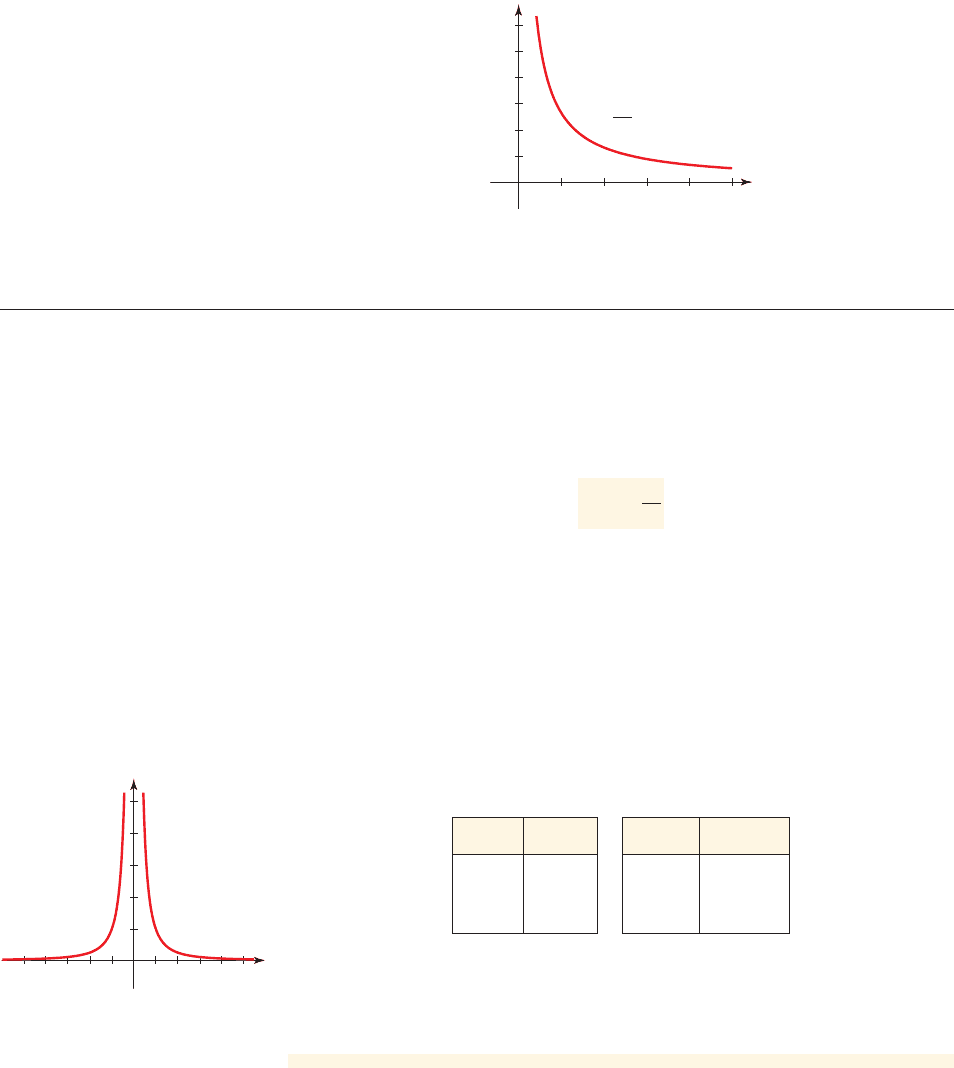
The equation from Example 2 shows that P is a constant multiple of
the reciprocal function, so the graph of P as a function of has the same shape as
the right half of Figure 1. (See Figure 2.)
V
P = 5.3>V
P
P=
V
V
2
1
5.3
0
figure 2 Graph of P = 5.3>V
2
■ Inverse Square Laws
Among the remaining negative powers for the power function , by far the
most important is when p is . In fact, some of the best-known scientific laws state
that one quantity is inversely proportional to the square of another quantity. In other
words, the first quantity is modeled by a function of the form
and we refer to an inverse square law. Before considering such a law, let’s see what
the graph of such a function looks like.
f 1x2=
k
x
2
- 2
f 1x2= Cx
p
example
3
Graphing an Inverse Square Function
Sketch a graph of the function , and compare it with the graph of the re-
ciprocal function.
Solution
We calculate values of , noting that .f 1- x2= f 1x2f 1x2
f 1x2= 1>x
2
x
x
ⴚ2
; 10
0.01
; 100
0.0001
; 1000
0.000001
x
x
ⴚ2
;1
1
;0.1
100
;0.01
10,000
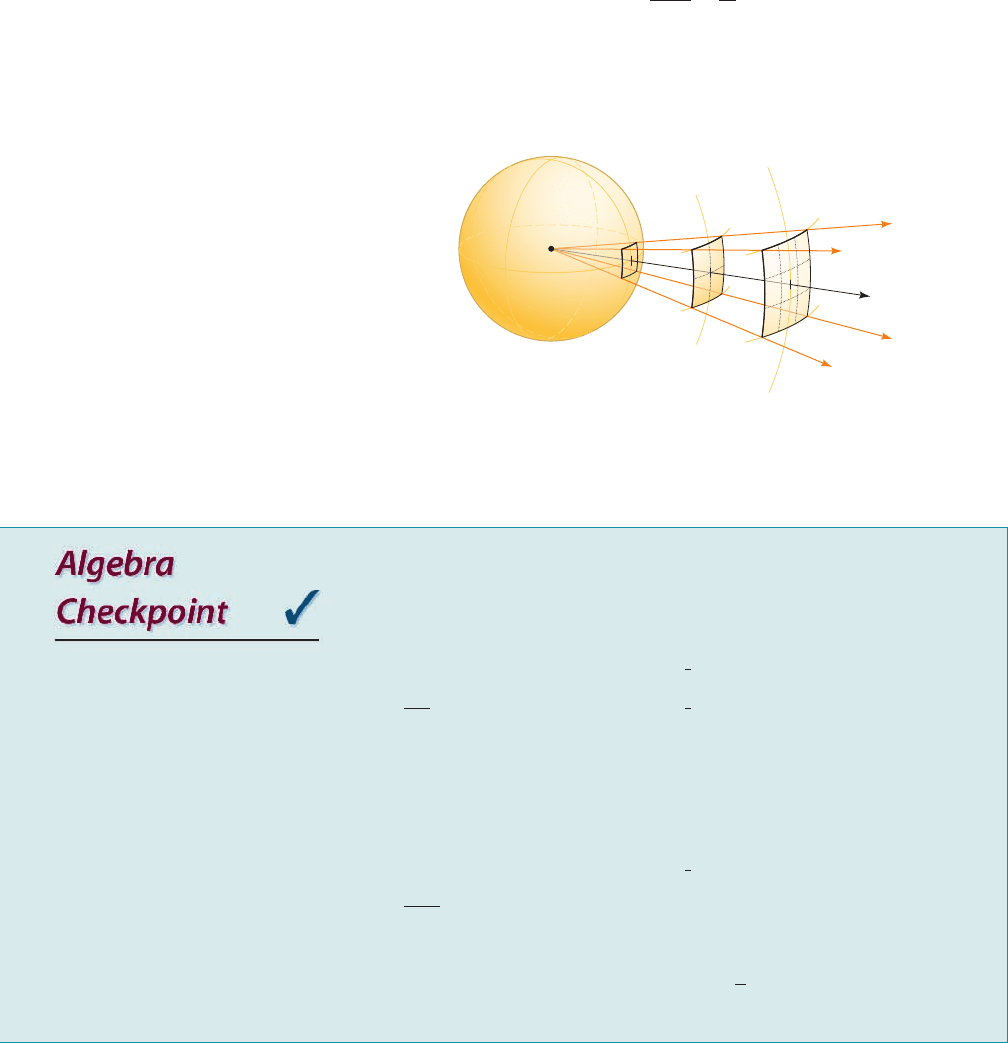
When we plot the graph of f in Figure 3, we notice that, as with , the x-axis
and y-axis are asymptotes. But faster than as . And because
, the graph of f is symmetric about the y-axis.
■ NOW TRY EXERCISES 7 AND 15 ■
f 1- x2= f 1x2
x S;q1>x1>x
2
S 0
y = 1>xx
1
y
1
figure 3 Graph of y = 1>x
2

SECTION 6.5
■
Power Functions: Negative Powers 531
Many physical quantities are connected by inverse square laws. In the next ex-
ample we use the fact that the illumination of an object by a light source is inversely
proportional to the square of the distance from the source. Other inverse square laws
model gravitational force (Exercise 36), loudness of sound (Exercise 33), and the
electrostatic force between two charged particles.
example
4
An Inverse Square Law
Suppose that after dark you are in a room with just one lamp and you are trying to
read a book. The light is too dim, so you move halfway to the lamp. How much
brighter is the light?
Solution
If I(x) is the illumination when your distance from the lamp is x, then I(x) is inversely
proportional to the square of x:
where k is a constant.
If you are at a distance d from the lamp, then the illumination is
Replace x by d
If you move halfway to the lamp, your new distance is , so the illumination is now
Replace x by d
Property of Exponents
Property of Fractions
Replace by I(d)
Thus, the light is now four times as bright.
■ NOW TRY EXERCISE 37 ■
There is a geometric reason that many of the laws of nature are inverse square
laws. Imagine a force or energy originating from a point source and spreading its
influence equally in all directions, just like the light shining from a light bulb in
Example 4 or the gravitational force exerted by a planet. The influence of the
force or energy at a distance r from the source is spread out over the surface of a
k>d
2
= 4I1d2
= 4 a
k
d
2
b
=
k
1
4
d
2
1
2
IA
1
2
dB=
k
A
1
2
dB
2
1
2
d
I1d 2=
k
d
2
I1x 2=
k
x
2
Rules of Exponents are
reviewed in Toolkits A.3 and
A.4, pages T14 and T20.
532 CHAPTER 6
■
Power, Polynomial, and Rational Functions
S
r = 2
r = 3
r = 1
figure 4 Energy from a point source S
Check your knowledge of rules of exponents by doing the following problems.
You can review these topics in
Algebra Toolkit A.3
and
A.4
on pages T14
and T20.
1. Evaluate each expression.
(a) (b)
(c) (d)
2. Simplify each expression, and eliminate any negative exponents.
(a) (b)
(c) (d)
3. Simplify each expression, and eliminate any negative exponents.
(a) (b)
(c) (d)
4. Solve the equation.
(a) (b)
(c) (d)
3x
-1>2
= 15x
-1>3
= 2
2x
-2
=
1
18
x
-1
= 5
a
5>2
a
-1>2
a
-1>2
a
3>2
A
1
8
B
-1>3
4
-3>2
1- b2
-2
1- b2
-3
12y
-2
2
3
x
3
x
-4
A
5
2
B
-2
5
4
5
-2
A
1
2
B
-1
2
-3
sphere of radius r, which has area (see Figure 4). So the intensity I at a
distance r from the source is equal to the source strength S divided by the area A
of the sphere:
where k is the constant . Thus point sources of light, sound, gravity, electro-
magnetic fields, and radiation must all obey inverse square laws, simply because of
the geometry of space.
S>14p 2
I =
S
4pr
2
=
k
r
2
A = 4pr
2
2. (a) If the quantities x and y are related by the equation , then we say that y is
_______ proportional to the _______ power of x and the constant of
proportionality is
_______.
(b) If y is inversely proportional to the third power of x and if the constant of
proportionality is 4, then x and y are related by the equation .
Think About It
3. Graph the function in the viewing rectangle by . Explain why
you get a blank screen.
4. Suppose that a skunk is perched at the top of a tall flag pole. Do you think that the
intensity of its smell is inversely proportional to the square of the distance from the
skunk? (Read the explanation of the geometry of inverse square laws on page 531.)
5–8
■ A power function f is given.
(a) Complete each table for the values of the function.
(b) Describe the behavior of the function near its vertical asymptote, based on Tables 1
and 2.
(c) Determine the behavior of the function near its horizontal asymptote, based on
Tables 3 and 4.
3- 1, 143- 1, 14y = x
-1
y =
ⵧ
#
1
x
ⵧ
y = 7>x
5
SECTION 6.5
■
Power Functions: Negative Powers 533
Fundamentals
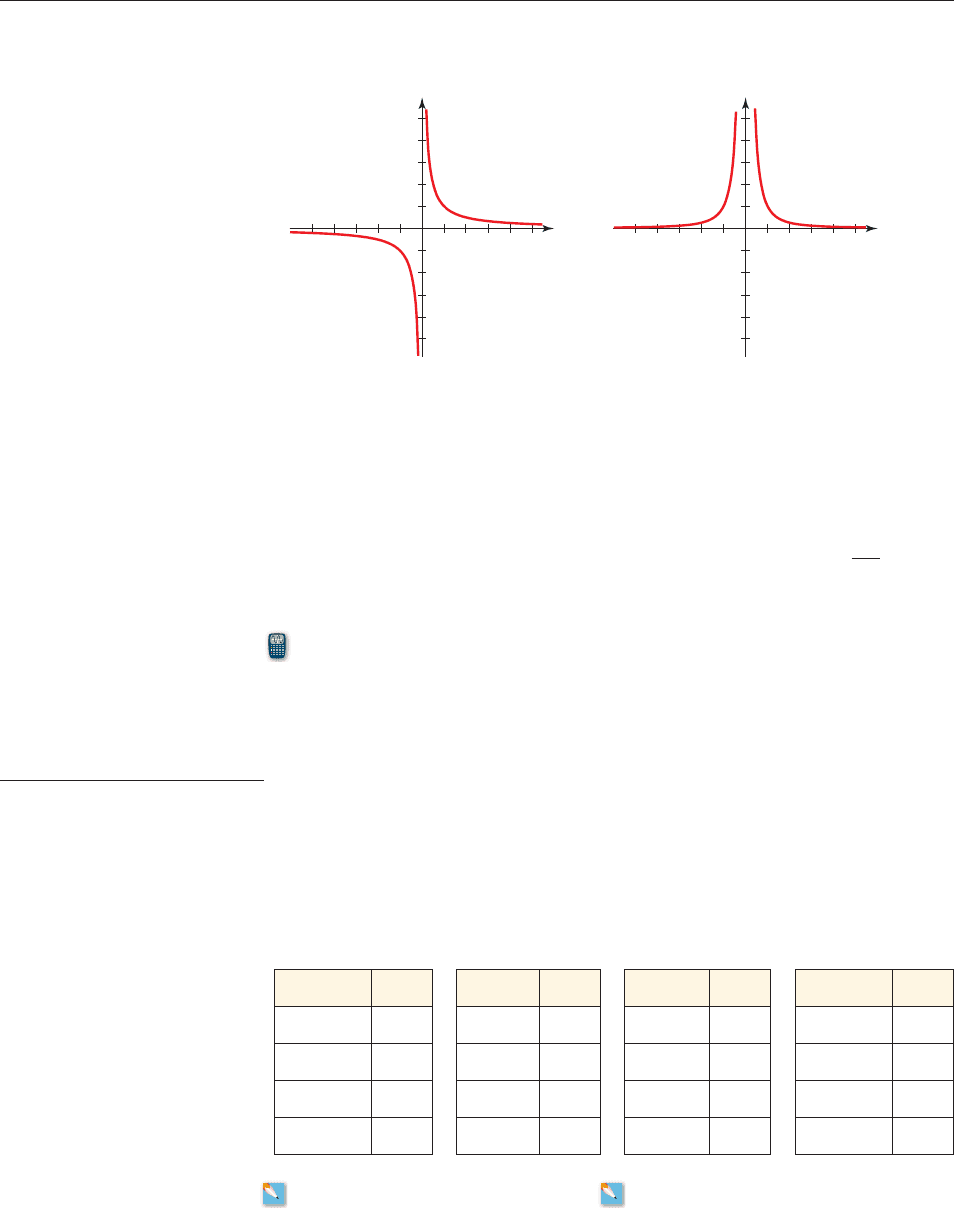
1. Graphs of and are shown. Identify each graph.y = x
-2
y = x
-1
6.5 Exercises
x
1
0
y
0
1
x
1
y
1
y ⫽ _______
y ⫽ _______
CONCEPTS
SKILLS
x
f 1x 2
- 0.1
- 0.01
- 0.001
- 0.00001
x
f 1x 2
- 10
- 50
- 100
- 100,000
x
f 1x 2
0.1
0.01
0.001
0.00001
x
f 1x 2
10
50
100
100,000
table 1 table 2 table 3 table 4
5. 6. 7. 8. f 1x 2= x
-6
f 1x 2= x
-4
f 1x 2= x
-5
f 1x 2= x
-3