Stewart J. College Algebra: Concepts and Contexts
Подождите немного. Документ загружается.


2
6.1 Working with Functions: Algebraic Operations
■
Adding and Subtracting Functions
■
Multiplying and Dividing Functions
IN THIS SECTION… we study how functions can be combined using algebraic
operations: addition, subtraction, multiplication, and division.
It would be fun to throw a ball up into the air and have it keep going up indefinitely.
That’s exactly what would happen if there were no gravity. In that case, if you threw
a ball up at a speed of 48 feet per second, it would continue traveling at this same
speed indefinitely, so it would reach a height of feet in t seconds. But be-
cause of gravity, the ball is pulled down a distance feet in t seconds. To
find out how high the ball would actually reach in the presence of gravity, we need
to subtract the distance gravity pulls down on the ball from the distance the ball trav-
els up under the force of the initial throw. So gives the height the ball
reaches at time t. The situation is as follows.
■
Throwing a ball pushes it up a distance feet in t seconds, and at the
same time gravity pulls it down a distance feet.
■
The height the ball actually reaches in t seconds is given by .
So the actual height the ball reaches at time t is modeled by a combination of the two
functions f and (see Example 3). In this section we will see several other real-world sit-
uations in which a model is found by combining functions using arithmetic operations.
g
f 1t2- g1t 2
g1t 2
f 1t2
f 1t2- g1t 2
g1t 2= 16t
2
f 1t2= 48t
484 CHAPTER 6
■
Power, Polynomial, and Rational Functions
2
■ Adding and Subtracting Functions
Two functions f and can be combined to form new functions and in a
manner similar to the way in which we add and subtract numbers. For example, we
define the function by
The new function is called the sum of the functions f and ; its value at x is
. Of course, the sum on the right-hand side makes sense only if both
and are defined, that is, if x belongs to the domain of f and also to the domain of
. So if the domain of f is A and the domain of is B, then the domain of is the
intersection of these domains, that is, . We define the difference of the
functions f and in a similar way, as described in the following box.
Sums and Differences of Functions
g
f - gA 傽 B
f + ggg
g1x 2
f 1x2f 1x2+ g1x 2
gf + g
1f + g21x 2= f 1x 2+ g1x 2
f + g
f - gf + gg
Let f and be functions with domains A and B respectively. We define new
functions as follows:
■
The sum of f and is the function defined by
■
The difference of f and is the function defined by
Each of these functions has the domain .A 傽 B
1f - g21x 2= f 1x 2- g1x 2
f - gg
1f + g21x 2= f 1x 2+ g1x 2
f + gg
g
Image copyright originalpunkt, 2009. Used under license from Shutterstock.com
SECTION 6.1
■
Working with Functions: Algebraic Operations 485
example
1
Adding and Subtracting Functions
Let and .
(a) Find the functions and and their domains.
(b) Find and .
(c) Sketch graphs of f, , , and .
Solution
(a) The functions f and have domain ⺢, so the domain of is also ⺢.
Definition of
Definitions of f and
Simplify
The domain of is also ⺢. We have
Definition of
Definitions of f and
Distributive Property, simplify
(b) Each of these values exists because is in the domain of both functions.
From part (a) we have
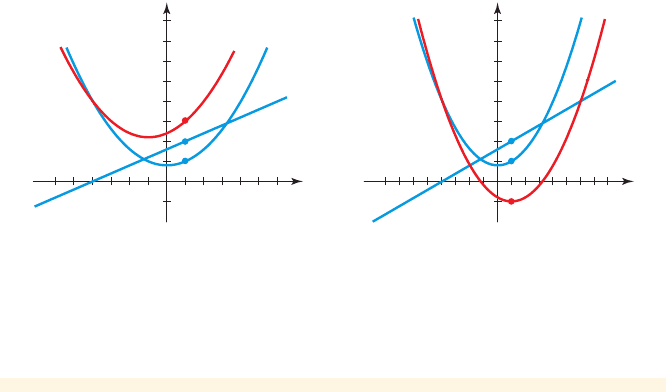
(c) The graphs are shown in Figure 1.
1f - g2112= 1
2
- 2
#
1 - 4 =-5
1f + g2112= 1
2
+ 2
#
1 + 12 = 15
x = 1
= x
2
- 2x - 4
g = 1x
2
+ 42- 12x + 82
f - g 1f - g21x2= f 1x2- g1x 2
f - g
= x
2
+ 2x + 12
g = 1x
2
+ 42+ 12x + 82
f + g 1f + g21x2= f 1x2+ g1x 2
f + gg
f - gf + gg
1f - g211 21f + g211 2
f - gf + g
g1x 2= 2x + 8f 1x 2= x
2
+ 4
1
x
y
10
0
(a) Graph of f+g
f+g
f
g
(b) Graph of f-g
3
x
y
10
0
f-g
f
g
figure 1
■ NOW TRY EXERCISES 13 AND 15 ■
In general, the graph of the function can be obtained from the graphs of f
and by graphical addition. This means that we add corresponding y-coordinates,
as illustrated in the next example.
g
f + g
486 CHAPTER 6
■
Power, Polynomial, and Rational Functions
■ NOW TRY EXERCISE 21 ■
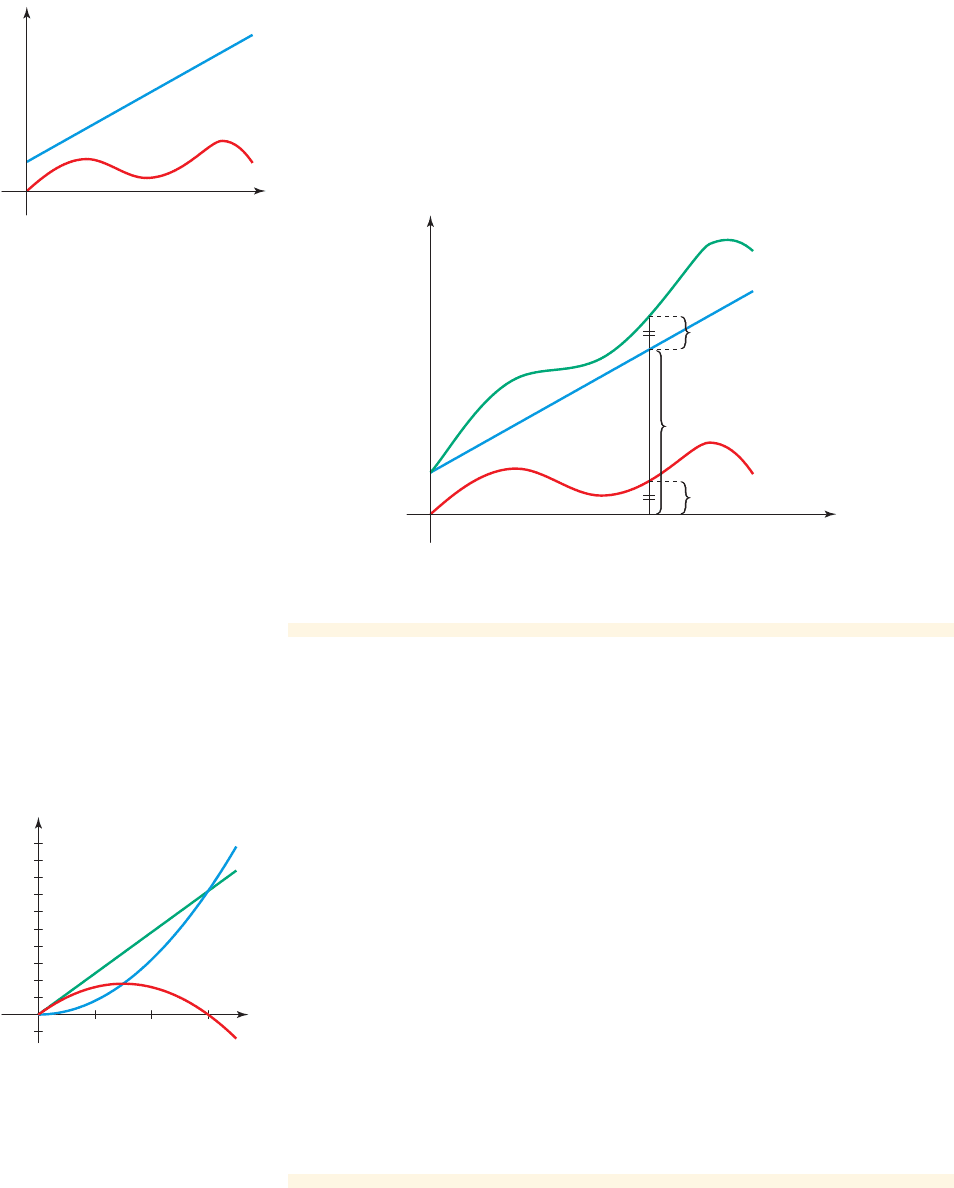
y
x
y=˝
y=Ï
figure 2
example
3
Graphical Subtraction
A ball is thrown straight up with a velocity of 48 feet per second. In the absence of
gravity the ball reaches a height in t seconds. Gravity pulls the ball down
feet in t seconds.
(a) Find a function h that models the height of the ball t seconds after it is thrown.
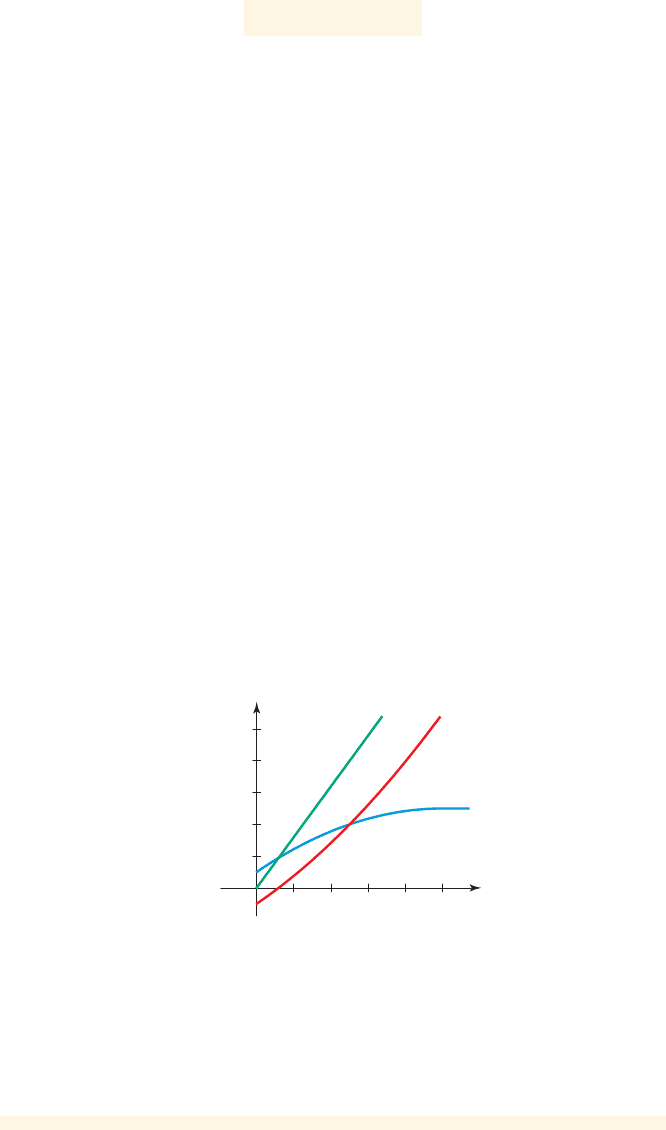
(b) Sketch a graph of the functions f, , and h. On what interval is the model h
valid?
Solution
(a) The function we want is
Ball moves up and down
Definitions of f and
(b) The functions f, , and h are graphed in Figure 4. The ball is at ground level
when . From the graph we see that at times 0 and 3 seconds.
The model is valid on the interval ; for numbers outside this interval we
see from the graph that the ball would be below ground level.
■ NOW TRY EXERCISE 23 ■
30, 34
h1t 2= 0h1t 2= 0
g
g = 48t - 16t
2
g1t 2f 1t 2 h1t 2= f 1t 2- g1t 2
g
g1t 2= 16t
2
f 1t2= 48t
P
f(x)
g(x)
y=(f+g)(x)
y=˝
y=Ï
f(x)
S
R
Q
y
x
figure 3 Graphical addition of f and g
1
0
40
80
120
160
200
23
h
g
f
y
t
figure 4 Graphs of f, , and hg
example
2
Graphical Addition
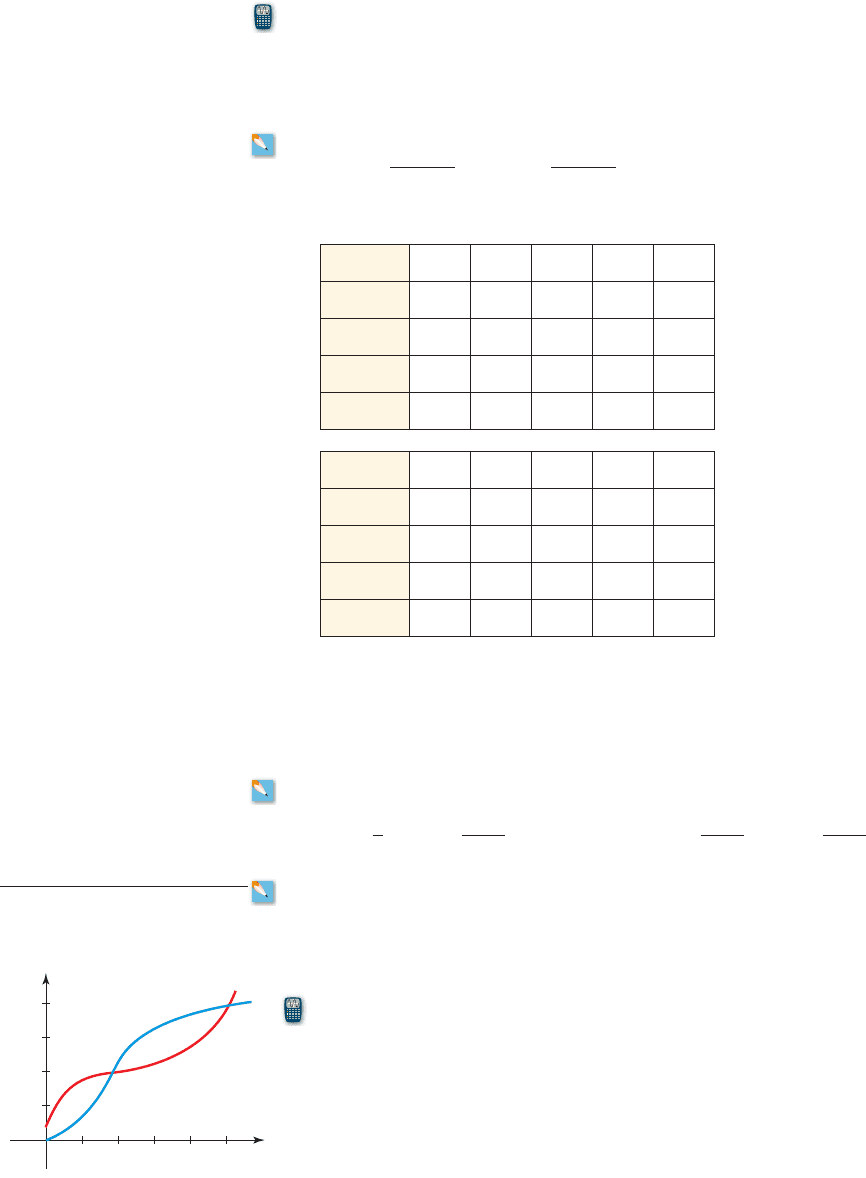
The graphs of f and are shown in Figure 2. Use graphical addition to graph the func-
tion .
Solution
We obtain the graph of by “graphically adding” the values of and
as shown in Figure 3. This is implemented by copying the line segment PQ on top
of PR to obtain the point S on the graph of .f + g
g1x 2f 1x2f + g
f + g
g
SECTION 6.1
■
Working with Functions: Algebraic Operations 487
Combining functions occurs in many business models. For example, if the rev-
enue a company receives as a result of selling x units of their product is given by
and the cost of producing these x units is , then the profit is the difference
of these two functions.
The next example illustrates the process.
P1x 2= R1x2- C1x 2
P1x 2C1x 2
R1x 2
example
4
Finding Profit
A doughnut shop sells bear claws for 80 cents each, so the revenue from selling x
bear claws is dollars. The cost of producing x bear claws is modeled
by . These models are valid for x in the interval
.
(a) Find a function P that models the profit when x bear claws are produced and
sold.
(b) Sketch graphs of the functions R, C, and P. How many bear claws must be
sold before revenue exceeds cost?
Solution
(a) The profit function is the difference between the revenue and cost functions.
Definition of profit
Definitions of R and C
Distributive Property
Simplify
(b) Since the models are valid in the interval , we sketch graphs of R, C,
and P on that interval (see Figure 5).
30, 10004
=-50 + 0.40x + 0.0002x
2
= 0.80x - 50 - 0.40x + 0.0002x
2
= 0.80x - 150 + 0.40x - 0.0002x
2
2
P1x 2= R1x 2- C1x2
30, 10004
C1x 2= 50 + 0.40x - 0.0002x
2
R1x 2= 0.80x
The cost function C includes $50 of
fixed costs and $0.40 per unit
produced. The term
reflects the reduction in cost per
item when large quantities are
produced.
- 0.0002x
2
200
0
400 600 800 1000
100
200
300
400
500
C
P
R
y
x
figure 5 Graphs of R, C, and P
We see from the graph that revenue exceeds cost when x is greater than about
120. So about 120 bear claws must be produced and sold before a profit is
made. (Note from the graph that the values of P are positive when x is greater
than 120.)
■ NOW TRY EXERCISE 35 ■

488 CHAPTER 6
■
Power, Polynomial, and Rational Functions
example
5
Products and Quotients of Functions
Let and .
(a) Find the functions and and their domains.
(b) Find and .
Solution
(a) The domain of f is all real numbers, and the domain of is , so their
intersection is . We have
Definition of
Definitions of f and
The domain of is . Also,
Definition of
Definitions of f and
The domain of is . Note that in the domain of we exclude 0
because is 0.
(b) We can calculate each of these values because 4 is in the domain of each
function. Using the results of part (a), we have
■ NOW TRY EXERCISE 31 ■
a
f
g
b142=
4 + 1
14
=
5
2
1fg2142= 14 + 1214 = 10
g10 2
f>g5x 0 x 7 06f>g
g =
x + 1
1x
fg a
f
g
b1x2=
f 1x2
g1x 2
5x 0 x Ú 06fg
g = 1x + 121x
fg 1fg21x2= f 1x 2
#
g1x 2
5x 0 x Ú 06
5x 0 x Ú 06g
1f>g21421f g214 2
f>gfg
g1x 2= 1xf 1x 2= x + 1
Let f and be functions with domains A and B. We define new functions as
follows:
■
The product of f and is the function defined by
The domain of is .
■
The quotient of f and is the function defined by
The domain of is ; that is, we must remove the
values of x where the denominator is 0.g1x2
5x H A 傽 B
0 g1x2⫽ 06f>g
a
f
g
b1x2=
f 1x2
g1x 2
f>gg
A 傽 Bfg
1f g21x2= f 1x2
#
g1x2
fgg
g
2
■ Multiplying and Dividing Functions
The functions f and can be combined to form new functions and in a man-
ner similar to the way in which we defined the sum and difference of two functions.
Products and Quotients of Functions
f>gf
#
gg
SECTION 6.1
■
Working with Functions: Algebraic Operations 489
example
6
Products of Functions
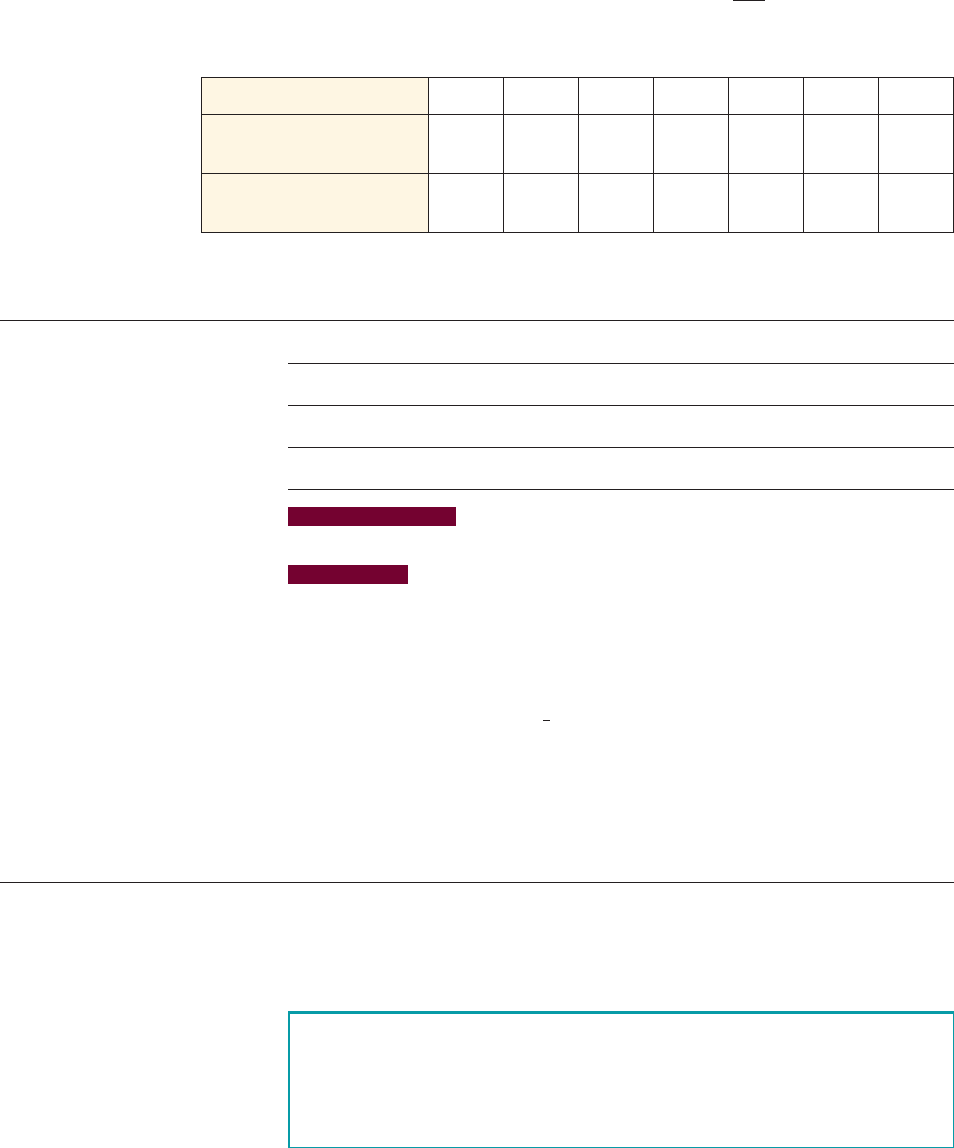
An employee invests part of his monthly paycheck in his company’s stock. The table
gives the price (in dollars) of the stock on the purchase day and the number
of shares the employee buys.
(a) What is the meaning of the product function ?
(b) Calculate the values of for the indicated months. What do you conclude?R1t 2
R1t 2= N1t2P1t2
N1t 2P1t 2
Month t 1 2 3 4 5 6 7 8 9 10 11 12
Price P(t) 18 18 20 21 23 23 23 22 20 18 15 15
Number N(t) 10 10 12 12 12 12 12 15 20 25 30 30
Month t 1 2 3 4 5 6 7 8 9 10 11 12
R(t) 180 180 240 252 276 276 276 330 400 450 450 450
It appears that this employee is investing more money every month in his com-
pany’s stock.
■ NOW TRY EXERCISE 39 ■
6.1 Exercises
CONCEPTS
Fundamentals
1. Let f and be functions defined for all real numbers.
(a) By definition,
_______ and _______.
So if and , then
_______ and
_______.
(b) By definition,
_______ and _______. So if
and , then
_______ and _______.
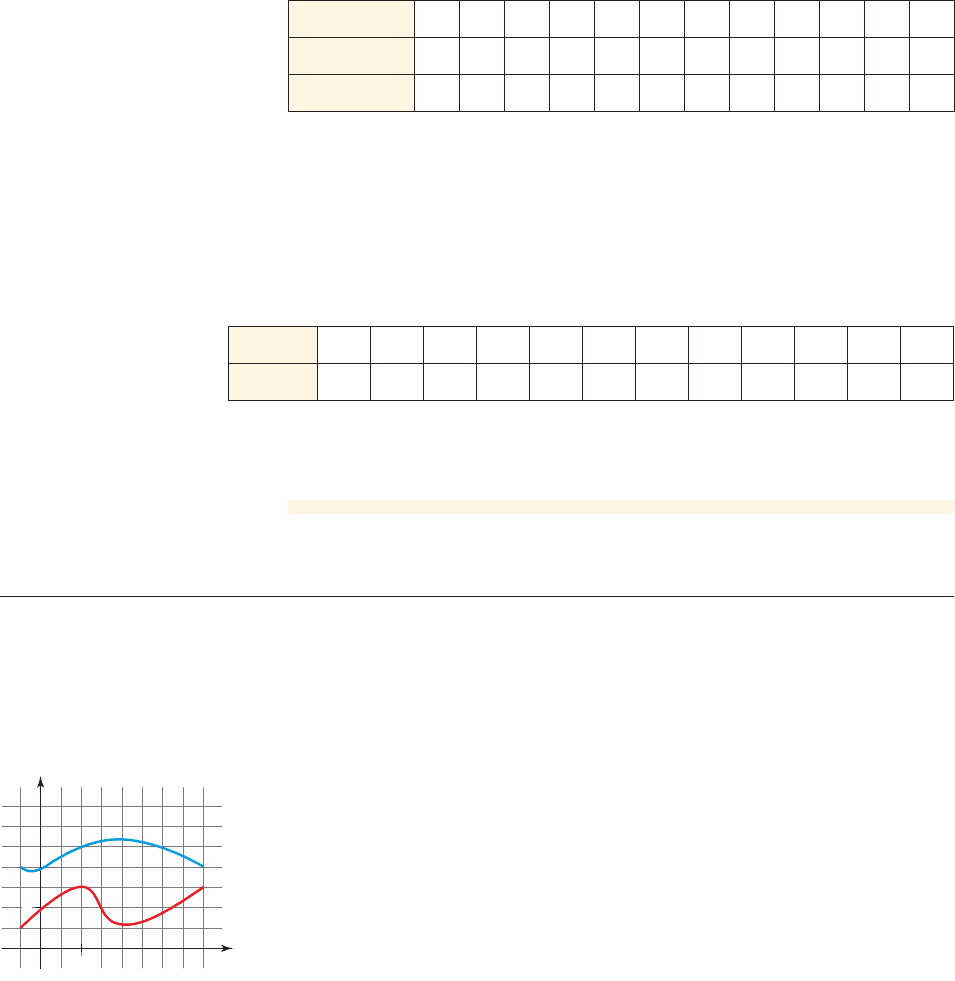
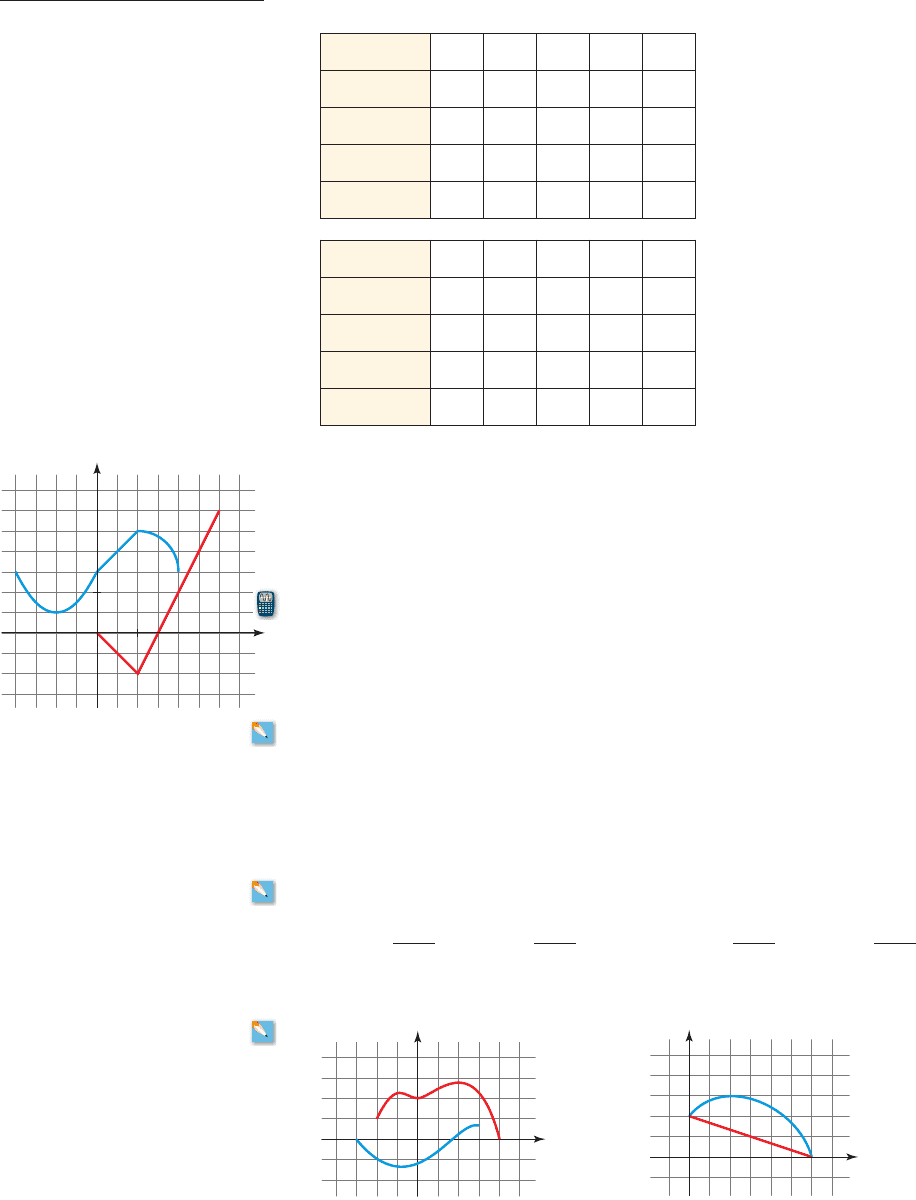
2. Use the graphs of f and in the figure in the margin to find the following.
_______ _______
_______ _______
Think About It
3–4 ■ True or false?
3. If for all x, then the graph of is above the graph of for all x.
4. If for all x, then the graph of is below the graph of for all x.gfgf 1x 26 0
gf + gf 1x 27 0
1f>g2122=1f g212 2=
1f - g2122=1f + g212 2=
g
1f>g211 2=1f g211 2=g112= 6
f 11 2= 31f>g21x 2=1f
g21x2=
1f - g213 2=
1f + g213 2=g13 2= 7f 132= 5
1f - g21x 2=1f + g21x 2=
g
y
x
0
g
f
2
2
Solution
(a) The function R(t) gives the amount the employee invests in his company’s
stock each month.
(b) The value of R(t) at any t is the product of P(t) and N(t). Therefore
. The other entries in the table below are
calculated similarly.
18
#
10 = 180R11 2= N112P112=
t 0 1 2 3 4
f 1t 2
30 24 22 17 13
g1t 2
294 312 331 352 370
1f ⴙ g 21t2
1f ⴚ g 21t2
490 CHAPTER 6
■
Power, Polynomial, and Rational Functions
5–6
■ Functions f and are given in the table. Complete the table to find and .
5.
f - gf + gg
SKILLS
t 0 1 2 3 4
f 1t 2
131 282 291 332 504
g1t 2
459 376 367 274 209
1f ⴙ g 21t2
1f ⴚ g 21t2
6.
7–12
■ Use the graphs of f and shown in the margin to evaluate the expression.
7. 8.
9. 10.
11. 12.
13–14
■ The functions f and are given.
(a) Find the function . Draw graphs of f, , and in the same viewing
rectangle.
(b) Find the function . Draw graphs of f, , and in the same viewing
rectangle.
13.
14.
15–20
■ The functions f and are given.
(a) Find the functions and and their domains.
(b) Evaluate the functions and at the indicated value of x, if defined.
15. ,;116. ,;
17. ,;218. ,;1
19. ,;320. ,;5
21–22
■ Use graphical addition to sketch the graph of .
21. 22.
f + g
g1x 2= 21 + x
f 1x 2= 24 - xg1x 2= 23 + xf 1x2= 27 + x
g1x 2= 3x
2
- 1f 1x 2= x
2
+ 2xg1x2= 2 - 7x
2
f 1x 2= x
2
- 5x
- 1g1x 2= x + 2f 1x2= 0.5x
2
g1x 2= x - 3f 1x2= x
2
f - gf + g
f - gf + g
g
f 1x 2= 3x
2
+ 5,g1x2= 4x + 7
f 1x 2= 2x
2
+ 1,g1x2= 3x + 2
f - ggf - g
f + ggf + g
g
1f g21421f>g2102
1g>f 210 21fg2112
1f - g210 21f + g212 2
g
x
0
f
g
y
x
y
0
f
g
x
y
0
f
g
2
2
t 0 1 2 3 4
f 1t 2
- 3 - 0.5
3 5 6
g 1t 2
2 6 7
- 5 - 2
1f g 21t2
1f>g 21t 2
t 0 1 2 3 4
f 1t 2
- 1
9 0 5
- 2
g 1t 2
- 21 - 25 - 11
0 1
1f g 21t2
1f>g 21t 2
SECTION 6.1
■
Working with Functions: Algebraic Operations 491
23–26 ■ The functions f and are given.
(a) Draw the graphs of f, , and on a common screen to illustrate graphical
addition.
(b) Draw the graphs of f, , and on a common screen to illustrate graphical
subtraction.
23. , 24. ,
25. , 26. ,
27–28
■ Functions f and are given in the table. Use the table to find and , if defined.
27.
f>gfgg
g1x 2= 0.5xf 1x2= x
2
g1x 2= 11 - 0.5xf 1x 2= 11 + 0.5x
g1x 2= x
2
f 1x 2= x
4
g1x 2= xf 1x 2= x
2
f - gg
f + gg
g
28.
y
0
x
y=C(x)
y=R(x)
100
2000
CONTEXTS
29–34 ■ The functions f and are given.
(a) Find the functions and and their domains.
(b) Evaluate the functions and at the indicated value, if defined.
29. ,;230. ,;
31. ,;032. ,;
33. ,;434. ,;0
35. Revenue, Cost, and Profit A store sells a certain type of digital camera. The revenue
from selling x cameras is modeled by . The cost of producing x
cameras is modeled by . These models are valid for x in
the interval .
(a) Find a function that models the profit from producing and selling x cameras.
(b) Sketch a graph of the revenue, cost and profit functions. How many cameras must
be sold in one week before revenue exceeds cost.
36. Revenue, Cost, and Profit The figure in the margin shows graphs of the cost and
revenue functions reported by a manufacturer of tires.
(a) Identify on the graph the value of x for which the profit is 0.
(b) Use graphical addition to sketch a graph of the profit function.
30, 4504
C1x 2= 9300 + 150x - 0.1x
2
R1x 2= 450x - 0.5x
2
g1x 2=
x
x + 1
f 1x 2=
2
x + 1
g1x 2=
4
x + 4
f 1x 2=
2
x
- 2g1x 2= 4x + 8f 1x 2= 3x
2
g1x 2= x
2
f 1x 2= x - 3
- 1g1x2= 5x + 10f 1x2= 2x - 1g1x 2= x + 5f 1x 2= 3x + 4
f>gfg
f>gfg
g

492 CHAPTER 6
■
Power, Polynomial, and Rational Functions
37–38
■ Revenue, Cost, and Profit A print shop makes bumper stickers for election
campaigns. If x stickers are ordered (where ), then the price per sticker
is dollars, and the total cost of producing the order is
dollars.
37. Use the fact that to express R(x), the
revenue from an order of x stickers, as a product of two functions of x.
38. Use the fact that to express P(x), the profit on an order of
x stickers, as a difference of two functions of x.
39. Home Sales Let be the number of existing homes sold in the United States in
month t of 2007, and let be the same function as f but for 2008. The table gives the
values of f and .
(a) What is the meaning of the function ?
(b) What is the meaning of the function ?
(c) Calculate the values of for each month. What do you conclude?R1t 2
R1t 2=
h1t 2
f 1t 2
h1t 2= 1f - g21t2
g
g
f 1t 2
profit = revenue - cost
revenue = price per item * number of items sold
0.095x - 0.0000005x
2
0.15 - 0.000002x
x 6 10,000
41. Smoking in the United States The table below shows estimated numbers of
smokers as well as the total population of the United States from 1970 to 2007.
(a) What is the meaning of the quotient function ?
(b) Calculate the values of for the indicated years. What do you conclude?R1t 2
R1t 2=
S1t 2
P1t 2
Month t 1 2 3 4 5 6 7 8 9 10 11 12
2007 sales: f(t)
(thousands)
532 550 509 494 494 479 480 458 426 422 418 409
2008 sales: g(t)
(thousands)
408 419 412 408 416 404 418 409 428 409 370 396
40. Labor Force The following table shows the number of workers in the U.S. labor
force and the number of employed workers for each year from 2001 to 2008, as
reported by the Bureau of Labor Statistics from the Current Population Survey.
(a) What is the meaning of the function ?
(b) What is the meaning of the quotient functions and ?
(c) Calculate the values of and for the indicated years. What do you
conclude?
R
2
1t 2R
1
1t 2
R
2
1t 2=
U1t 2
L1t 2
R
1
1t 2=
E1t 2
L1t 2
U1t 2= L1t 2- E1t2
E1t 2
L1t 2
t 2001 2002 2003 2004 2005 2006 2007 2008
Labor force L(t)
(thousands)
143,734 144,863 146,510 147,401 149,320 151,428 153,124 154,287
Employed E(t)
(thousands)
136,933 136,485 137,736 139,252 141,730 144,427 146,047 145,362
t 1970 1980 1990 2000 2007
Smokers S(t) (thousands) 76,035 75,212 63,421 65,571 62,737
Population P(t) (thousands) 203,302 226,542 248,710 281,422 301,621
SECTION 6.2
■
Power Functions: Positive Powers 493
42. Crude Oil Imports The table shows the annual consumption as well as the annual
imports of crude oil and petroleum products from 2002 to 2008, as reported by the
Energy Information Administration of the U.S. Department of Energy.
(a) What is the meaning of the quotient function ?
(b) Calculate the values of for the indicated years. What do you conclude? R1t 2
R1t 2=
I1t 2
C1t 2
t 2002 2003 2004 2005 2006 2007 2008
Barrels imported per day
I(t) (thousands)
10,546 11,238 12,097 12,549 12,390 12,036 11,113
Barrels consumed per day
C(t) (thousands)
19,761 20,034 20,731 20,802 20,687 20,680 19,498
2
6.2 Power Functions: Positive Powers
■
Power Functions with Positive Integer Powers
■
Direct Proportionality
■
Fractional Positive Powers
■
Modeling with Power Functions
IN THIS SECTION… we study power functions with positive powers, and their graphs. We
compare them with exponential functions and see how they arise in geometry and science.
GET READY… by reviewing the rules of exponents in Algebra Toolkits A.3 and A.4,
and solving power equations in Algebra Toolkit C.1. Test your understanding by doing
the Algebra Checkpoint at the end of this section.
Some of the most familiar examples of functions are power functions. In geometry the
formulas for the area of a square or a circle and the volume of a
cube or a sphere all involve power functions. In physics, power
functions arise in Galileo’s formula for the distance traveled by a falling
object and in Kepler’s Third Law for the period of revolution of a planet
around the sun. (See Exercise 16, Section 6.4.). We will also see that power functions
occur in biology, where they help us to determine the number of species that a habi-
tat can support or how fast an animal walks naturally.
1T = Cd
3>2
2
1d = 16t
2
2
1V =
4
3
pr
3
21V = x
3
2
1A = pr
2
21A = x
2
2
2
■ Power Functions with Positive Integer Powers
A power function is a function of the form
where the constant C and the power p are any nonzero numbers.
f 1x2= Cx
p
A power function is one in which the variable is raised to a fixed power.
Power Functions