Stewart J. College Algebra: Concepts and Contexts
Подождите немного. Документ загружается.

t
h
0
(a) Graph of h
h
aa
a+10
t
h
0
(b) Graph of H
h
H
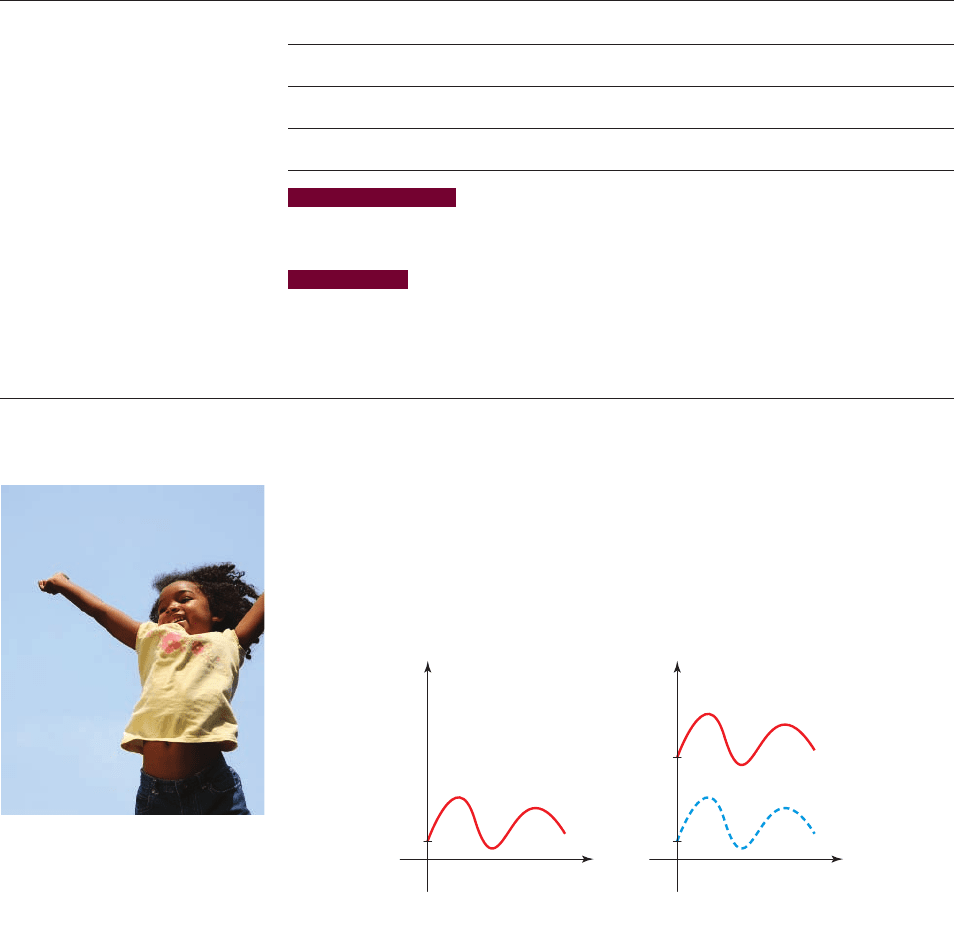
figure 1 Height above the ground
2
5.1 Working with Functions: Shifting and Stretching
■
Shifting Graphs Up and Down
■
Shifting Graphs Left and Right
■
Stretching and Shrinking Graphs Vertically
■
Reflecting Graphs
IN THIS SECTION… we learn how certain transformations of a function affect its graph.
The transformations that we study are shifting, reflecting, and stretching; these are used in
the next section to help us graph quadratic functions.
GET READY… by reviewing function notation in Section 1.5.
2
■ Shifting Graphs Up and Down
The function h graphed in Figure 1(a) gives the height at time t of the feet of a child
jumping on a trampoline, where a is the height of the trampoline. If the trampoline
is set on a 10-foot-high platform, the corresponding function H is graphed in
Figure 1(b). How are the functions h and H related graphically? How are they re-
lated algebraically?
414 CHAPTER 5
■
Quadratic Functions and Models
We can see that the graph of H is the same as the graph of h but shifted 10 units
upward. Algebraically, H is obtained from h by adding 10 to the output values:
.
The above example shows that adding a constant to a function shifts its graph
vertically. In general, we have the following.
H1t 2= h1t 2+ 10
Sonya Etchison/Shutterstock.com 2009
SECTION 5.1
■
Working with Functions: Shifting and Stretching 415
example
1
Vertical Shifts of Graphs
Use the graph of to sketch the graph of each function.
(a) (b)
Solution
The function was graphed in Example 3 in Section 1.6. It is sketched again
in Figure 2.
(a) Observe that
So the y-coordinate of each point on the graph of g is 3 units above the
y-coordinate of the corresponding point on the graph of f. This means that to
graph g, we shift the graph of f upward 3 units, as in Figure 2.
(b) Similarly, , so to graph h, we shift the graph of f downward 2
units, as shown in Figure 2.
■ NOW TRY EXERCISE 7 ■
h1x 2= f 1x 2- 2
g1x 2= x
2
+ 3 = f 1x2+ 3
f 1x2= x
2
h1x 2= x
2
- 2g1x 2= x
2
+ 3
f 1x2= x
2
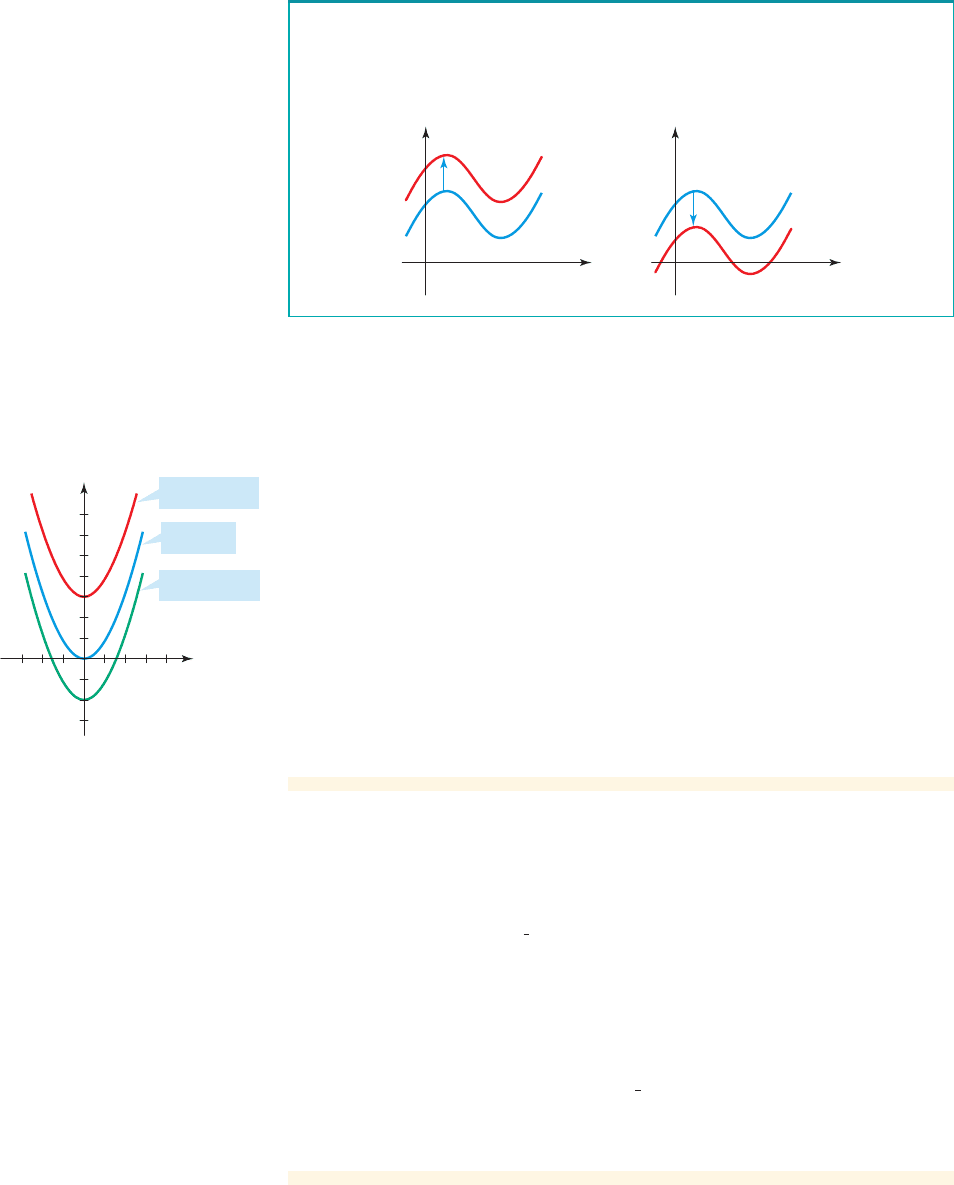
Suppose .
To graph , shift the graph of upward c units.
To graph , shift the graph of downward c units.y = f 1x 2y = f 1x2- c
y = f 1x2y = f 1x 2+ c
c 7 0
Recall that the graph of the function
f is the same as the graph of the
equation .y = f 1x 2
x
y
y
x
c
0
c
0
y=f(x)+c
y=f(x)-c
y=f(x)
y=f(x)
Vertical Shifts of Graphs
x
y
0
2
2
g(x) = x
f(x) = x
2
h(x) = x
2
– 2
2
+ 3
figure 2 Graphs of
and h1x 2= x
2
- 2g1x2= x
2
+ 3
example
2
Combining Speeds
A train is traveling at 1320 feet per minute. A man inside the train is walking in the
same direction as that in which the train is moving. The man’s speed at time t rela-
tive to the train is feet per minute. Find a function that gives the man’s
speed relative to the ground. How are the graphs of and related?
Solution
Since the man and the train are moving in the same direction, we add the train’s
speed to his speed. So the man’s speed relative to the ground is
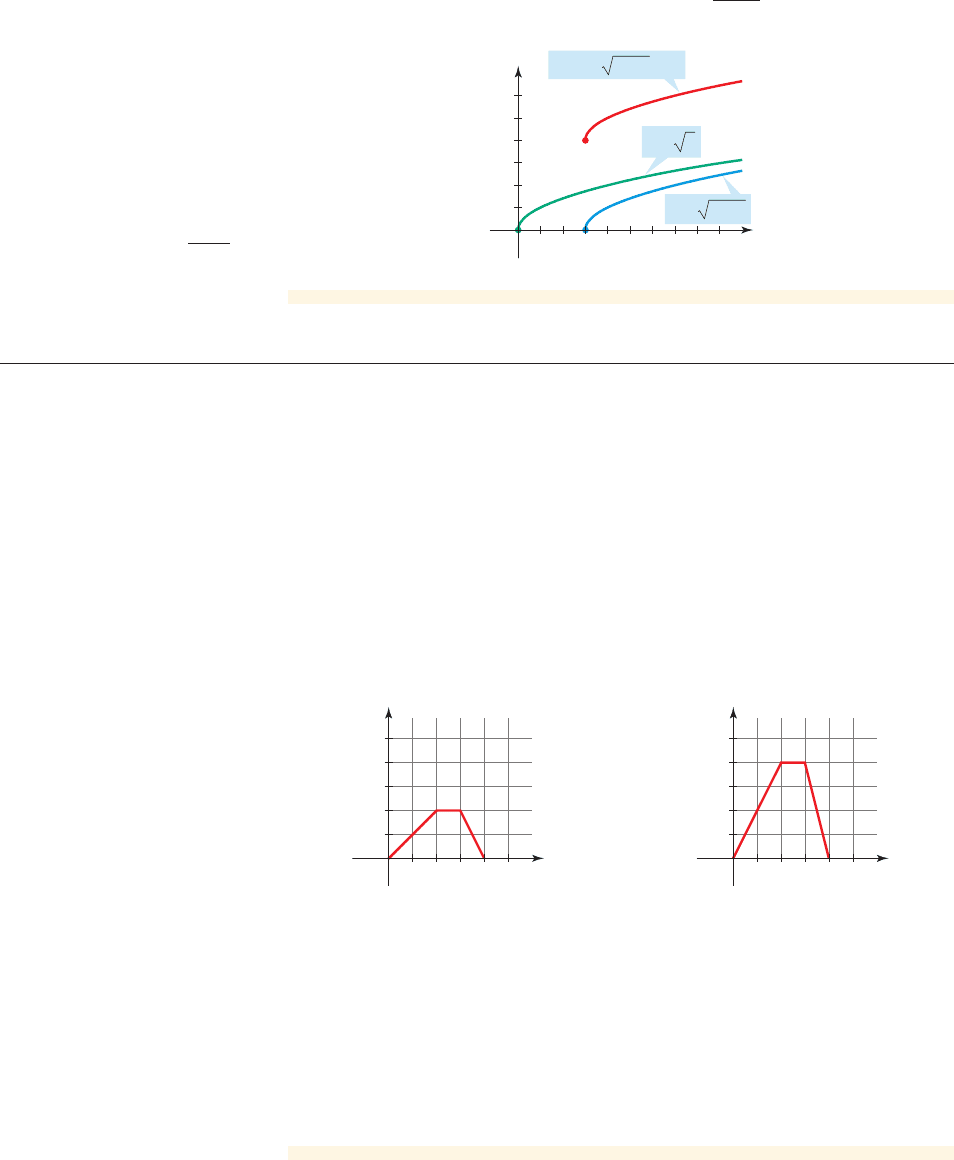
The graph of is obtained from the graph of √ by shifting up 1320 units.
■ NOW TRY EXERCISE 65 ■
V
V1t 2= 101t + 1320
V√
V√1t2= 10 1t
416 CHAPTER 5
■
Quadratic Functions and Models
2
■ Shifting Graphs Left and Right
Suppose that Madeleine leaves home for work early in the morning. Her roommate
Jennifer leaves an hour later. To find out where each of them is at any given time, we
need to model each roommate’s distance from home using a common starting time.
We’ll do this in the next example.
example
3
Changing the Starting Time
Jennifer leaves home an hour after Madeleine and drives at a constant speed of 60
miles per hour on a straight road.
(a) Find a function j that models Jennifer’s distance from home t hours after she
started her trip.
(b) Find a function J that models Jennifer’s distance from home t hours after
Madeleine started her trip.
(c) Graph the functions j and J. How are the graphs related?
Solution
(a) Since Jennifer drives at 60 miles per hour, her distance t hours after she started
her trip is .
(b) If we take time 0 to be the time when Madeleine started her trip, then Jennifer
should just be starting her trip when t is 1 hour. In other words, in terms of this
new starting time, Jennifer’s distance at time t is given by
(for ).
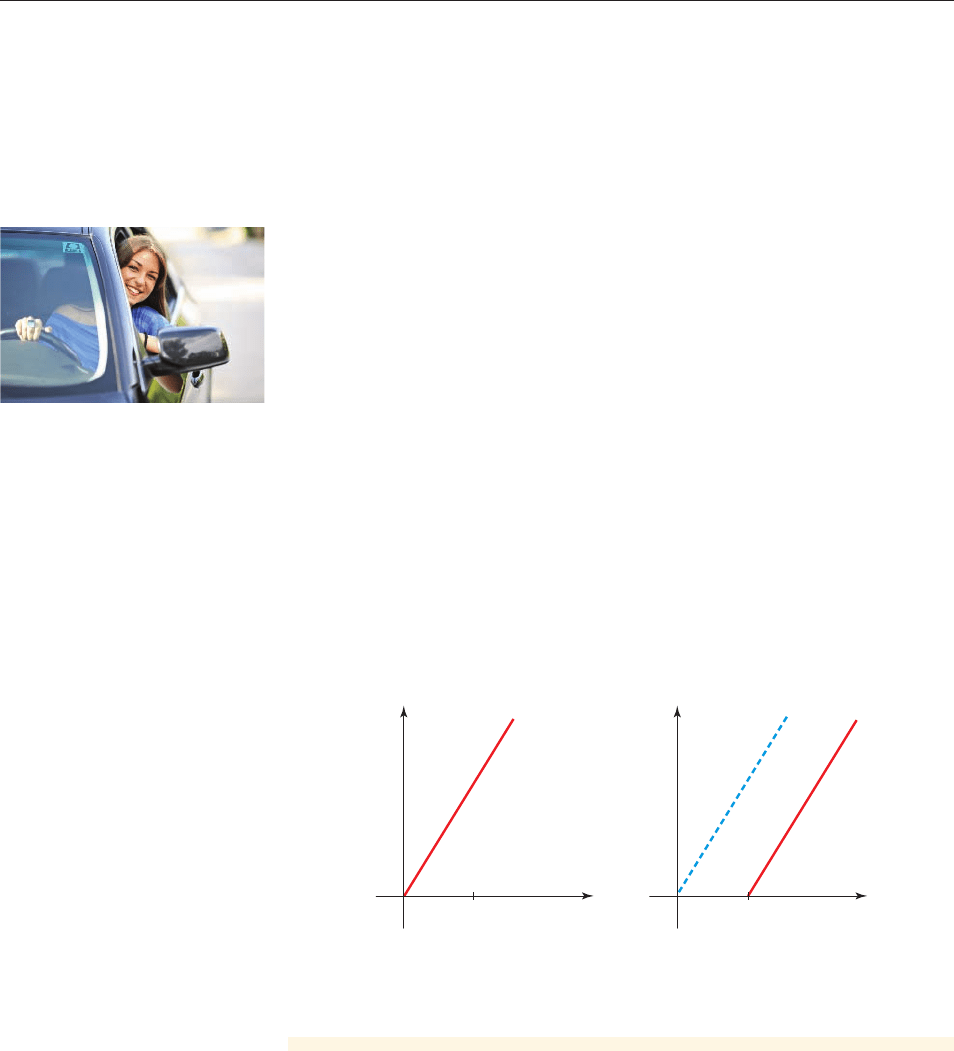
(c) Graphs of these functions are shown in Figure 3. We see that the graph of J is
the same as the graph of j but shifted one unit to the right.
t Ú 1
J1t 2= 601t - 1 2
j1t 2= 60t
t
y
0
11
(a) Graph of j(t)=60t
jjJ
t
y
0
(b) Graph of J(t)=60(t-1)
figure 3 Distance traveled
Kristian Sekulic/Shutterstock.com 2009
■ NOW TRY EXERCISE 67 ■
Let’s compare the functions j and J of Example 3:
The function J is the same as j evaluated at ; that is, . As we saw
in the example, this means that the graph of J is obtained from the graph of j by shift-
ing 1 unit to the right. In general we have the following.
J1t 2= j1t - 12t - 1
j1t 2= 60tJ1t2= 601t - 1 2
SECTION 5.1
■
Working with Functions: Shifting and Stretching 417
example
4
Horizontal Shifts of Graphs
Use the graph of to sketch the graph of each function.
(a)
(b)
Solution
We start with the graph of f (see Figure 4).
(a) To graph , we shift the graph of f to the left 4 units.
(b) To graph h, we shift the graph of f to the right 2 units.
The graphs of and h are sketched in Figure 4.g
g
h1x 2= 1x - 22
2
g1x 2= 1x + 42
2
f 1x2= x
2
■ NOW TRY EXERCISE 9 ■
1
y
1
x
_
4
0
™
g(x) = (x + 4)
2
h(x) = (x – 2)
2
f(x) = x
2
figure 4 Graphs of and h1x2= 1x - 2 2
2
g1x 2= 1x + 42
2
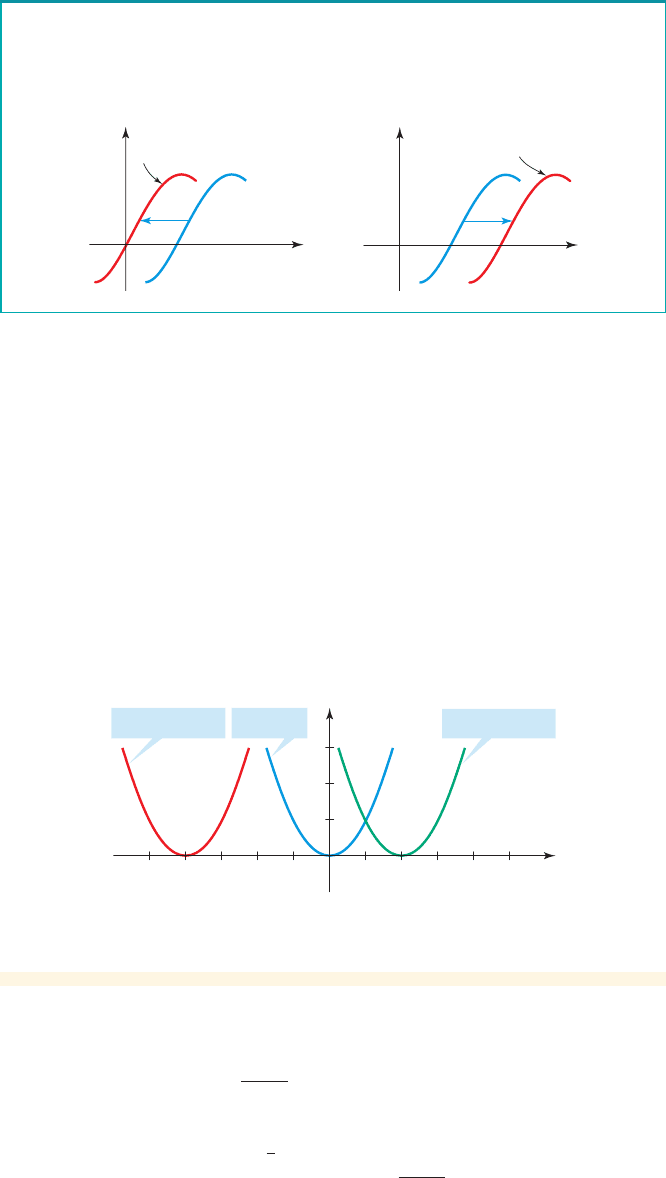
Suppose .
To graph , shift the graph of to the left c units.
To graph , shift the graph of to the right c units.y = f 1x 2y = f 1x - c2
y = f 1x2y = f 1x + c 2
c 7 0
x
y
y=Ï
y=f(x-c)
c
0
y
x
y=Ï
y=f(x+c)
c
0
Horizontal Shifts of Graphs
example
5
Combining Horizontal and Vertical Shifts
Sketch the graph of .
Solution
We start with the graph of (see Example 4 in Section 1.6, page 66) and shift
it to the right 3 units to obtain the graph of . Then we shift the resultingy = 1x - 3
y = 1x
f 1x2= 1x - 3 + 4
418 CHAPTER 5
■
Quadratic Functions and Models
y
x
0
3
4
x – 3 + 4f(x) =
(3, 4)
x – 3y =
xy =
figure 5 Graph of
f 1x 2= 1x - 3
+ 4
graph upward 4 units to obtain the graph of shown in Figure 5.f 1x 2= 1x - 3 + 4
2
■ Stretching and Shrinking Graphs Vertically
In the next example we examine how a function changes if its outputs are multiplied
by a fixed constant.
example
6
Doubling the Speed
Alan is on a trip to the dentist. The function graphed in Figure 6 gives his
distance from home (in miles) t hours after he started.
(a) Graph the function . How is the graph of the new function related to
the graph of the original function?
(b) How does the trip described by the new function differ from the original trip?
y = 2f 1t2
y = f 1t2
Solution
(a) To graph , we multiply each y-value of the original function by 2.
This has the effect of stretching the graph of the original function vertically by
a factor of 2. The graph is shown in Figure 7.
(b) In the new trip Alan doubles the distance he drives in any given time period,
so he doubles his driving speed.
■ NOW TRY EXERCISE 69 ■
Example 6 is a special case of the following general situation.
y = 2f 1t2
d (mi)
t (h)
0
12345
20
40
60
80
100
figure 6 Graph of y = f 1t 2
d (mi)
t (h)
0
12345
20
40
60
80
100
figure 7 Graph of y = 2f 1t 2
■ NOW TRY EXERCISE 13 ■
SECTION 5.1
■
Working with Functions: Shifting and Stretching 419
To graph :
If , stretch the graph of vertically by a factor of c.
If , shrink the graph of vertically by a factor of c.y = f 1x20 6 c 6 1
y = f 1x2c 7 1
y = cf 1x2
y=Ï
y
x
0
y=cÏ
y=Ï
c >1 0 <c <1
y
x
0
y=cÏ
Vertical Stretching and Shrinking of Graphs
example
7
Vertical Stretching and Shrinking of Graphs
Use the graph of to sketch the graph of each function.
(a) (b)
Solution
We start with the graph of f (see Figure 8).
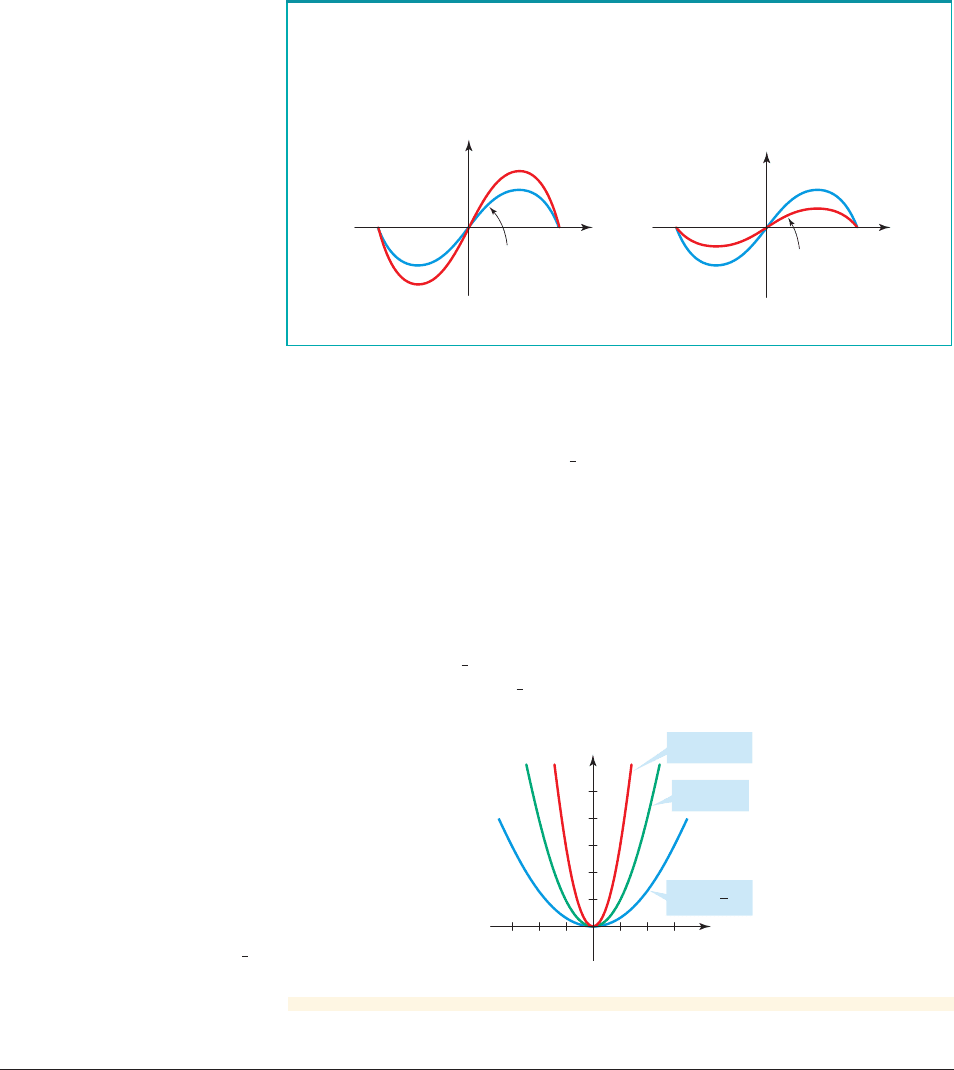
(a) The graph of is obtained by multiplying the y-coordinate of each point on
the graph of f by 3. That is, to obtain the graph of g, we stretch the graph of f
vertically by a factor of 3. The result is the narrower parabola in Figure 8.
(b) The graph of h is obtained by multiplying the y-coordinate of each point on
the graph of f by . That is, to obtain the graph of h, we shrink the graph of f
vertically by a factor of . The result is the wider parabola in Figure 8.
1
3
1
3
g
h1x 2=
1
3
x
2
g1x 2= 3x
2
f 1x2= x
2
y
x
0
1
4
1
3
h(x) = x
2
f(x) = x
2
g(x) = 3x
2
figure 8 Graphs of
and h1x 2=
1
3
x
2
g1x 2= 3x
2
2
■ Reflecting Graphs
Suppose we know the graph of . How do we use it to obtain the graphs of
and ? The y-coordinate of each point on the graph of
is simply the negative of the y-coordinate of the corresponding point on the graph of
y =-f 1x 2y = f 1- x2y =-f 1x2
y = f 1x2
■ NOW TRY EXERCISES 33 AND 35 ■
420 CHAPTER 5
■
Quadratic Functions and Models
example
8
Reflecting Graphs
y
x
y=x™
f(x)=_x™
2
2
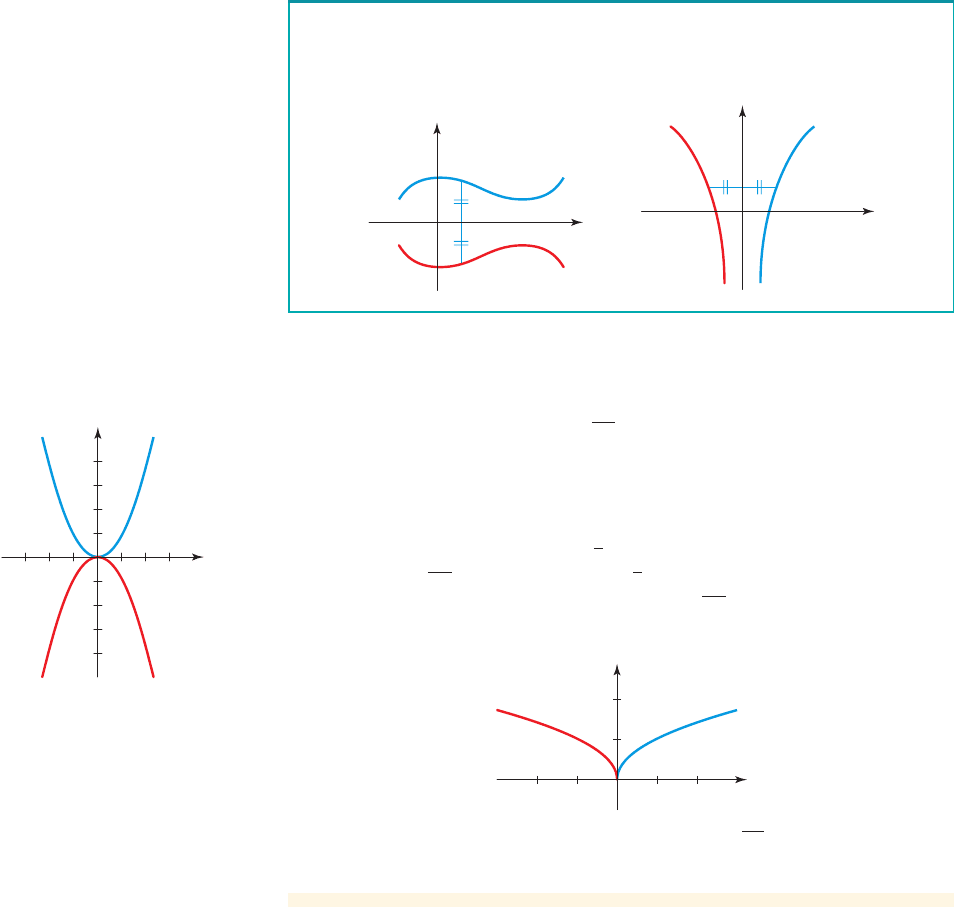
figure 9 Graph of f 1x 2=-x
2
y
x
y=œ
∑
x
g(x)=œ
∑
_x
0
1
1
figure 10 Graph of g1x 2= 1- x
example
9
Transformations of Exponential Functions
Use the graph of to sketch the graph of each function.
(a) (b) h1x 2=-2
x
g1x 2= 1 + 2
x
f 1x2= 2
x
To graph , reflect the graph of in the x-axis.
To graph , reflect the graph of in the y-axis.y = f 1x 2y = f 1- x 2
y = f 1x2y =-f 1x 2
y=Ï
y
x
0
y=_Ï
y
x
0
y=f(_x)
y=Ï
. So the desired graph is the reflection of the graph of in the x-axis.
On the other hand, the value of at x is the same as the value of
at , so the desired graph here is the reflection of the graph of in the
y-axis. The following box summarizes these observations.
Reflecting Graphs
y = f 1x2- x
y = f 1x2y = f 1- x2
y = f 1x2y = f 1x2
■ NOW TRY EXERCISES 37 AND 39 ■
Sketch the graph of each function.
(a) (b)
Solution
(a) We start with the graph of . The graph of is the graph of
reflected in the x-axis (see Figure 9).
(b) We start with the graph of (see Example 4 in Section 1.6). The graph
of is the graph of reflected in the y-axis (see Figure 10).
Note that the domain of the function is .5x 0x … 06g1x2= 1- x
y = 1xg1x 2= 1- x
y = 1x
y = x
2
f 1x2=-x
2
y = x
2
g1x 2= 1- xf 1x2=-x
2
SECTION 5.1
■
Working with Functions: Shifting and Stretching 421
1
0
x
y
(b)
1
y=2˛
y=_2˛
_1
0
x
y
y=2˛
(a)
1
y=1+2˛
2
Horizontal
asymptote
y=1
figure 11
■ NOW TRY EXERCISES 45 AND 47 ■
example
10
Transformations of Logarithmic Functions
Use the graph of to sketch the graph of each function.
(a) (b)
Solution
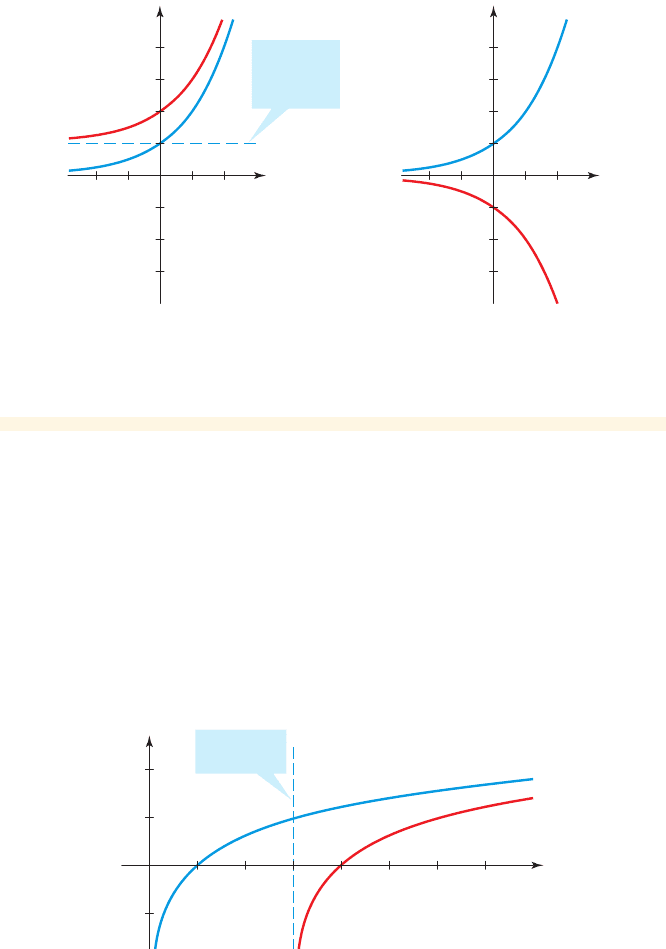
(a) To obtain the graph of , we start with the graph of
and shift it to the right 3 units, as shown in Figure 12. Notice
that the line is a vertical asymptote.x = 3
f 1x2= log
10
x
g1x 2= log
10
1x - 3 2
h1x 2= log
10
1- x2g1x 2= log
10
1x - 3 2
f 1x2= log
10
x
Solution
(a) To obtain the graph of , we start with the graph of and
shift it upward one unit. Notice from Figure 11(a) that the line is now
the horizontal asymptote.
(b) Again we start with the graph of , but here we reflect in the x-axis to
get the graph of shown in Figure 11(b).h1x2=-2
x
f 1x2= 2
x
y = 1
f 1x2= 2
x
g1x 2= 1 + 2
x
f(x)=log⁄‚ x
h(x)=log⁄‚(x-3)
1
0
x
y
4
1
Asymptote
x = 3
figure 12
422 CHAPTER 5
■
Quadratic Functions and Models
Fundamentals
1. Fill in the blank with the appropriate direction (left, right, up, or down).
(a) The graph of is obtained from the graph of by shifting
_______ 3 units.
(b) The graph of is obtained from the graph of by shifting
_______ 3 units.
2. Fill in the blank with the appropriate direction (left, right, up, or down).
(a) The graph of is obtained from the graph of by shifting
_______ 3 units.
(b) The graph of is obtained from the graph of by shifting
_______ 3 units.
3. Fill in the blank with the appropriate axis (x-axis or y-axis).
(a) The graph of is obtained from the graph of by reflecting in the
_______.
(b) The graph of is obtained from the graph of by reflecting in the
_______.
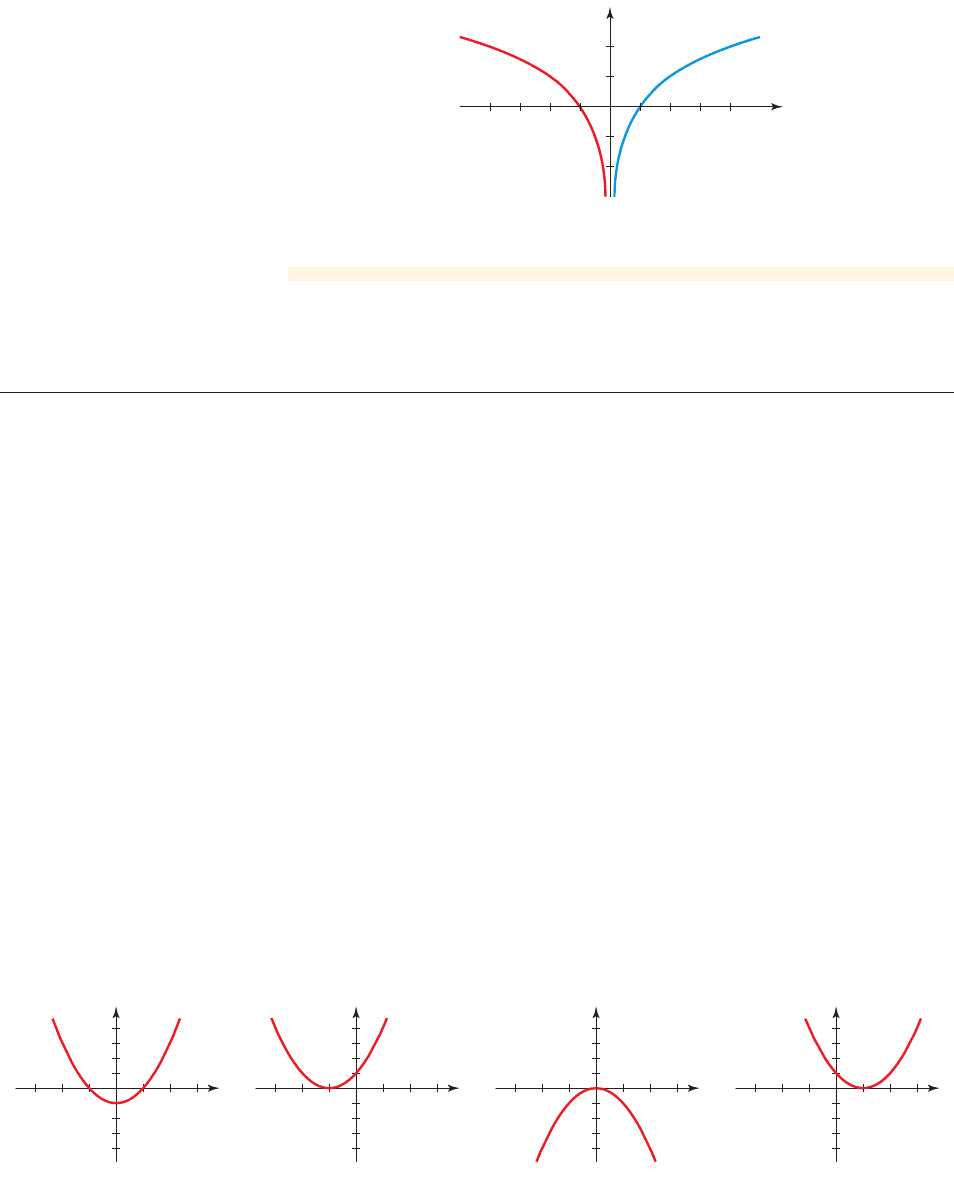
4. Match the graph with the function.
(a) (b) (c) (d) y =-x
2
y = x
2
- 1y = 1x - 12
2
y = 1x + 1 2
2
y = f 1x 2y = f 1- x2
y = f 1x 2y =-f 1x2
y = f 1x 2y = f 1x - 32
y = f 1x 2y = f 1x2- 3
y = f 1x 2y = f 1x + 32
y = f 1x 2y = f 1x2+ 3
123
_1_2_3
x
y
2
_2
_4
4
123
_1_2_3
x
y
2
_2
_4
4
123
_1_2_3
x
y
2
_2
_4
4
1
I II III IV
23
_1_2_3
x
y
1
_2
_4
4
5.1 Exercises
CONCEPTS
f(x)=log¤ x
h(x)=log¤(
_x)
1
_1
x
y
1
0
figure 13
(b) Again we start with the graph of , but here we reflect in the
y-axis to get the graph of in Figure 13.h1x 2= log
10
1- x2
f 1x2= log
10
x
■ NOW TRY EXERCISES 49 AND 51 ■

SECTION 5.1
■
Working with Functions: Shifting and Stretching 423
Think About It
5–6 ■ Can the function be obtained from f by transformations? If so, describe the
transformations needed.
5. f and are described algebraically: ,
6. f and are described graphically in the figure in the margin.g
g1x 2= 1x - 22
2
+ 5f 1x 2= 1x + 22
2
g
g
x
y
g
f
0
1
1
SKILLS
7–12 ■ Use the graph of to graph the following.
7. (a) 8. (a)
(b) (b)
9. (a) 10. (a)
(b) (b)
11. (a) 12. (a)
(b) (b)
13. Use the graph of to graph the following.
(a) (b) (c)
14. Use the graph of (see Example 9 of Section 1.6, page 70) to graph the
following.
(a) (b) (c)
15. Use the graph of to graph the following.
(a) (b) (c)
16. Use the graph of to graph the following.
(a) (b) (c)
17. The graph of is given. Sketch graphs of the following functions.
(a) (b) y = f 1x 2- 2y = f 1x - 22
y = f 1x 2
g1x 2=-log
3
1x - 42g1x 2=-log
3
xg1x2= log
3
1x + 12
f 1x 2= log
3
x
g1x 2= 1 - 3
x
g1x 2=-3
x
g1x 2= 3
x
- 2
f 1x 2= 3
x
g1x 2= 0x - 2 0+ 2g1x 2= 0 x 0+ 1g1x 2= 0x - 3 0
f 1x 2= 0
x 0
g1x 2= 1x + 2
+ 2g1x 2= 1x + 1g1x 2= 1x + 4
f 1x 2= 1x
g1x 2= 1x + 32
2
+ 2g1x 2= 1x - 32
2
+ 5
g1x 2= 1x - 52
2
- 3g1x 2= 1x + 22
2
- 1
g1x 2= 1x + 32
2
g1x 2= 1x - 42
2
g1x 2= 1x - 72
2
g1x 2= 1x + 22
2
g1x 2= x
2
+ 6g1x2= x
2
+ 2
g1x 2= x
2
- 1g1x 2= x
2
- 4
f 1x 2= x
2
x
y
0
2
2
x
y
0
2
2
18. The graph of is given. Sketch graphs of the following functions.
(a) (b) y =-g1x2- 1y = g1x2- 2
y = g1x2