Stewart J. College Algebra: Concepts and Contexts
Подождите немного. Документ загружается.


354 CHAPTER 4
■
Logarithmic Functions and Exponential Models
2
■ Continuously Compounded Interest
Some banks offer continuously compounded interest; that is, the interest is com-
pounded at each instant (as opposed to each month, week, or day). To calculate con-
tinuously compounded interest, we need the exponential function. Remember from
Section 3.1 that compound interest is calculated by using the formula
Suppose that $5000 is invested in a 3-year CD that pays 5.5% interest (see Example
6 in Section 3.1). Table 2 shows how the amount of the investment depends on the
number of compounding periods.
A1t 2= P a1 +
r
n
b
nt
Number
of compounding
periods per year
Calculation Amount
1
500011 + 0.0552
3
$5871.21
2
5000A1 +
0.055
2
B
2
#
3
$5883.84
4
5000A1 +
0.055
4
B
4
#
3
$5890.34
12
5000A1 +
0.055
12
B
12
#
3
$5894.74
365
5000A1 +
0.055
365
B
365
#
3
$5896.89
1000
5000A1 +
0.055
1000
B
1000
#
3
$5896.93
100,000
5000A1 +
0.055
10
5
B
10
5
#
3
$5896.97
1,000,000
5000A1 +
0.055
10
6
B
10
6
#
3
$5896.97
Solution
(a) Property 3:
(b) Rules of Exponents
Property 3:
(c) Calculator
(d) Calculator
■ NOW TRY EXERCISE 13 ■
ln 0.3 L-1.204
ln 5 L 1.609
ln e
x
= x =-2
ln a
1
e
2
b= ln e
-2
ln e
x
= xln e
8
= 8
table 2
Compound interest
So the value of the investment increases as the number of compounding periods
increases, but the increase in value levels off as the number of compounding periods
gets very large. This same phenomenon occurs for any interest rate r. To see why, let
. Thenm = n>r

SECTION 4.4
■
The Natural Exponential and Logarithm Functions 355
Formula for compound interest
Because
Because , so
Recall that as m becomes large, the quantity approaches the number e.
Thus, the amount approaches . This expression gives the amount when
interest is compounded at “every instant.”
Continuously Compounded Interest
A1t 2= Pe
rt
11 + 1>m 2
m
r>n = 1>mm = n>r = P ca1 +
1
m
b
m
d
rt
nt = 1n>r 2
#
rt = P ca1 +
r
n
b
n>r
d
rt
A1t 2= P a1 +
r
n
b
nt
If an amount P is invested at an annual interest rate r compounded
continuously, then the amount of the investment after t years is given
by the formula
A1t 2= Pe
rt
A1t 2
example
4
Calculating Continuously Compounded Interest
Find the amount after 3 years if $5000 is invested at an interest rate of 5.5% per year,
compounded continuously.
Solution
We use the formula for continuously compounded interest with ,
, and to get
Thus the amount is $5896.97. Compare this amount with the amounts in Table 2.
■ NOW TRY EXERCISE 43 ■
A1t 2= 5000e
0.055132
= 5896.97
t = 3r = 0.055
P = $5000
2
■ Instantaneous Rates of Growth or Decay
In Section 3.1 we modeled the growth of populations using exponential func-
tions, where the base of the exponential function is the growth factor. But in re-
ality, the population is continually changing, so the rate of change of the popula-
tion is itself continually changing. Likewise, we may know the half-life of a
radioactive substance, but in reality the substance is continuously decaying, so
the rate of change of the amount of radioactive material is itself continually
changing. So it is reasonable to model such quantities in terms of an “instanta-
neous” growth rate. It can be shown by using calculus that exponential growth
can be modeled by a function of the form , where r is the “instanta-
neous” growth rate. This is identical to the situation we encountered with con-
tinuously compounded interest.
f 1x2= Ce
rt
The amount we obtained for
continuous compounding is the
same as the last few entries in Table
2, because for these entries there
were many compounding periods in
the year.
356 CHAPTER 4
■
Logarithmic Functions and Exponential Models
example
5
Modeling Exponential Growth
The initial bacteria count in a culture is 500 CFU/mL. The instantaneous growth rate
of the bacteria is 40% per hour.
(a) Find an exponential function that models the number of bacteria
after t hours.
(b) What is the estimated bacteria count after 10 hours?
(c) Draw the graph of the function found in part (a).
Solution
(a) We use the exponential growth model with and to get
where t is measured in hours.
(b) Using the function in part (a), we find that the bacteria count after 10 hours is
CFU/mL
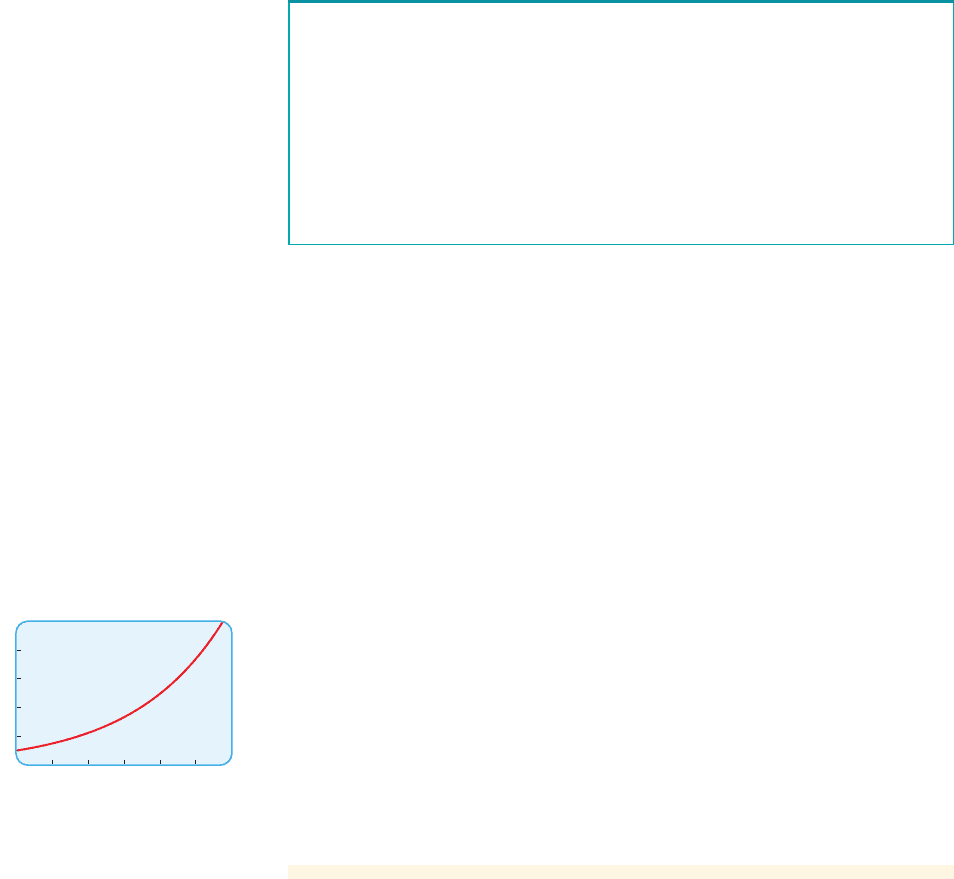
(c) The graph is shown in Figure 4.
■ NOW TRY EXERCISE 27 ■
If , then the function models exponential decay. So a negative
instantaneous “growth” rate r corresponds to an instantaneous decay rate.
f 1t2= Ce
rt
r 6 0
f 1102= 500e
0.4
#
10
= 500e
4
L 27,300
f 1t2= 500e
0.4t
r = 0.4C = 500
f 1t2= Ce
rt
The exponential function
models exponential growth (if ) or exponential decay (if ).
■
The variable t represents time.
■
The constant C is the initial value of f (the value when ).
■
The number r is the instantaneous growth rate (or instantaneous decay
rate) expressed as a proportion of the population per time unit.
t = 0
r 6 0r 7 0
f 1t2= Ce
rt
Bacteria usually grow in colonies that become visible to the naked eye. So mi-
crobiologists often count the number of bacteria colonies in a portion of a sample
and then estimate the bacteria count. In this case the bacteria count is given in terms
of colony-forming units per milliliter (CFU/mL).
5000
0
6
figure 4 Graph of
f 1t 2= 500e
0.4t
example
6
Modeling Exponential Decay
The initial bacteria count in a culture is 1000 CFU/mL. In the presence of an antibi-
otic the bacteria count has an instantaneous decay rate r of per hour.
(a) Is the bacteria count increasing or decreasing?
(b) Find an exponential function that models the bacteria count, where
t is measured in hours.
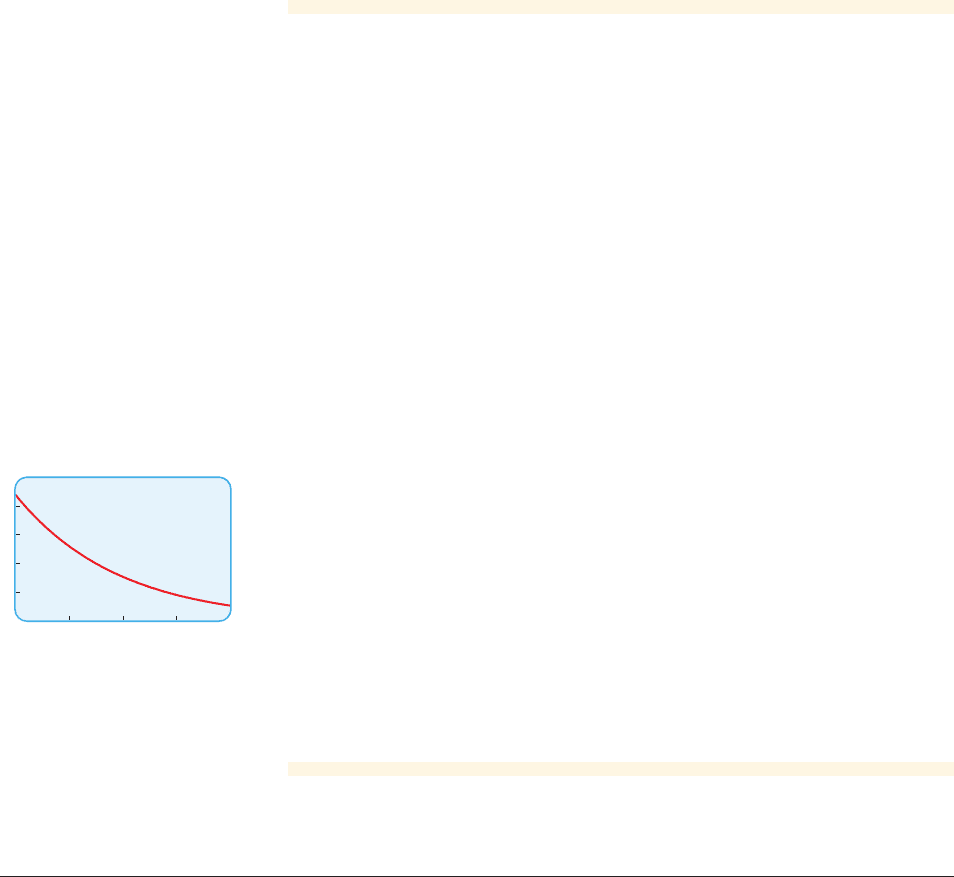
(c) Sketch the graph of the function found in part (a).
f 1t2= Ce
rt
- 0.12
Exponential Growth and Decay

SECTION 4.4
■
The Natural Exponential and Logarithm Functions 357
1000
0
20
figure 5 Graph of
f 1t 2= 1000e
-0.12t
2
■ Expressing Exponential Models in Terms of e
In studying population growth, scientists measure the growth rate over a fixed time
period, not the instantaneous growth rate. For example, a biologist may find that a
bacteria culture increases by 40% in 1 hour. Or a physicist may find that it takes 10
minutes for a radioactive substance to decay to half its mass. This type of informa-
tion allows us to find models in terms of growth or decay rates. We can also use this
information to find the instantaneous growth rate and express these models in terms
of the natural exponential function. Let’s see how this is done.
Suppose that a bacteria culture is modeled by . To find the instan-
taneous growth rate r, let’s compare the two models
For these models to be the same, we must have
Set the models equal
Divide by 100
Take ln of each side
Properties of ln
Divide by x
In general, we have the following.
Expressing an Exponential Model in Terms of e
ln 2 = r
x ln 2 = rx
ln 2
x
= ln e
rx
2
x
= e
rx
100
#
2
x
= 100
#
e
rx
f 1x2= 100
#
2
x
andf 1x2= 100
#
e
rx
f 1t2= 100
#
2
t
Solution
(a) Since the instantaneous rate is negative, the bacteria count is decreasing.
(b) We use the exponential growth model with and to get
where t is measured in hours.
(c) The graph is shown in Figure 5.
■ NOW TRY EXERCISES 29 AND 49 ■
f 1t2= 1000e
-0.12t
r =-0.12C = 1000
The exponential growth or decay model
(growth or decay factor a per time period)
is equivalent to the exponential model
(instantaneous growth or decay rate r per time period)
where the instantaneous growth or decay rate is
r = ln a
f 1x 2= Ce
rx
f 1x 2= Ca
x
example
7
Expressing Exponential Models in Terms of e
Express the model in terms of the base e.f 1x 2= 35011.42
x
358 CHAPTER 4
■
Logarithmic Functions and Exponential Models
example
8
Expressing Exponential Models in Terms
of Instantaneous Growth Rate
A sample contains 22 micrograms of a radioactive substance, and the amount of the
substance is decreasing by 10% per day.
(a) Find an exponential function that models the amount of the
substance, where x is measured in days.
(b) Find the instantaneous decay rate (in decimal form) per day, and find an expo-
nential function that models the amount of the substance, where x
is measured in days.
(c) Sketch the graphs of the functions f and .
Solution
(a) Since the amount of the substance is decreasing by 10% per day, the decay
rate is , so the decay factor is . The exponential
growth model that we seek is
where x is measured in days.
(b) The instantaneous decay rate is
We use the exponential decay model, where C is 22 and r is , to get
where x is measured in days.
(c) The graphs of f and are the same, as shown in Figure 6.
■ NOW TRY EXERCISES 35 AND 53 ■
g
g1x 2= 22e
-0.105x
- 0.015
r = ln a = ln10.902L-0.105
f 1x2= 2210.90 2
x
a = 1 + 1- 0.102= 0.90- 0.10
g
g1x 2= Ce
rx
f 1x2= Ca
x
25
0
20
figure 6 Graphs of
and
g1x2= 22e
-0.105x
f 1x 2= 2210.902
x
4.4 Exercises
CONCEPTS
Fundamentals
1. (a) The function is called the _______ exponential function. The number e
is approximately equal to
_______ (to five decimal places).
(b) The natural logarithm function is , so
_______.ln e =f 1x 2= ln x = log
ⵧ
x
f 1x 2= e
x
Solution
In the model the growth factor is 1.4, so the instantaneous growth
rate is
So the model that we seek is
■ NOW TRY EXERCISE 31 ■
f 1x2= 350e
0.34x
r = ln 1.4 L 0.34
f 1x2= 35011.4 2
x

SECTION 4.4
■
The Natural Exponential and Logarithm Functions 359
2. In the formula for continuously compounded interest, the letters P, r, and t
stand for
_______, _______, and _______, respectively, and stands for
_______. So if $100 is invested at an interest rate of 6% compounded continuously,
then the amount after 2 years is
_______.
3. If the growth factor for a population is a, then the instantaneous growth rate is
_______. So if the growth factor for a population is 1.5, then the instantaneous
growth rate is
_______.
4. If a population P has a instantaneous growth rate r per year and the initial population is
C, then an exponential model for the population after t years is given by .
Think About It
5. Suppose that the bacteria count in one culture doubles every 10 minutes and that in
another culture increases by 40% every 8 minutes. Which culture is growing faster?
Explain how finding the instantaneous growth rate of each culture helps us to answer
this question.
6. Suppose that $100 is invested at the beginning of a year. Which (if either) of the
following methods of growing the investment results in a larger amount at the end of the
year?
(i) The investment grows at an interest rate of 5% per year, compounded continuously.
(ii) The investment grows at an instantaneous growth rate of 5% per year.
7. Recall that a function models growth if and decay if .
How does the formula show that an instantaneous growth rate r is always
positive, whereas an instantaneous decay rate r is always negative?
8. A bacteria culture starts with 1 bacterium. Find a model for the bacteria population after
t hours under the given conditions. How do these models differ?
(a) One bacterium is added to the population each hour.
(b) The population growth factor is 2.
(c) The population increases by 100% per hour.
(d) The population has an instantaneous growth rate of 1.
9–10
■ Evaluate the expression using a calculator.
9. (a) (b) (c) (d)
10. (a) (b) (c) (d)
11–12 ■ Complete the table and sketch the graph of the functions f and on the same axes.
11. f 1x2= e
3x
,g1x 2= e
-3x
g
3.2 - 2e
3
+ e
-1
4.1e
-6.2
e
3.9
4e
2
5 + 2e
2
3e
-3.1
e
1.4
3e
r = ln a
0 6 a 6 1a 7 1f 1x 2= Ca
x
f 1t 2= C
#
ⵧ
ⵧ
r =
A1t 2
A1t 2= Pe
rt
SKILLS
x
- 2 - 1
0 1 2
f 1x 2
x
- 2 - 1
0 1 2
g1x 2
x
- 2 - 1
0 1 2
f 1x 2
x
- 2 - 1
0 1 2
g1x 2
12. f 1x2= e
-0.5x
,g1x 2= e
0.5x

360 CHAPTER 4
■
Logarithmic Functions and Exponential Models
13–14
■ Evaluate the expression. Use a calculator if necessary.
13. (a) (b) (c) (d)
14. (a) (b) (c) (d)
15–16
■ Complete the table, and sketch the graph of the function by plotting points.
15. f 1x2= 4 ln x
ln11 + e23 ln 3
1
ln e
2
ln16e 2
5 + ln1e - 22ln 2ln11>e 2ln e
4
16. f 1x2=-3 ln x
x
y
100
1
I
0 0
x
x
x
yy
y
25
II III IV
10
25
10
200
1
0
0
x
1
e
4
1
e
3
1
e
2
1
e
1
1
e
1
e
2
e
3
e
4
f 1x 2
x
1
e
4
1
e
3
1
e
2
1
e
1
1
e
1
e
2
e
3
e
4
f 1x 2
17–18 ■ Use a graphing calculator to draw a graph of the family of logarithmic functions
for the given values of a, all on the same graph.
17. 18.
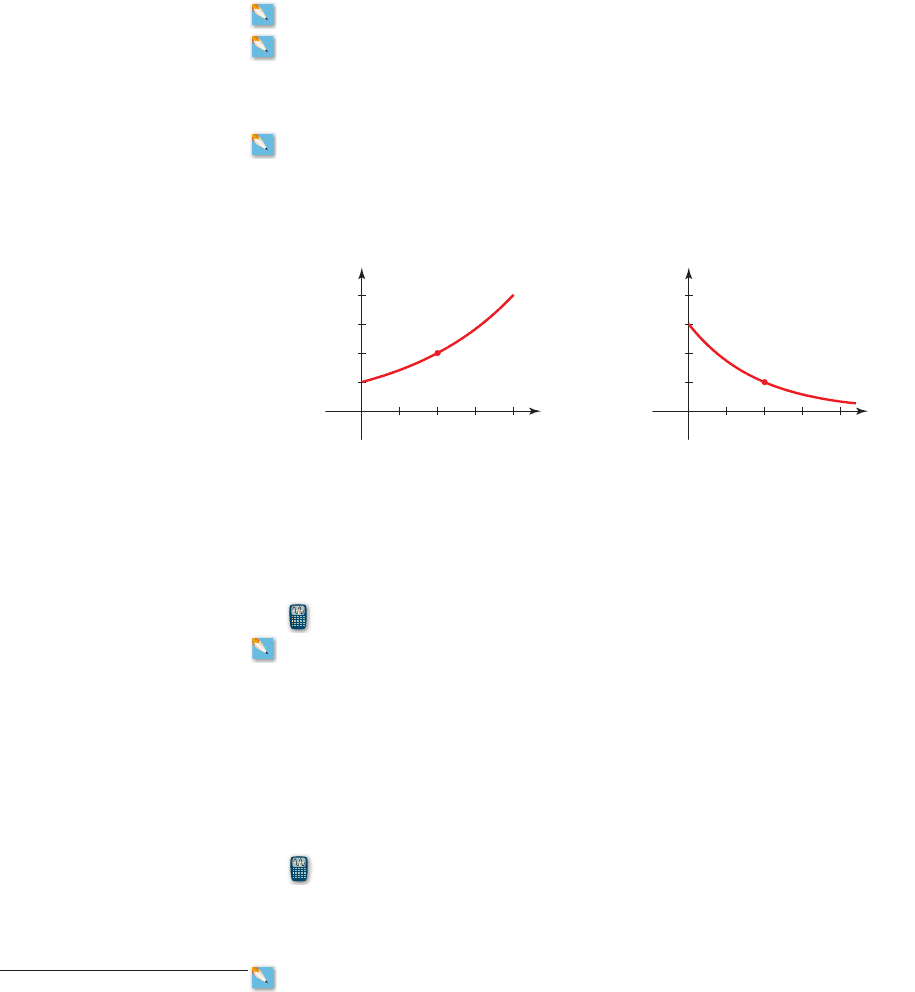
19–22
■ Match the function with its graph.
19. 20.
21. 22. f 1x 2=-20 ln xf 1x2= 20 ln x
f 1x 2= 20
#
e
-x
f 1x 2= 20
#
e
x
a = 2, e, 3a = 2, e, 4
f 1x 2= log
a
x
23–26
■ An exponential growth or decay model is given.
(a) Determine whether the model represents growth or decay.
(b) Find the instantaneous growth or decay rate.
23. 24.
25. 26.
27–30
■ The initial size of a population is 1000, and it has the given instantaneous growth
or decay rate per year.
(a) Find an exponential model for the population, where t is measured in
years.
(b) Sketch the graph of the function found in part (a).
f 1x 2= Ce
rx
h1t 2= 300
#
e
1.5t
M1t 2= 25
#
e
-0.3t
g1t 2= 200
#
e
-0.25t
f 1t 2= 500
#
e
0.5t
27. 2.4% 28. 0.90
29. 30.
31–32
■ Express the given model in terms of the base e. What is the instantaneous growth
rate?
31. (a) (b)
32. (a) (b)
33–34
■ The graph of a function that models exponential growth or decay is shown. Find
the initial population and instantaneous growth rate.
33. 34.
k1x 2= 21010.78 2
x
h1T 2= 1311.72 2
T
g1x 2= 2500
#
2
-x
f 1t 2= 2500
#
2
t
- 75%- 0.36
35–38
■ The initial size of a population is 200 and increases or decreases by the given
percentage per year.
(a) Find an exponential model for the population, where a is the growth or
decay factor and t is measured in years.
(b) Find an exponential model for the population, where r is the
instantaneous growth or decay rate and t is measured in years.
(c) Use a graphing calculator to graph the models f and . Are the graphs the same?
35. 3.4% 36.
37. 38. 2.9%
39–42
■ The initial size of a population is 3000, and after 5 years the population is the
given amount.
(a) Find an exponential model for the population, where a is the growth or
decay factor and t is measured in years.
(b) Find an exponential model for the population, where r is the
instantaneous growth or decay rate and t is measured in years.
(c) Use a graphing calculator to graph the models f and . Are the graphs the same?
39. 5000 40. 2500
41. Half the initial population 42. Double the initial population
43. Compound Interest If $25,000 is invested at an interest rate of 7% per year, find the
amount of the investment at the end of 5 years for the following compounding methods.
(a) Semiannual (b) Quarterly (c) Monthly (d) Continuously
44. Compound Interest If $12,000 is invested at an interest rate of 10% per year, find
the amount of the investment at the end of 3 years for the following compounding
methods.
(a) Semiannual (b) Quarterly (c) Monthly (d) Continuously
45. Compound Interest Madeleine invests $11,000 at an interest rate of 10%,
compounded continuously.
(a) What is the instantaneous growth rate of the investment?
(b) Find the amount of the investment after 5 years.
g
g1t 2= Ce
rt
f 1t 2= Ca
t
- 5.4%
- 1.2%
g
g1t2= Ce
rt
f 1t 2= Ca
t
SECTION 4.4
■
The Natural Exponential and Logarithm Functions 361
x
g
y
300
(1, 100)
1
0
x
f
y
100
(1, 200)
1
0
CONTEXTS

362 CHAPTER 4
■
Logarithmic Functions and Exponential Models
(c) If the investment was compounded only quarterly, what would be the amount after
5 years?
46. Compound Interest Shalan invests $8000 at an interest rate of 9.875%, compounded
continuously.
(a) What is the instantaneous growth rate of the investment?
(b) Find the amount of the investment after 7 years.
(c) If the investment was compounded only quarterly, what would the amount be after
7 years?
47. Bacteria Culture The number of bacteria in a culture is modeled by the function
where t is measured in hours.
(a) What is the initial number of bacteria?
(b) Is the number of bacteria increasing or decreasing? Find the instantaneous growth
or decay rate. Express your answer as a percentage.
(c) How many bacteria are in the culture after 3 hours?
48. Fish Population The number of fish in a Minnesota lake is modeled by the function
where t is measured in years and is measured in millions.
(a) What is the initial number of fish?
(b) Is the number of fish increasing or decreasing? Find the instantaneous growth or
decay rate. Express your answer as a percentage.
(c) What will the fish population be after 5 years?
49. Population of Minneapolis The population of Minneapolis was 383,000 in 2000
with an instantaneous decay rate r of per year.
(a) Express the instantaneous decay rate in percentage form. Is the population
increasing or decreasing?
(b) Find an exponential model for the population t years after 2000.
(c) Sketch a graph of the function you found in part (b).
50. Atmospheric Pressure The atmospheric pressure of the air at sea level is 14.7 PSI
(pounds per square inch), with an instantaneous decay rate r of per 1000
inches above sea level.
(a) Express the instantaneous decay rate in percentage form. As height increases above
sea level, does the atmospheric pressure increase or decrease?
(b) Find an exponential model that models the atmospheric pressure,
where x is measured in thousands of inches above sea level.
(c) Denver is one mile above sea level. Use the model found in part (b) to find the
atmospheric pressure in Denver. (Remember to convert miles to inches.)
(d) Sketch a graph of the function you found in part (b).
51. Bacterial Infection The bacterium Streptococcus pyogenes (S. pyogenes) is the cause
of many human diseases, the most common being strep throat. This bacterium is found
in many dairy products, and its growth rate depends on the temperature. A biologist
finds that the bacteria count of S. pyogenes is 20 colony-forming units per milliliter
(CFU/mL) in a sample of sour cream stored at 25°C and that the doubling time is
30 minutes under these conditions.
(a) Find the hourly growth factor a, and find an exponential model for the
bacteria count in the sour cream, where t is measured in hours.
f 1t 2= Ca
t
f 1x 2= Ce
rx
- 0.0029
f 1t 2= Ce
rt
- 0.0052
f 1t 2
f 1t2= 12e
0.012t
f 1t2= 500e
0.45t

SECTION 4.4
■
The Natural Exponential and Logarithm Functions 363
(b) Find the instantaneous growth rate r, and find an exponential model for
the bacteria count t hours later.
(c) Use a graphing calculator to graph the functions f and . Are the graphs the same?
52. Bacteria Infection Food poisoning is most often caused by E. coli bacteria. To test
for the presence of E. coli in a pot of beef stew, a biologist performs a bacteria count on
a small sample of the stew kept at . She determines that the count is 5 colony-
forming units per milliliter (CFU/mL) and that the doubling time is 40 minutes under
these conditions.
(a) Find the hourly growth factor a, and find an exponential model for the
bacteria count in the beef stew, where t is measured in hours.
(b) Find the instantaneous growth rate r, and find an exponential model for
the bacteria count t hours later.
(c) Use a graphing calculator to graph the functions f and . Are the graphs the same?
53. Internet Usage in China Internet World Stats reports that the number of Internet
users in China increased by 1024% from 2000 to 2008 (so the growth rate is 10.24 and
the growth factor is 11.24 for this time period). The number of Internet users in 2000
was about 22.5 million. Assume that the number of Internet users increases
exponentially.
(a) Find the yearly growth factor a, and find an exponential model for the
number of Internet users in China t years since 2000, where the number of Internet
users is measured in millions.
(b) Find the instantaneous growth rate r, and find an exponential model for
the number of Internet users t years since 2000.
(c) Use each of the models you found to predict the number of Internet users in China
in 2010. Do your models give the same result? Does this result seem reasonable?
54. Cell Phone Usage With rapid economic expansion, India is experiencing a cell phone
boom that doesn’t show any signs of slowing down. In 2004 India had 34 million cell
phone subscribers, and in 2008 this number had increased to 246 million. Assume that
the number of cell phone subscribers continues to increase at this rate.
(a) Find an exponential growth model for the number of cell phone
subscribers, where a is the yearly growth factor, t is the number of years since
2004, and the number of subscribers is measured in millions.
(b) Find an exponential growth model for the number of cell phone
subscribers, where r is the instantaneous growth rate, t is the number of years since
2004, and the number of subscribers is measured in millions.
(c) Use each of the models found in parts (a) and (b) to predict the number of cell
phone subscribers in the year 2010. Do the two models make the same prediction?
(d) Search the Internet to find the reported number of cell phone subscribers in India
in 2010 and compare with your result in part (c).
55. The Beer-Lambert Law As sunlight passes through the waters of lakes and oceans,
the light is absorbed, and the deeper it penetrates, the more its intensity diminishes. The
light intensity I at depth x is given by the Beer-Lambert Law:
where is the light intensity (in lumens) at the surface and k is a constant that depends
on the murkiness of the water. A biologist uses a photometer to investigate light
penetration in a northern lake, obtaining the data in the table on the next page.
(a) Use a graphing calculator to find an exponential function of the form that
models the data.
(b) Express the function in part (a) in the form .I = I
0
e
-kx
I = ab
x
I
0
I = I
0
e
-kx
g1t 2= Ce
rt
f 1t 2= Ca
t
g1t 2= Ce
rt
f 1t 2= Ca
t
g
g1t 2= Ce
rt
f 1t 2= Ca
t
25°C
g
g1t 2= Ce
rt
R
R