Sioshansi F.P. Smart Grid: Integrating Renewable, Distributed & Efficient Energy
Подождите немного. Документ загружается.

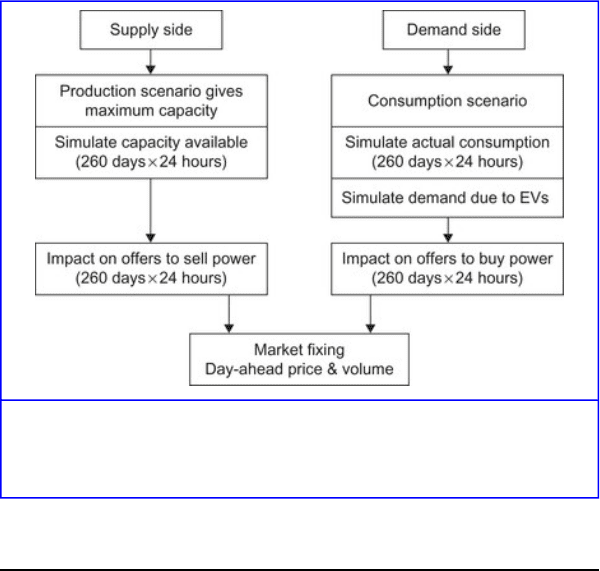
Figure 19.4
Diagram showing the approach proposed.
Simulating the Supply Side
For each of the generation scenarios, the capacity that will be
available is simulated for each type of power plant (nuclear,
fossil-fuel, run-of-river hydro, pumped hydro, peaking plants
and wind power) at some date in the future. This is carried out
in four steps:
1. Select the reference year (or years) for which the
aggregate offers, the total consumption, and the actual
production for each class of power plant are available. Here
it is the 52-week period from Monday October 1, 2007
until Friday September 26, 2008.
921
2. Each of the scenarios for the generation fleet specifies
the maximum capacity available for each class of generator
in the future. Using a procedure similar to that used by the
RTE [5], we generate multiple realizations of the
production for each class of power plant (nuclear, thermal,
etc.) for 24 hours per day for 260 working days per year
from 2011 until 2025. Details are given in Armstrong et al.
[18].
3. The aggregate offers to sell electricity are split into three
tranches according to the marginal cost of production:
a. low marginal costs, which corresponds to nuclear
power, run-of-river hydro, and wind power
b. mid-range marginal costs, which correspond to
conventional thermal plants
c. high marginal costs (or high opportunity costs), which
correspond to peaking plants and pumped hydro.
4. It is assumed that producers will apply the same strategy
in the future as at present. In that case the offers to sell
electricity in each tranche have the same shape up to a
multiplicative factor as during the reference year. If the
quantity of power offered increases or decreases by a
certain percent, the volume offered will increase or
decrease by the same percent. The overall aggregated curve
of offers to sell can then be reconstituted by summing the
offers for the three tranches.
Figure 19.5 illustrates this concept. The solid black and grey
curves were the original aggregate offers to buy and to sell
power in the reference year. In this illustration the thresholds
between the low and medium marginal cost tranches and
between the medium and high tranches were set at 20 euros
922
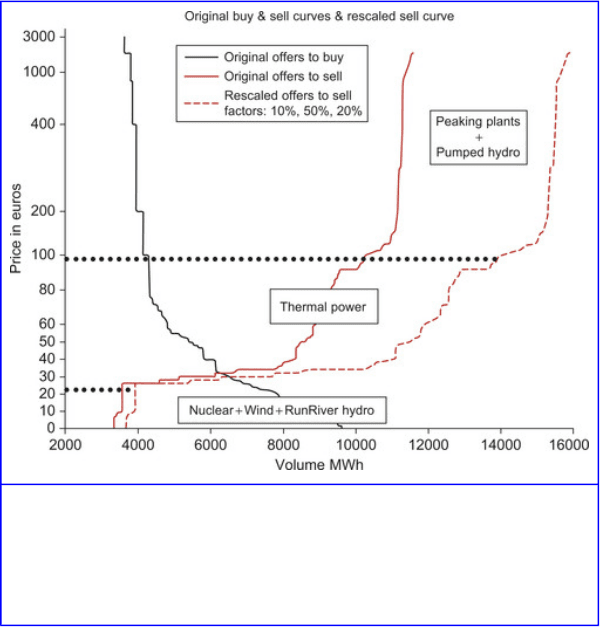
and 100 euros, respectively. Now suppose that in a particular
simulation the production capacity available in the three
tranches rises by 10%, 50%, and 20%, respectively, compared
to the reference year. Then the volumes offered in the first
slice also increase by 10%, giving the first segment of the
dotted curve. Similarly the volumes offered in the second
tranche rise by 50%. These are added to those in the first
slice, and so on for the third tranche. The dotted curve
represents the new simulated aggregate offers to sell power.
Figure 19.5
The simulated aggregate curve of offers to sell electricity. The quantity offered
in each tranche is rescaled to take account of the simulated production in that
production class.
923

The choice of the threshold prices separating the three
different production tranches is important. In general utilities
are reluctant to give out information on the marginal costs of
different types of generators. In France these can be deduced
from the strike prices of VPP (virtual power plants) auctioned
by the EDF every three months. These are derivative
contracts that were designed to allow EDF's competitors to
access power without divesting the power plants.
The strike prices are set to be equal to the average marginal
cost of nuclear power plants for baseload VPP and to thermal
power plants for peakload VPP, respectively. During the
reference year the strike price of baseload VPP was 9 €
throughout the year whereas that of peak load VPP varied
from 64 € to 85 €, with an average of 73 €.
As the marginal cost for nuclear plants was 9 € on average, it
was below 9 € for some plants and above for others. So the
limit between the lower and middle tranches was set at 20 €
because we assume that nuclear power plants were offering to
sell their production at prices between 0 € and 20 € per MWh.
Similarly as the average strike price for thermal plants was 73
€ the threshold between the middle and upper tranches was
set at 100 €.
Simulating the Demand Side
The procedure for simulating the demand is split into two
stages. The first stage simulates the ordinary demand (i.e.,
excluding the part due to EVs). In the second stage the
demand due to the EV was evaluated and added to the
ordinary demand. In the first stage, the typical consumption
pattern for France was computed for each 1-hour time slice on
924
weekdays by averaging the consumption for three consecutive
years starting in October 2005 and ending in September 2008,
after rescaling to have the same average value in winter.
(Otherwise they would not be comparable.) This gives a
smoothed typical pattern. The variability around the mean
was also computed. Then using these statistics and the
expected annual increase for the next 15 years [1] we
simulated the consumption for France for each 1-hour time
slice. To compute the aggregate curve of offers to buy
electricity in the future, the curves in the reference year were
rescaled in proportion to simulated consumption for France as
a whole.
The second step consists of evaluating the demand due to the
EVs for the two scenarios for recharging the batteries. In the
first scenario, the batteries are recharged at a rate of 2.5 kW
per hour from midnight till 7 AM and from 9 PM till midnight.
In the second, V2G scenario, power is drawn from the
batteries at a rate of 1 kV per hour from 9 AM until 4 PM, and
consequently to compensate for this the batteries are
recharged at 3.2 kW per hour instead of 2.5 kW per hour. The
total quantity required is computed by multiplying the rate by
the total number of EVs in service and is then added to the
offers to buy if the batteries are being charged. Otherwise it is
added to the offers to sell. In both cases it is treated as a price
inelastic order.
Results for the Year 2020
The day-ahead prices in 2020 were simulated for the two
recharging scenarios:
1. if EVS are introduced and the batteries are charged late
at night
925

2. if EVS are introduced and the batteries provide power to
the grid at peak periods as well as being charged late at
night (i.e., the V2G case).
for the most favorable and the least favorable scenarios for
the generation fleet (HHH and LLL), as a function of the
number of EVs in service in 2020. It is felt that the French
government's objective of having 2 million EVs on the roads
by 2020 may be too ambitious.
In each case, the offers to buy and sell electricity were
simulated, and the simulated day-ahead prices (and volumes)
were obtained from the intersection of the two curves. A total
of 50 simulations were run for all 24 hours per day for 260
weekdays. The results are presented for the 5th and 12th
hours, that is, from 4 AM to 4:59 AM and from 11 AM to 11:59
AM. These are denoted H5 and H12. The first one is off-peak;
the second corresponds to the midday peak in France. Figure
19.6 and Figure 19.7 present the simulated prices at H12 and
H5, respectively, for the 260 weekdays in 2020, for the most
favorable scenario (HHH) for one particular simulation out of
the 50 that were generated. The upper figure corresponds to
the first scenario without the V2G option, while the lower one
is for the V2G case. The solid line in each figure corresponds
to the case with no EVs, whereas the grey line corresponds to
the case where there are 2 million EVs.
926
Figure 19.6
The simulated prices at H12 for the most favorable scenario (HHH) for one
particular simulation out of the 50 that were generated, with the first case above
and the second (V2G) below. The solid lines correspond to the case where there
are no EVs, while the grey one corresponds to the case where there are 2
million EVs.
Figure 19.7
The simulated prices at H5 for the most favorable scenario (HHH) for one
particular simulation out of the 50 that were generated, with the first case above
and the second (V2G) below. The solid lines correspond to the case where there
are no EVs, while the grey lines correspond to the case where there are 2
million EVs.
Looking at these four figures it can be seen that
• The two sets of simulated prices (Figure 19.6) are
identical at H12, as expected, because no power is being
drawn from the batteries. So only one curve is apparent.
• The simulated prices for 2 million EVs (dotted line,
Figure 19.6) are lower than those for no EVs (solid line) at
H12, as expected because power is being supplied from the
batteries of the EVs to the grid.
• As is usual for electricity, price spikes occur when the
system as a whole is stressed. One price peak occurred at
H12 in the simulation.
927
• The simulated prices for 2 million EVs (grey line, Figure
19.7) are higher than those for no EVs (solid line) at H5, as
expected.
• The striking feature in Figure 19.7 is the number of days
when the price hits the technical ceiling (3000 €), which is
a sign of market curtailment (see Box 19.1 for details). This
corresponds to a situation of stress—usually because the
demand is much greater than the supply, but occasionally
because the supply is much greater than the demand.
While plotting the simulated prices for a single realization
provides interesting insights, the statistics over all 50
simulations give a more complete view. Figure 19.9a and
Figure 19.9b presents the average simulated day-ahead price
for off-peak periods (Figure 19.9a) and for peak hours (Figure
19.9b) for summer and winter, as a function of the number of
EVs, for the pessimistic generation case LLL. The solid line
corresponds to the V2G case. Note that the average drops
during peak periods in summer and winter, but that it rises
rapidly during peak hours both in winter and in summer. The
average price is above 150 euros in off-peak periods in winter
and above 300 euros in summer for the V2G case. The results
for the optimistic generation scenario HHH are very similar to
these. As the striking feature in Figure 19.7 is the number of
days when the price hits the technical ceiling (3000 €), we
also computed the average number of days when this
occurred in the simulations as a function of the number of
EVs (Table 19.3 and Table 19.4).
928
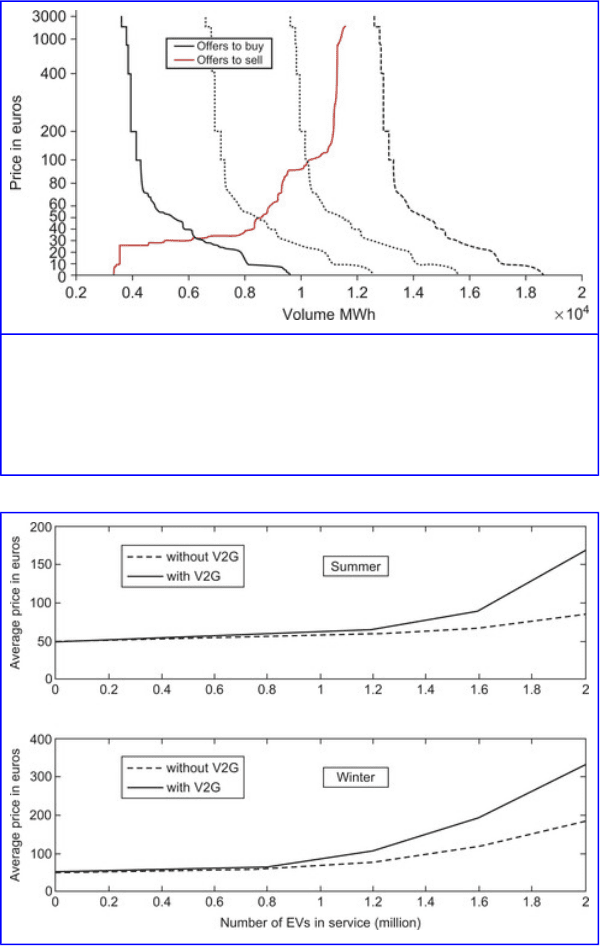
Figure 19.8
The original offers to buy and to sell power in the reference year, plus three sets
of offers to buy obtained by successively increasing the amounts. Note market
curtailment occurs in the last case.
929
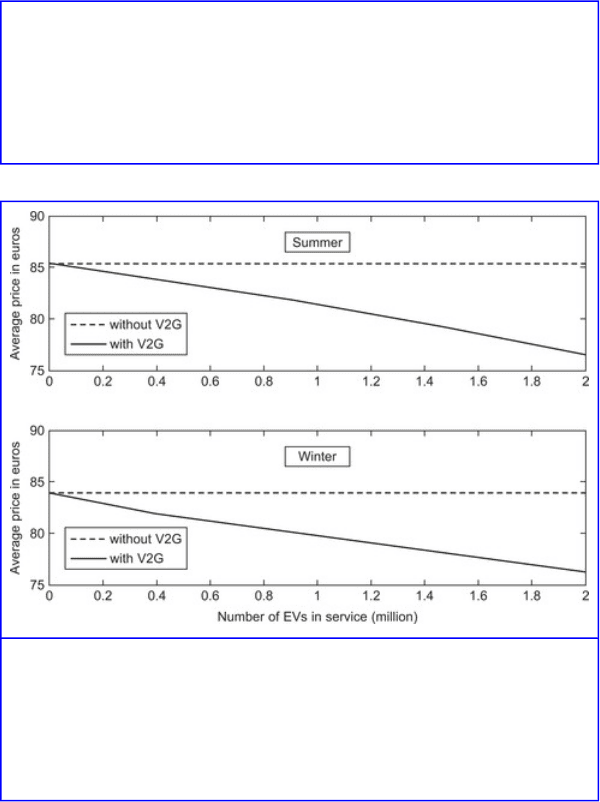
Figure 19.9a
The average off-peak price in summer (above) and winter (below) as a function
of the proportion of power needed for the EVs that transits via the bourse. The
solid line corresponds to recharging scenario N°2 (with V2G), while the dotted
one corresponds to recharging scenario n°1.
Figure 19.9b
The average peak hour price in summer (above) and winter (below) as a
function of the proportion of power needed for the EVs that transits via the
bourse. The solid line corresponds to recharging scenario N°2 (with V2G),
while the dotted one corresponds to recharging scenario n°1.
930