Sioshansi F.P. Smart Grid: Integrating Renewable, Distributed & Efficient Energy
Подождите немного. Документ загружается.

in various ways, including adding up to obtain total
utility-level load impacts.
The regression models assume that customers' hourly loads
may be explained as functions of weather data; time-based
variables such as hour, day of week, and month; and program
event information (e.g., the days and hours in which events
were called).
10
We also interact event indicator variables
with hourly indicator variables to allow estimation of hourly
load impacts for each program event in 2009. The resulting
equations contain as many as several hundred variables.
Automated software procedures allow recovery of key
coefficients and their use in post-processing of results.
Implicit “reference loads,” which represent the load that
would have occurred had an event not been called, may be
estimated as the sum of the observed load on an event day and
the estimated hourly load impacts from the regressions. The
estimated load impacts may then be converted to percentage
terms by dividing the load impact by the reference load.
10
A detailed description of the typical regression equation is provided in an
appendix to this chapter.
Estimated CPP Load Impacts
Load impacts were estimated for each hour of each CPP event
at PG&E, SCE, and SDG&E. The following tables and
figures summarize the estimated load impacts at each utility
at various levels of detail. We first report overall average
event-hour CPP load impacts and percentage load impacts for
each of the utilities. Then, for each utility individually, we
provide estimates of average hourly load impacts by industry
type for the average event, a figure showing the degree of
consistency of total load impacts across events, and a figure
601

showing hourly loads and load impacts for the average event.
We next present two sets of results specific to the SDG&E
default tariff. Finally, we investigate the extent to which CPP
load response is concentrated in a relatively few customers.
Overall Program Load Impacts
Table 12.3 summarizes the number of participating customer
accounts, the average event-hour estimated reference and
observed loads, and estimated load impacts for the average
CPP event at each of the three utilities.
11
Also shown are
load impacts as a percent of the estimated reference loads,
which ranged from 3 to 19%,
12
and average event-hour load
impacts per customer, which were 13, 52, and 15 kW for
PG&E, SCE, and SDG&E, respectively. Overall
program-level estimated load impacts for 2009 averaged 8.4
MW (3.3% of the reference load) across PG&E's 12 CPP
events, 24.6 MW (18.9%) for SCE's 12 events, and 23.3 MW
(5.6%) for SDG&E's 8 events.
11
Note that the numbers of enrolled customer accounts in Table 12.3 do
not match the enrollments in Table 12.1 exactly. Table 12.1 summarizes
the characteristics of customers enrolled at the time of any event day in
2009, while Table 12.3 shows the average across event days of the
number of customers enrolled at the time of each event.
12
The relatively larger percent load response by SCE customers is due to
the price responsiveness of those customers enrolled in the alternative
CPP rate option described above, which had a much higher CPP price
than the prices offered by the other utilities, in return for a more highly
discounted summer demand charge. The rate attracted a number of large
manufacturing customers.
602

Table 12.3
Average Event-Hour CPP Loads and Load Impacts, by Utility Average Event
Utility
Customer
Accounts
Estimated
Reference
Load (MW)
Observed
Load
(MW)
Estimated
Load
Impact
(MW)
%
Load
Impact
Estimated Load
Impact per
Customer (kW)
PG&E 642 256 247 8.4 3.3% 13
SCE 476 130 106 24.6 18.9% 52
SDG&E 1,576 419 396 23.3 5.6% 15
Source: Braithwait et al. [5].
Estimated Load Impacts by Utility
PG&E
Table 12.4 shows the distribution of estimated reference
loads, observed loads, and load impacts (averaged across all
event days), in levels and percentages, by industry group, for
PG&E. The Manufacturing; Retail stores; and Offices, Hotels,
Health, and Services industry types provided the largest load
impacts, while Retail stores provided the largest percentage
load impacts.
Table 12.4
Average Event-Hour CPP Load Impacts (kW)—by Industry Type (PG&E)
Industry Group Count
Estimated
Reference Load
(kW)
Observed
Load
(kW)
Estimated
Load Impact
(kW)
% LI
1. Agriculture,
Mining &
Construction
39 4,021 3,760 261 6.5%
2. Manufacturing 164 87,055 83,351 3,704 4.3%
3. Wholesale,
Transport, Other
Utilities
67 15,696 15,074 621 4.0%
Source: Braithwait et al. [5].
603

4. Retail stores 42 11,253 9,802 1,451 12.9%
5. Offices, Hotels,
Health, Services
124 85,522 84,105 1,416 1.7%
6. Schools 158 26,765 26,765 0 0.0%
7. Gov't,
Entertainment,
Other Services
48 25,601 24,642 959 3.7%
Total 642 255,913 247,499 8,414 3.3%
Source: Braithwait et al. [5].
Figure 12.2 reports average event-hour load impacts across
the six-hour event period for each of PG&E's 12 CPP event
days, as well as the average load impact across events. The
figure shows considerable variability of load impacts across
events. The mean value across events of the average hourly
load impacts was 8.4 MW, but load impacts ranged from 4.0
to 12.6 MW, with a standard deviation of 2.4 MW, or 29% of
the average value. These values represent percentage load
impacts that range from about 1.7% to 4.5% of the reference
load, which averaged 256 MW across the event period.
13
The
Manufacturing; Retail; and Offices, Hotels, Health, and
Services industry types provided the largest load impacts,
while Retail stores provided the largest percentage load
impacts.
13
The reference load is our estimate of what the CPP customers' load
would have been if the event had not been called, and is based on
observed event-period loads and the estimated load impacts.
604
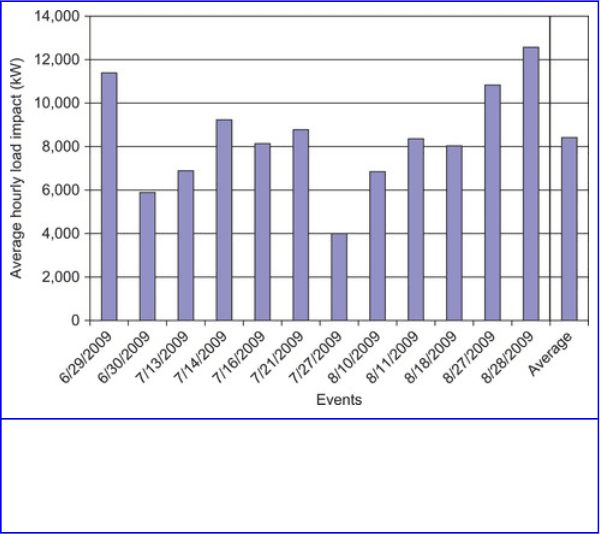
Figure 12.2
Average event-hour CPP load impacts by event—PG&E.
Source: Braithwait et al. [5]
Figure 12.3 illustrates the hourly pattern of loads and load
impacts, showing estimated reference load, observed load and
estimated load impact (right axis) for the average PG&E CPP
event. The large portion of CPP load accounted for by office
buildings produces a reference load for PG&E that has a
typical commercial customer load profile, peaking near
mid-day and falling off in the late afternoon. The CPP load
response takes a slice off of that load on event days,
producing load impacts that are reasonably constant across
the event period.
605
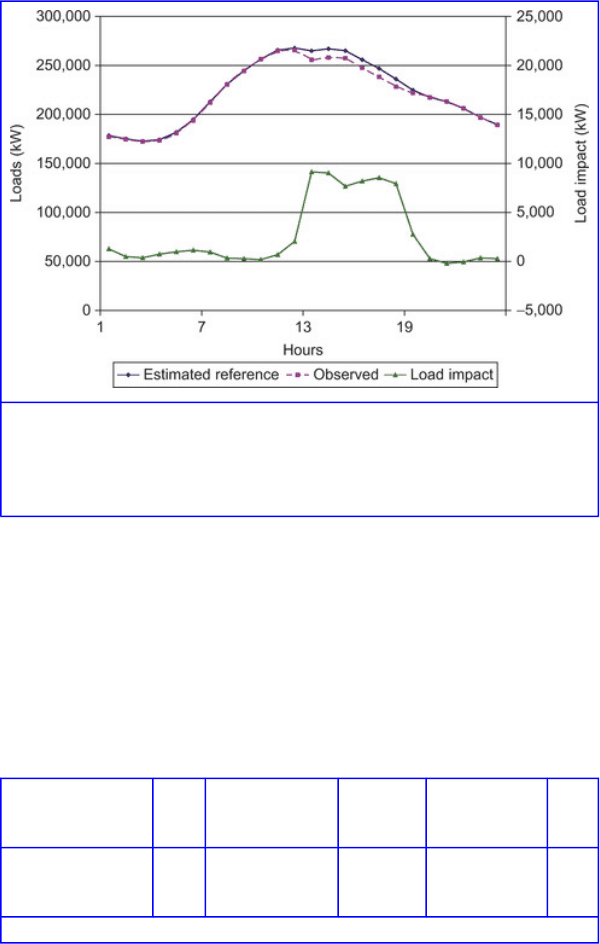
Figure 12.3
Hourly load impacts for average CPP event day in 2009—PG&E.
Source: Braithwait et al. [5]
SCE
Table 12.5 shows the distribution of average event-hour load
impacts across industry types for SCE's average event.
Manufacturing customers made up more than half of the total
reference load and accounted for the bulk of the load impacts.
Table 12.5
Average Event-Hour CPP Load Impacts (kW)—by Industry Type (SCE)
Industry Group Count
Estimated
Reference Load
(kW)
Observed
Load
(kW)
Estimated
Load Impact
(kW)
% LI
1. Agriculture,
Mining &
Construction
24 3,068 2,677 392 12.8%
Source: Braithwait et al. [5].
606

2. Manufacturing 217 65,767 48,020 17,747 27.0%
3. Wholesale,
Transport, Other
Utilities
53 16,791 12,490 4,302 25.6%
4. Retail stores 34 13,602 12,653 949 7.0%
5. Offices, Hotels,
Health, Services
44 9,564 8,957 607 6.4%
6. Schools 97 19,961 19,961 0 0.0%
7. Gov't,
Entertainment,
Other Services
8 1,614 965 649 40.2%
Total 476 130,367 105,722 24,645 18.9%
Source: Braithwait et al. [5].
The average estimated hourly load impacts across SCE's 12
CPP event days in 2009, shown in Figure 12.4, were quite
consistent, with an average hourly load reduction of nearly 25
MW, or about 19% of the estimated reference load.
Figure 12.4
607
Average event-hour CPP load impacts by event—SCE.
Source: Braithwait et al. [5]
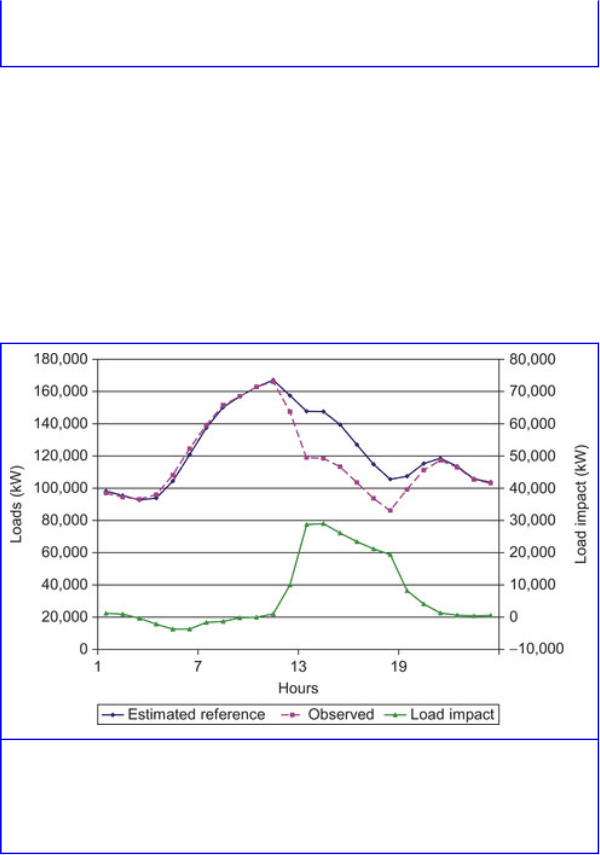
Figure 12.5 illustrates the patterns of the estimated reference
load, observed load, and load impacts for SCE's average CPP
event day. Note the substantial difference in the reference
load compared to that in Figure 12.3 for PG&E. The decline
in the reference load and load impacts during the afternoon
hours is due to the large share of load of manufacturing
customers on SCE's CPP rate, whereas PG&E's CPP rate has
a larger share of retail stores and office buildings.
Figure 12.5
Hourly load impacts for average CPP event day in 2009—SCE.
Source: Braithwait et al. [5]
608

SDG&E
Table 12.6 summarizes event-hour loads and load impacts by
industry type for the average SDG&E event. The largest load
impacts were provided by the Offices, Hotels, Health and
Services; and Wholesale, Transportation and Utilities (largely
water utilities) industry groups.
14
14
Note that the small negative estimated load impact for the “Other/
Unknown” industry group indicates that the regression models estimated
a higher than expected load on the average CPP event day. This is likely
the result of omitted variable bias in the regression model. That is,
customer loads are high on event days due to factors not included in the
regression model.
Table 12.6
Average Event-Hour CPP Load Impacts (kW)—by Industry Type (SDG&E)
Industry Group Count
Estimated
Reference Load
(kW)
Observed
Load
(kW)
Estimated
Load Impact
(kW)
% LI
1. Agriculture,
Mining &
Construction
19 4,835 3,760 1,075 22.2%
2. Manufacturing 220 59,506 56,533 2,973 5.0%
3. Wholesale,
Transport, Other
Utilities
265 49,186 42,773 6,412 13.0%
4. Retail stores 128 38,959 36,814 2,145 5.5%
5. Offices, Hotels,
Health, Services
480 180,185 172,249 7,937 4.4%
6. Schools 267 41,546 41,546 0 0.0%
7. Gov't,
Entertainment,
Other Services
190 44,020 41,268 2,752 6.3%
8. Other or
Unknown
7 617 653 –35 –5.7%
Source: Braithwait et al. [5].
609

Total 1,576 418,854 395,595 23,259 5.6%
Source: Braithwait et al. [5].
Like SCE, the average event-hour CPP load impacts at
SDG&E were reasonably consistent across the eight events
called in 2009, as shown in Figure 12.6
15
Load impacts
ranged from 19.8 MW to 29.3 MW across weekday events,
with a Saturday event on August 29 producing 19 MW. Load
impacts averaged 23.3 MW, or about 5.6% of the CPP
reference load. The load impacts were somewhat smaller than
average for the Saturday event and the two late-September
events. Load impacts were greatest (29.3 MW) on September
3, which was the SDG&E system peak day, as well as the
peak day for the state.
15
It should be noted that SDG&E allows joint participation in CPP and the
capacity bidding program (CBP) day-of (DO) program type. If CPP and
CBP-DO events are called on the same day, customer accounts that are
enrolled in both programs continue to face CPP prices on that day, and
do not receive energy credits for CBP load reductions. However, the
CPUC has ruled that for resource adequacy purposes, capacity-based
program load impacts receive a higher priority than those of
energy-based programs. Contemporaneous CPP and CBP-DO events
were called three times in 2009, on August 27, August 28, and
September 3. We estimate that those customer accounts that were
enrolled in both programs provided approximately 4 MW of average
hourly load impacts. Thus, from a resource adequacy perspective, the
estimated CPP load impacts on those three days should be reduced by
approximately 4 MW.
610