Seuront L. Fractals and Multifractals in Ecology and Aquatic Science
Подождите немного. Документ загружается.

264 Fractals and Multifractals in Ecology and Aquatic Science
Because the calculation of f(a (q)) from Equations (8.16) and (8.17) can be highly problematic,
Chhabra and Jensen (1989) developed a much simpler method for the calculation of f(a (q)) and a (q)
for multifractal structures as:
α
µδ µδ
δ
δ
()
(,)log ()
log
()
q
q
ii
i
N
=
=
∑
1
(8.18)
and
fq
qq
ii
i
N
(())
(,)log (,)
log
()
α
µδ µδ
δ
δ
=
=
∑
1
(8.19)
α(q)
f (α(q))
A
B
α(q)
f (α(q))
Binomial process
Cantor set
Heart failure
Healthy
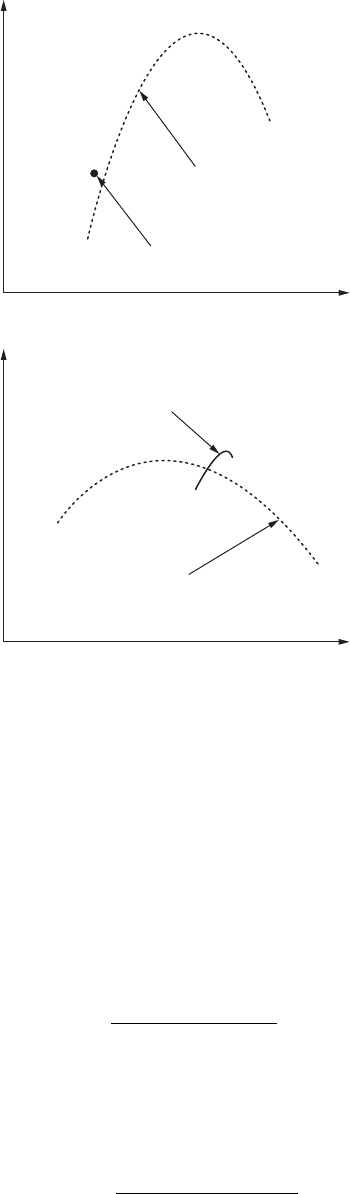
Figure 8.8 Schematic illustration of the multifractal spectrum f(a(q)) vs. a(q) for a fractal set and a simple
multifractal pattern (A), and for healthy and unhealthy heartbeat uctuations (B). The narrow range of a(q)
values for heart failure is indicative of monofractality. (Redrawn from Ivanov et al., 1999.)
2782.indb 264 9/11/09 12:15:31 PM
From Fractals to Multifractals 265
where the quantity
µδµδ µδ
δ
ii
q
i
N
i
q
q(,)()/ ()
()
=∑
=1
. The parameter q provides a scanning tool to scru-
tinize the denser and rarer regions of the measure m. For q > 1, regions where m has a high degree
of concentration are amplied, while for q < −1 regions with a small degree of concentration are
magnied. Finally, for q = 1, the measure itself is replicated; see Evertsz and Mandelbrot (1992) and
Chhabra and Jensen (1989) for further details. The function f(a (q)) thus gives the entropy dimension of
the distorted measure m(q, d) and characterizes the original measure m by analyzing the variation under
successive distortions driven by the parameter q. The singularity spectrum f(a (q)) takes its maximum
value for q = 0 and typically has a parabolic shape around this point (Figure 8.8). The number f(a (0)) =
a (0) = D(0) is the box dimension of the measure m, and the number f(a (1)) = a (1) = D(1) is the infor-
mation dimension. As an illustration, Figure 8.8A shows a comparison of the shapes of the singularity
spectrum f(a (q)) obtained from monofractal and multifractal sets, the Cantor set and a multiplicative
binomial process, respectively. Figure 8.8B illustrates how differences in the shape of the spectrum
f(a (q)) can be indicative of heart failure and then proposes an additional diagnostic tool.
8.2.2.2 application: temperature stress in the calanoid copepod Temora Longicornis
The swimming behavior of the calanoid copepod Temora longicornis (Figure 4.18A, Section
4.2.3.2.1) has been investigated under different conditions of temperatures representative of the
most extreme range of temperature that the species may encounter in its natural environment, that
is, from 4° to 28°C. T. longicornis were collected from the inshore waters of the eastern English
Channel using a WP2 net (200-μm mesh size) at a temperature of 16°C and a salinity of 32.5 PSU.
Specimens were diluted in buckets with surface waters, transported to the laboratory, and accli-
matized for 24 hours in 5-liter beakers lled with natural seawater. Prior to the experiments, adult
females (1.1 ± 0.1 mm, x¯ ± SD) were sorted by pipette under a dissecting microscope and left in
the behavioral container (a 2-liter, 20 × 20 × 5 cm Plexiglass container) lled with 0.45 μm ltered
natural seawater to acclimatize for 10 minutes at the experimental temperature (Seuront 2006). The
temperature treatments were randomized, and the resulting sequence of temperature treatments was
16, 8, 20, 4, 28, and 24°C. Groups of 5 individual females were considered for each temperature
treatment and their activity videotaped for 20 minutes.
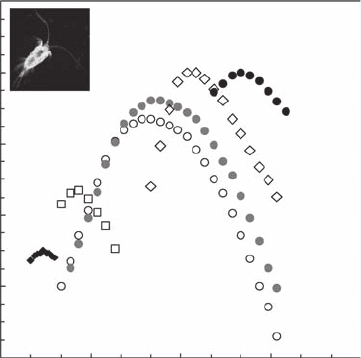
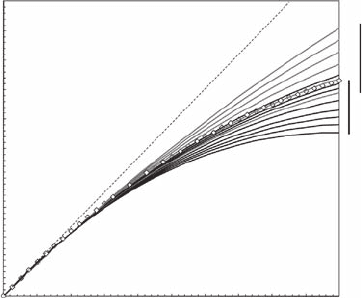
The function f(a (q)) obtained for the successive displacements of T. longicornis generally exhibits
the single-humped shape, typical of multifractal patterns (Figure 8.9). For extreme (low and high)
temperatures, f(a (q)) are narrower, suggesting monofractality (Figure 8.9). As previously stressed
(Section 8.2.1.2), this shift between multifractality and monofractality may reect perturbation of the
physiological control mechanisms of motion behavior.
8.2.3 co d i m E n s i o n Fu n c T i o n c(g ) a n d sc a l i n g mo m E n T Fu n c T i o n K(q)
Consider an intermittent quantity—for example, the turbulent kinetic energy dissipation rate e
l
(see
Figure 2.2 and Figure 8.1A)—where the subscript l refers to the scale ratio l = L/l where L and l are
the largest external scale and the resolution of the measurements, respectively. When l >> 1, inter-
mittency can be characterized by the statistical distribution of singularities (that is, intensities) g:
e
l
∝ l
g
(8.20)
and by the related probability density distribution (Schertzer and Lovejoy 1987):
Pr(e
l
≥ l
g
) ∝ l
−
c(g)
(8.21)
where c(g) is a codimension function characterizing the singularities distribution. c(g) can be expressed
as a generalization of Equation (2.12) following:
c(g ) = D
T
− D(g) (8.22)
2782.indb 265 9/11/09 12:15:33 PM
266 Fractals and Multifractals in Ecology and Aquatic Science
where D(g) characterizes the hierarchy of fractal dimensions associated with the different intermit-
tency levels. The codimension function c(g) diverges for high thresholds. This divergence is related
to the divergence of moments. The absolute slope of the algebraic tail of the probability density
distribution is directly related to the moment of divergence, q
D
, as:
Pr(e
l
≥ e
th
) ∝ e
th
−q
D
(8.23)
where e
th
is a given threshold. Note the similarity between Equations (8.23) and (5.4). This implies
that the typical signature of self-organized criticality (that is, Equation 5.4) may also be indicative
of multifractality.
Under fairly general conditions, the properties of the probability distribution of a random vari-
able are equivalently specied by its statistical moments. The latter corresponds to the introduction
of the scaling moment function K(q), which describes the multiscaling of the statistical moments of
order q of the eld e
l
:
〈(e
l
)
q
〉 ∝ l
K(q)
(8.24)
where “〈
.
〉” indicates statistical averaging.
The relation existing between the two scaling functions c(g) and K(q) reduces to the Legendre
transform (Parisi and Frisch 1985) for large-scale ratios (that is, l >> 1):
Kq qc cqKq
q
() max( ())()max (())=−⇔= −
γ
γγ γγ
(8.25)
Equation (8.25) implies that there is a one-to-one correspondence between singularities and orders
of moments: to any order q is associated the singularity g
q
that maximizes qg − c(g) and is the solu-
tion of c′(g
q
) = q
g
. Similarly to any singularity g is associated the order of moment q
g
that maximizes
1.1
0.9
0.7
0.5
0.3
0.1
1.2
0.9
0.6
0.3
0
f (α(q))
α(q)
Figure 8.9 Multifractal spectrum f(a(q)) vs. a(q) for the successive displacements female Temora longi-
cornis for different temperatures: 4°C (black diamonds), 8°C (open squares), 16°C (open dots), 20°C (gray
dots), 24°C (open diamonds), and 28°C (black dots). Note that the multifractal signature (the nonlinearity of
the function f(a(q)) over a range of a(q) values) is weakened for extreme temperatures.
2782.indb 266 9/11/09 12:15:36 PM
From Fractals to Multifractals 267
qg − K(q) and is the solution of K′(q
g
) = g
q
⋅
c(g) and K(q) exhibit several general properties of mul-
tifractals as convexity and nonlinearity. In particular, for conservative multifractal processes (that
is, 〈e
g
〉 = 〈e
1
〉, ∀l), since K(1) = 0 corresponds via the Legendre transform to the fact that the cor-
responding mean singularity of the process, C
1
= K′(1) is a xed point of c(g), the latter is therefore
tangential to the rst bisectrix line (c(g) = g) in g
1
= c(g
1
) = C
1
, hence c′(C
1
) = 1 (see Seuront et al.
1999, Figures 8, 9). The determination of the probability distribution would require the determina-
tion of moments at all scales. With the assumption of scaling, it reduces to the determination of
a hierarchy of exponents that remain nevertheless a priori innite, and therefore indeterminable,
especially for the highest orders, which correspond to the most extreme variability. However, in
the framework of universal multifractals (Schertzer and Lovejoy 1987), the calculation complexity
induced by the hierarchy previously described is included in two fundamental parameters, C
1
and
a, which describe the multiscaling behavior of the functions K(q):
Kq
C
qq
Kq Cq q
() ()
() ln()
=
−
−≠
=
1
1
1
1
α
α
α
αα
=
1
(8.26)
and c(g):
cC
C
cC
C
()
'
() exp
'
γ
γ
αα
α
γ
γ
α
=+
≠
=−
1
1
1
1
1
1
1
=
α
1
(8.27)
with
11
1
αα
+=
′
.
C
1
is the mean singularity of the process and also the codimension of the mean singularity;
it therefore measures the mean fractality of the process. It satises 0 ≤ C
1
≤ D
E
, where D
E
is the
Euclidean dimension of the observation space (for example, D
E
= 1 for time series and transects);
C
1
= 0 for a homogeneous process, and C
1
= d for a process so heterogeneous that the fractal dimen-
sion of the set contributing to the mean is zero. It then characterizes a mean inhomogeneity and can
be regarded as the measure of the sparseness of a given eld: the higher the C
1
, the fewer the eld
values corresponding to any given singularity. The index a, called the Lévy index, is the degree of
multifractality bounded between a = 0 and a = 2, which correspond respectively to the monofractal
model and to the lognormal model (see Section 8.3). It denes how fast the fractality is increasing
with higher and higher singularities: As a decreases, the high values of the eld do not dominate
as much as for larger values of a; there, the functions are larger deviations from the mean. As an
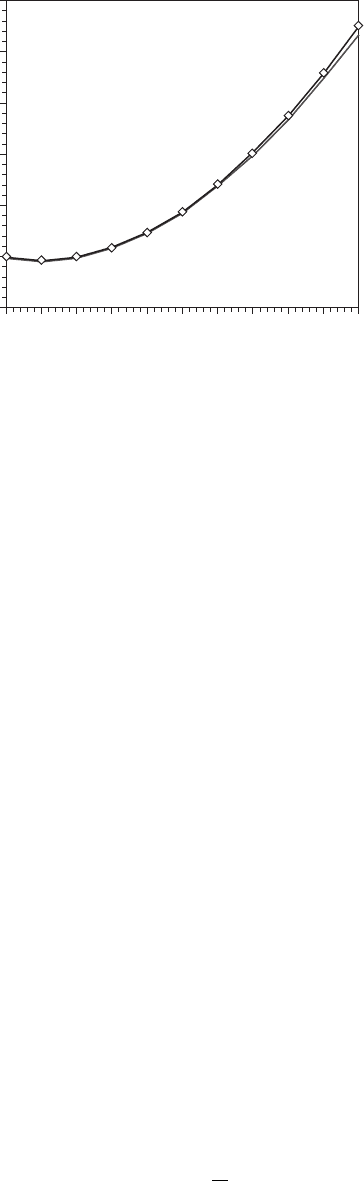
illustration, the functions K(q) estimated for the original time series of temperature, salinity, and in
vivo uorescence time series studied in Section 6.1.3.3 are shown in Figure 8.10. Finally note that
the functions K(q) relate to the generalized correlation function D(q) (Section 8.2.1) as:
Dq DKq
E
() ()=−
(8.28)
where D
E
is still the Euclidean dimension of the observation space.
Finally, even if the functions c(g) and K(q) were originally introduced in the framework of fully
developed turbulence, and as such illustrated above using the turbulent energy dissipation rate e
l
as
2782.indb 267 9/11/09 12:15:40 PM
268 Fractals and Multifractals in Ecology and Aquatic Science
an example, they can be applied to any intermittent eld f
l
. Also note that the eld f
l
relates to the
uctuations of a given quantity Q as:
ΔQ
l
∝
φ
λ
aH
l
(8.29)
where ΔQ
l
= |Q(x + l) − Q(x)| is the gradient of the quantity Q at scale l and H is the Hurst exponent
dened through structure function analysis; see Section 8.2.4. A direct consequence of Equation
(8.29) is that it is possible to obtain the eld f
l
directly from a scalar quantity Q through a fractional
differentiation of order H; see, for example, Schertzer et al. (1998) for further details. This is easy
to perform through a multiplication by k
H
in Fourier space, and strictly equivalent to power-law
ltering.
8.2.4 sT r u c T u r E Fu n c T i o n Ex p o n E n T s z(q)
8.2.4.1 theory
This analysis technique is devoted to the direct study of the multifractal properties of the uctuations
of any scalar eld S, and is based on the qth-order structure functions:
〈〉=〈 +− 〉∆SStSt
τ
τ
|( )()|
(8.30)
where for a given time lag t the uctuations of the scalar S are averaged over all the available values
(“〈
.
〉” indicates statistical averaging). For scaling processes, one way to statistically characterize
intermittency is based on the study of the scale-invariant structure exponent z(q) dened by the
following:
〈〉=〈 〉
() ()
()
∆∆SS
T
q
T
q
q
τ
ζ
τ
(8.31)
q
K (q)
1.0
0.8
0.6
0.4
0.2
0.0
–0.2
0.0 1.0 2.0 3.0 4.0 5.0
Figure 8.10 Functions K(q) estimated for the 172,800 data-point time series of temperature (black curve),
salinity (open diamonds), and in vivo uorescence (gray curve) studied in Section 6.1.3.3.
2782.indb 268 9/11/09 12:15:44 PM
From Fractals to Multifractals 269
where T is the largest period (external scale) of the scaling regime. The scaling exponent z(q) is
estimated by the slope of the linear trends of 〈(ΔS
t
)
q
〉 vs. t in a log-log plot. The rst moment z(1), char-
acterizing the scaling of the average absolute uctuations, corresponds to the scaling Hurst expo-
nent H = z(1), characterizing the degree of nonconservation of a given eld. The second moment is
linked to the power spectrum exponent b as:
b = 1 + z(2) (8.32)
For simple (monofractal) processes, the scaling exponent of the structure function z(q) is linear;
that is, z(q) = qH. In particular, z(q) = q/2 for Brownian motion, and z(q) = q/3 for nonintermittent
turbulence. For multifractal processes, this exponent is nonlinear and concave, and relates to the
function b = 1 + z(2) as:
ζ
() ()qqHKq=−
(8.33)
K(q) is then an intermittent correction, hence expresses the deviation of the function z(q) from lin-
earity due to intermittency. The different forms taken by the functions z(q) and K(q) are detailed in
Section 8.3.
The potential effect of varying turbulent forcings on the local structure of physical and bio-
logical parameters investigated in Section 6.1.3.3 has been specied through the analysis of the 24
time series of temperature, salinity, and in vivo uorescence with structure functions. The resulting
functions z(q) estimated for temperature, salinity, and uorescence are clearly nonlinear, showing
the multifractal nature of their distributions (Figure 8.11 and Figure 8.12). More specically, the
function z(q) estimated for the temperature and salinity time series remained the same across vari-
able turbulence and tidal conditions (Figures 8.11 and 8.12). In contrast, for a given turbulence level,
q
5.04.54.03.53.02.52.01.51.00.50.0
2.0
FT
ET
1.8
1.6
1.4
1.2
1.0
ζ(q)
0.8
0.6
0.4
0.0
0.2
Figure 8.11 Scaling function z(q) estimated for in vivo uorescence during the second half of ood tide
(FT: gray) and ebb tide (ET: black), compared to the statistically undistinguishable empirical exponents esti-
mated for temperature and salinity (open diamonds) and the theoretical homogeneous linear case z(q) = qH
(dashed line). It is clear from the nonlinearity of z(q) that phytoplankton distributions are far from being
homogeneously distributed, and in both tidal conditions patchiness increases with decreasing values of the
turbulent energy dissipation rates. The energy dissipation rates considered here from bottom to top are: 5.07
× 10
−7
, 1.11 × 10
−6
, 5.17 × 10
−6
, 1.43 × 10
−5
, 5.13 × 10
−5
, and 3.52 × 10
−4
m
2
s
−3
during ebb tide, and 2.60 × 10
−7
, 1.07
× 10
−6
, 5.16 × 10
−6
, 1.24 × 10
−5
, 6.32 × 10
−5
, 1.05 × 10
−4
, and 2.98 × 10
−4
m
2
s
−3
during ood tide. (Modied from
Seuront, 2005b.)
2782.indb 269 9/11/09 12:15:48 PM
270 Fractals and Multifractals in Ecology and Aquatic Science
phytoplankton biomass was always more patchy during the second half of ebb tide than during
the second half of ood tide (Figure 8.11), suggesting more patchiness in inshore than in offshore
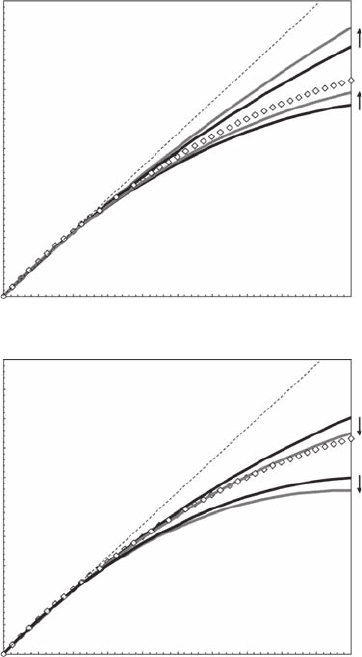
waters. The difference between the function z(q) estimated during ood tide (Figure 8.12A) and
ebb tide (Figure 8.12B) indicates that for the same range of turbulence intensities phytoplankton
patchiness decreased during the ood tide (Figure 8.12A) and increased during the ebb tide
(Figure 8.12B). In addition, phytoplankton patchiness was higher at the beginning of the ebb
tide than at the beginning of the ood tide (Figure 8.12). This is indicative of mixing between
inshore and offshore water masses during the transition between ood and ebb tides. Flood and ebb
tide phytoplankton populations can nevertheless exhibit very similar levels of patchiness (for exam-
ple, for the highest and lowest turbulence conditions considered for ood and ebb tides, respectively,
A
B
2.0
1.8
1.6
1.4
1.2
1.0
0.8
0.6
0.0 0.5 1.0 1.5 2.0 2.5
q
3.0 3.5 4.0 4.5 5.0
0.4
0.2
0.0
ζ
FT
(q)
2.0
1.8
1.6
1.4
1.2
1.0
0.8
0.6
0.0 0.5 1.0 1.5 2.0 2.5
q
3.0 3.5 4.0 4.5 5.0
0.4
0.2
0.0
ζ
FT
(q)
Figure 8.12 The scaling function z(q) estimated for in vivo uorescence during the rst and second half of
ood tide (A) and ebb tide (B) over the same range of turbulence intensities. During the rst and second half
of ood tide, dissipation rates range respectively from 1.54 × 10
−7
to 2.55 × 10
−4
m
2
s
−3
(from top to bottom:
black) and from 2.60 × 10
−7
to 2.98 × 10
−4
m
2
s
−3
(from top to bottom: gray). During the rst and second half
of ebb tide, dissipation rates range from 1.91 × 10
−7
to 3.06 × 10
−4
m
2
s
−3
(from top to bottom: black) and the
second half of ebb tide for dissipation rates ranging from 5.07 × 10
−7
to 3.52 × 10
−4
m
2
s
−3
(from top to bottom:
gray). The statistically undistinguishable empirical exponents estimated for temperature and salinity (open
diamonds) and the theoretical homogeneous linear case z(q) = qH (dashed line) are shown for comparison.
The vertical arrows indicate the shift in phytoplankton patchiness between the rst and second half of ood
and ebb tide. (Modied from Seuront, 2005b.)
2782.indb 270 9/11/09 12:15:50 PM
From Fractals to Multifractals 271
in Figure 8.11). Finally, phytoplankton distributions were more and less patchy than would be a
purely passive scalar in ebb and ood tide conditions, respectively. The gradients observed in the
phytoplankton concentrations were thus higher and lower than temperature and salinity gradients in
ebb and ood tide conditions, respectively, whatever the intensity of turbulence. As a consequence,
inshore and offshore phytoplankton populations must be respectively considered as more and less
homogeneously distributed than purely passive scalars. This is indicative of the predominant inu-
ence of the biological properties of phytoplankton cells on turbulence processes.
8.2.4.2 eulerian and lagrangian multiscaling relations
for turbulent Velocity and Passive scalars
8.2.4.2.1 Eulerian Multiscaling Relations for Turbulent Velocity and Passive Scalars
In Section 4.2.1.3, Eulerian and Lagrangian uctuations of turbulent velocity and passive sca-
lars were described under the homogeneity assumption (Kolmogorov 1941; Obukhov 1941, 1949;
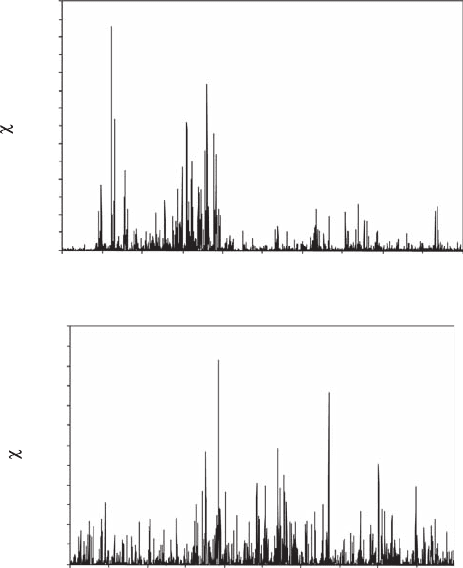
Corrsin 1951). However, the ux of energy e (Figure 2.2) and the ux of scalar variance c exhibit
sharp intermittent uctuations at all scales (Figure 8.13). More specically, Batchelor and Towsend
(1949) showed that instantaneous dissipation rates intermittently reached very high values and that
this intermittency was more important when the scale ratio, hence the Reynolds number, was large.
The original assumption of homogeneity then becomes untenable, and turbulent elds had to be
thought of as intermittent and scale-dependent processes. This led to the rened similarity hypoth-
esis (Kolmogorov 1962, Obukhov 1962), stating that velocity uctuations are inuenced by the
A
Time (seconds)
700
600
500
400
300
200
100
0
0 400 1200800 1600 2000
Time (seconds)
0 400 1200800 1600 2000
B
600
500
400
300
200
100
0
l
l
Figure 8.13 Time series of the variance uxes c
l
estimated from time series of (A) temperature (×10
−6
°C
2
s
−1
)
and (B) in vivo uorescence (uorescence
2
s
−1
) recorded in the inshore waters of the eastern English Channel
with a Sea-Bird Sealogger CTD and a Sea Tech uorometer, respectively. (Modied from Seuront, 2008.)
2782.indb 271 9/11/09 12:15:53 PM

272 Fractals and Multifractals in Ecology and Aquatic Science
local value of the dissipation averaged over a distance l, e
l
. The “rened similarity hypothesis”
(Kolmogorov 1962, Obukhov 1962) then leads to the introduction of the subscript l in Equations
(4.19) and (4.20) that now read:
ε
l
l
V
l
≈
()∆
3
(8.34)
and
χ
l
ll
SV
l
≈
()()∆∆
2
(8.35)
A lognormal distribution was originally introduced for e
l
(Kolmogorov 1962, Obukhov 1962),
leading to describe all the statistics of a turbulent eld with only two parameters, the mean and
the variance. However, since the use and the relevance of second-order statistics can be restric-
tive and characterizes intermittent uctuations very poorly, the velocity structure functions were
introduced in order to study the statistical properties of turbulence (Monin and Yaglom 1975) (see
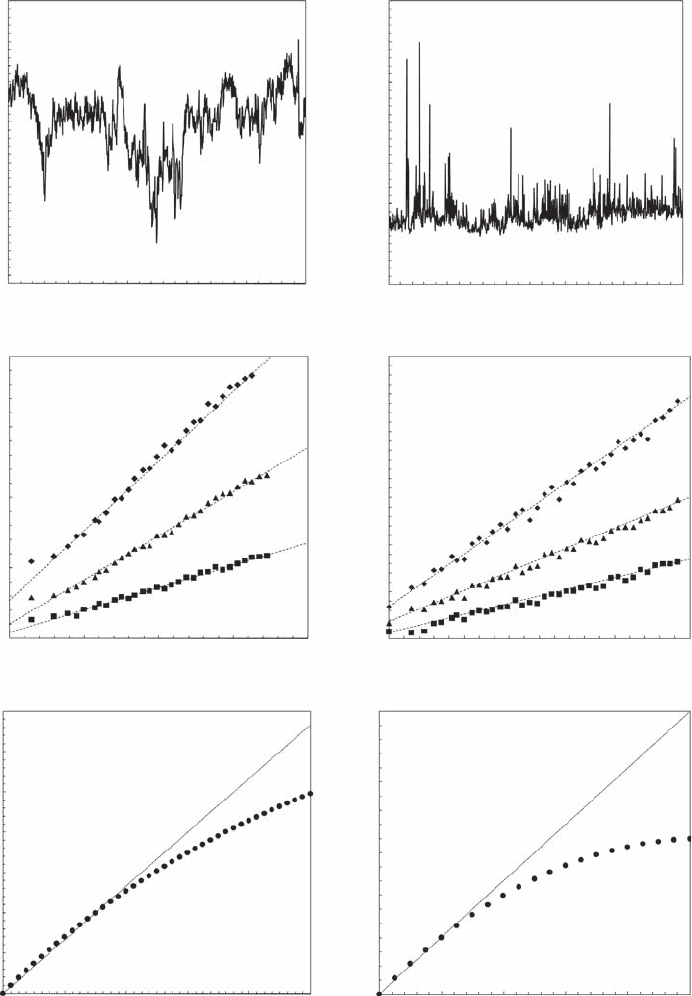
Section 8.2.4.1). Figure 8.14 illustrates the structure function analysis of turbulent velocity uctua-
tions (Figure 8.14A) and oceanic in vivo uorescence uctuations (Figure 8.14D). Figure 8.4B,E
show the scaling of the structure functions for various orders of moments: In a log-log plot, the
straight lines provide estimates of z
V
(q) and z
S
(q). The functions z
V
(q) and z
S
(q) are clearly non-
linear and convex (Figure 8.14C,F), and strongly diverge from the theoretical shapes z
V
(q) = q/3
(Figure 8.14C) and z
S
(q) = qH (Figure 8.14F).
Note that the structure functions of turbulent velocity and passive scalar uctuations are directly
related to the probability density function (PDF) of the local dissipation rate e
l
and variance ux c
l
.
A proper model for the PDF of e
l
and c
l
is then sufcient to describe the whole statistics of turbulent
velocity. The prediction of the original lognormal proposal is in reasonable agreement with empiri-
cal data for statistical moments q of sufciently low order (that is, q ≤ 10). For large order (q > 10),
the discrepancies are attributed to the deciencies in the lognormal assumption, which has been
severely criticized (Mandelbrot 1974, 1976; Yamazaki 1990; Frisch 1996). Another consequence
of intermittency is the introduction of an intermittent correction to the Kolmogorov spectral slope,
the intermittency exponent m, which is intrinsically linked to the distribution chosen for e
l
and c
l
(Seuront et al. 2005). This issue will be thoroughly investigated in Section 8.3.2 in relation to the
different models used to t the empirical function z(q).
In cascade models of turbulence, the intermittent uxes e
l
and c
l
result from a multiplicative
process in which the variability builds up from large to small scales. This leads to multifractal elds
with (Seuront and Schmitt 2005a):
〈〉≈≈
−
()
() ()
ελ
εε
l
q
Kq Kq
l
(8.36)
〈〉≈≈
−
()
() ()
χλ
χχ
l
q
Kq Kq
l
(8.37)
〈〉≈≈
−
||
() ()
∆Vl
l
q
qq
VV
λ
ζζ
(8.38)
〈〉≈≈
−
|( )|
,,
() ()
∆∆SV l
ll
q
qq
VS VS
2
33
λ
ζζ
(8.39)
2782.indb 272 9/11/09 12:15:58 PM
From Fractals to Multifractals 273
A
B
E
CF
q
D
IFV
V (cm s
–1
)
Time
Log t Log t
11.3
11.2
11.1
11.0
10.9
10.8
10.7
10.6
6.0
5.0
4.0
3.0
2.0
1.0
0.0
0
1 234
q
0
1 23 54
2.0
2.0
1.5
1.0
0.5
0.0
ζ (q)
ζ (q)
0.0
3.5
3.0
2.5
1.5
1.0
0.5
246 8 10
1.00.0–1.0–2.0
0
4.0
3.0
2.0
Log <(∆V
t
) q>
Log <(∆F
t
)q>
1.0
0.0
200 400 600 800 1000
Time
0 200 400 600 800 1000
34.5
34.3
34.1
33.9
33.7
33.5
33.3
33.1
Figure 8.14 Time series of grid-generated turbulent velocity recorded by hot-wire velocimetry at 100 Hz in
a circular ume (A) and in vivo uorescence (D) recorded in the coastal waters of the eastern English Channel.
The corresponding structure function analyses are shown in (B) and (E) for different values of q (q = 1, 2,
and 3 from bottom to top). The related structure functions exponents z(q) are clearly nonlinear and convex,
illustrating the intermittent nature of velocity and uorescence uctuations, shown in (C, F). The dashed lines
are the theoretical, nonintermittent exponents for turbulent velocity z(q) = q/3 (C) and uorescence z(q) = qH (F).
(Modied from Seuront, 2008.)
2782.indb 273 9/11/09 12:16:06 PM