Seuront L. Fractals and Multifractals in Ecology and Aquatic Science
Подождите немного. Документ загружается.

284 Fractals and Multifractals in Ecology and Aquatic Science
turbulent conditions. It is stressed here that Equation (8.83) does not involve any assumption on
phytoplankton concentration being considered as a passive conservative tracer or a biologically
active tracer. Equation (8.83) is instead general and would lead to a steepening of any power
spectrum due to intermittency correction, whether it follows a k
−5/3
power law or not.
It is nally stressed that the divergences observed between Franks’s conclusions (Franks 2005)
and those presented here might also stem from the differences in the approaches used. First, the
observational platforms used by Franks and coworkers (Franks 2005; Franks and Jaffe 2008) return
horizontal 32 × 32 cm 2D uorescence distributions sampled vertically every 6 to 24 cm, signi-
cantly different from the uorescence data analyzed here that correspond to a time series recorded
from a xed depth at a rate of 2 Hz. Second, Franks’s data were collected in stratied waters 250
to 450 m deep 10 km offshore of San Diego (California) where chlorophyll a concentrations were
typically bounded between 0.1 and 0.6 μg l
−1
(Franks and Jaffe 2008, Figure 2). In contrast, the data
analyzed here were collected in the tidally mixed shallow coastal waters of the eastern English
Channel where chlorophyll a concentrations ranged from 6 to 30 μg l
−1
. It is then likely that the dif-
ferent spectral shapes returned by the analysis of those two data sets might also be related to their
intrinsic differences. Unambiguously demixing apples and oranges in an intermittent context would
then require further work through a thorough investigation of data sets collected following the dif-
ferent methods described above simultaneously in a range of marine environments.
8.4.2 Fr E q u E n c y di s T r i b u T i o n s a n d mu l T i F r a c T a l i T y
As stressed above (Section 8.1.2) and as implicitly seen from the sets of equations dening
most of the multifractal functions described in Section 8.2—that is, Equations (8.3), (8.21), and
(8.23)—multifractal sets and signals will return a power-law behavior in cumulative frequency dis-
tributions (Chapter 5). However, a cumulative frequency distribution exhibiting a power-law behavior
does not mean that the process being analyzed is multifractal. This is illustrated through the cumu-
lative probability distribution function, P(X ≥ x) ∝ x
−f
, and the probability distribution function,
P(X = x) ∝ x
−m
, used to characterize intermittent distribution, when 1 < m ≤ 3 (see Section 5.1 and
Equations 5.1 and 5.2). As discussed in Section 4.2.10.2 and Section 8.2.4, both nonintermittently
and intermittently distributed quantities can be described by the qth-order structure functions. The
function z(q) is linear for monofractal processes, that is, z(q) = qH, where H is the Hurst exponent as
dened in Chapter 4. In the case of multifractality, z(q) is nonlinear, concave, and takes the general
form z(q) = Aq + Bq
a
(see Section 8.3.2.2 and Equation 8.72). For a Lévy distribution, the structure
function exponent z(q) is dened as a bilinear model (Chechkin and Gonchar 2000; Nakao 2000):
z(q) = q/m (8.84)
for q < m (that is, q < f + 1), and
z(q) = 1 (8.85)
for q ≥ m (that is, q ≥ f + 1). In the special case of a Lévy ight, m = 2 (Shlesinger et al. 1996),
leads to z(q) = q/2 for q < 2, and z(q) = 1 for q ≥ 2. The cumulative probability distribution func-
tion estimated from a time series of the successive displacements of the calanoid copepod Temora
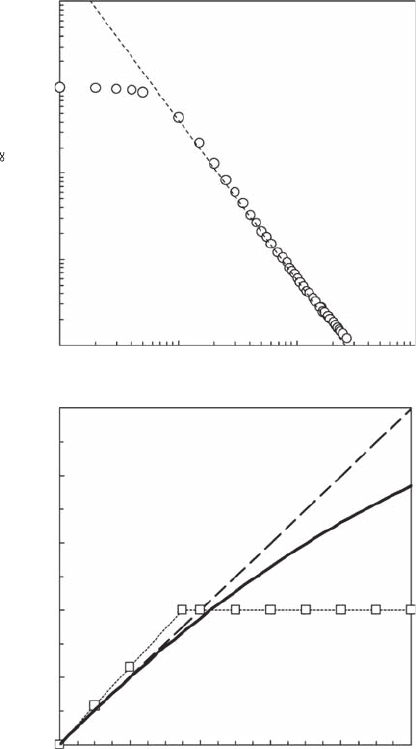
longicornis (Figure 8.2A) clearly exhibits a power-law behavior with f = 2.74 (Figure 8.17A); that
is, m = 1.74. The empirical function z(q) obtained from T. longicornis successive displacements is
subsequently compared with the functions z(q) theoretically expected for a Brownian motion and a
Lévy distribution characterized by m = 1.74 (Figure 8.17B). The nonlinearity of the empirical func-
tion clearly contrasts from the bilinear behavior related to Equations (8.84) and (8.85), showing that
a power-law signature in frequency distributions does not imply multifractality. In contrast, multi-
fractality is consistently related to a power-law signature in frequency distributions.
2782.indb 284 9/11/09 12:16:54 PM
From Fractals to Multifractals 285
8.5 Joint multiFractals
8.5.1 J
o i n T mu l T i F r a c T a l mE a s u r E s
Joint multifractals have been introduced by Meneveau et al. (1990) to assess the degree of correla-
tion between two simultaneously recorded multifractal elds such as the intermittent uxes e
l
and
c
l
discussed above. To my knowledge, this approach has only subsequently been applied once to the
joint analysis of crop yield and terrain slope (Kravchenko et al. 2000).
A
x
B
q
543210
2.5
2.0
1.5
1.0
0.5
0.0
10
1
0.1
P(X ≥ x) x
–φ
ζ(q)
0.01
0.001
0.1 110 100
Figure 8.17 (A) The cumulative probability distribution function estimated from a time series of the succes-
sive displacements of the calanoid copepod Temora longicornis shown in Figure 8.2A. A power-law behavior
with f = 1.74 (dashed line) is clearly visible for displacements ranging from 1 to 30 mm. (B) The struc-
ture function exponents expected for a Brownian motion z(q) = q/2 (dashed line), a Lévy ight, z(q) = q/2 for
q < 2 and z(q) = 1 for q ≥ 2 (open squares), and the empirical z(q) estimated from a time series of the successive
displacements of the copepod Temora longicornis shown in Figure 8.2A.
2782.indb 285 9/11/09 12:16:56 PM

286 Fractals and Multifractals in Ecology and Aquatic Science
Consider two multifractal measures m
1
and m
2
. The partition function M
q
(d ) (Equation 8.5) can
be rewritten as a joint partition function M
q
1
q
2
(d ) as:
Mff
qq
qq
i
N
ii12
12
12
1
() [()] [()]
()
δδδ
δ
=
=
∑
(8.86)
where N(d ) is the number of boxes of size d,
f
i
i
N
11
() ()
δµδ
=∑
and
f
i
i
N
22
() ()
δµδ
=∑
; see Equation
(8.4). Note that when q
1
= 0 or q
2
= 0, Equation (8.86) reduces to Equation (8.5). As discussed for the
single partition function, low values of q
1
and q
2
characterize the low values of the rst and second
measures, while at high q
1
and q
2
the joint partition function depends mostly on high values of
m
1
and m
2
. From Equation (8.11), the mass exponent of order (q
1
, q
2
), t(q
1
, q
2
) comes from:
M
qq
qq
12
12
()
(,)
δδ
τ
∝
−
(8.87)
From Section 8.2.2.1, the Hölder exponents a
1
and a
2
of multifractal measures m
1
and m
2
come as:
α
µδ
δ
1
1
=
log()
log
(8.88)
and
α
µδ
δ
2
2
=
log()
log
(8.89)
where d is the box size. From Equation (8.15), it comes that the number of cells N
a
1
a
2
(d ) with a
singularity strength (that is, Hölder exponent) within the ranges [a
1
, a
1
+ da
1
] and [a
2
, a
2
+ da
2
]
respectively for the rst and second measure scales with d as:
N
f
αα
αα
δδ
12
12
()
(,)
∝
−
(8.90)
where f(a
1
, a
2
) is the joint singularity spectrum describing the abundance of cells with common
a
1
and a
2
values. The joint singularity spectrum f(a
1
, a
2
) and the joint mass exponent function t(q
1
, q
2
)
are connected via a double Legendre transform as:
α
τ
112
12
1
(,)
(,)
qq
dqq
dq
=
(8.91)
α
τ
212
12
2
(,)
(,)
qq
dqq
dq
=
(8.92)
f(a
1
, a
2
) = q
1
a
1
+ q
2
a
2
− t (q
1
,q
2
) (8.93)
2782.indb 286 9/11/09 12:17:04 PM

From Fractals to Multifractals 287
As discussed in Section 8.2.2.1, the maximum value of the joint multifractal spectrum f(a
1
, a
2
) is
reached when q
1
= 0 and q
2
= 0, in which case f(a
1
, a
2
) equals the box-counting dimension of the
geometrical support of the measures m
1
and m
2
.
Meneveau et al. (1990) rst illustrated the applicability of joint multifractals to joint lognormal
and binomial distributions, and simultaneous experimental distributions of turbulent shear and tem-
perature gradients. A decade later, joint multifractals were used to assess the links between crop
yield and topography, and allowed to differentiate yield distributions corresponding to eld loca-
tions with high slopes and to make inferences about slope distributions that affect grain the most
(Kravchenko et al. 2000). A more general procedure based on joint moments is proposed hereafter
to study the joint properties of two multifractal measures.
8.5.2 Th E gE n E r a l i Z E d co r r E l a T i o n Fu n c T i o n s
8.5.2.1 definition
The joint correlation functions using structure functions introduced by Seuront and Schmitt (2005a,
2005b) are a continuation and development of the early study by Meneveau et al. (1990). Their
approach provides estimates of the fractal dimension of mixed singularities, instead of the scale-
invariant moment functions suggested hereafter. Another major difference between their joint mul-
tifractal formalism and the one provided here is that they did not normalize joint moments, as seen
below, to provide joint correlations. As such, the joint correlation function introduced hereafter
can be thought of as a more intuitive approach and as a high-order generalization of the standard
correlation between two variables X and Y. Note that joint moments for scaling structure functions
have also been proposed in the eld of econophysics, to study correlations for multiple assets, in
order to characterize their return distributions; see, for example, Muzy et al. (2001). However, the
nal objective of such a study is portfolio optimization, which is different from our analysis of the
generalized correlation between two multifractal elds.
Instead of random variables X and Y, consider two stochastic processes (ΔX
t
) and (ΔY
t
) charac-
terized by their pth- and qth-order structure functions as 〈 |(ΔX
t
|
p
〉 ≈ t
z
X
(p)
and 〈 |(ΔY
t
|
q
〉 ≈ t
z
Y
(q)
. The
correlation between the two processes (ΔX
t
) and (ΔY
t
) then becomes a function of the scale and of
the statistical orders of moment p and q, expressed by the generalized correlation functions (GCF
hereafter) c(p, q) as (Seuront and Schmitt 2005a):
cpq
XY
XY
p
q
p
q
(,)
[|()||()|]
|( )| |( )|
=
〈∆ ∆〉
〈∆ 〉〈 ∆〉
ττ
ττ
µµτ
−rpq(,)
(8.94)
where for more generality we take p ≠ q and r(p, q) ≥ 0 (Seuront and Schmitt 2005a). The gener-
alized correlation exponents (GCE hereafter) r(p, q) are estimated as the slopes of the power-law
trends of c(p, q) vs. t in a log-log plot, and expressed as
rpqpqSpq
XY
(,)()()(,)=+−
ζζ
(8.95)
where z
X
(q) and z
Y
(q) characterize the multiscaling properties of the single uctuations 〈 |(ΔX
t
)|
p
〉 and
〈|(ΔY
t
|
q
〉, and S(p, q) characterizes the multiscaling properties of the joint uctuations 〈 |(ΔX
t
)|
p
|(ΔY
t
)|
q
〉.
Both c(p, q) and r(p, q) are generalizations of the standard correlation function. In the special case
p = q = 1, Equation (8.94) indeed recovers the standard expression of the correlation coefcient
between (ΔX
t
) and (ΔY
t
). GCF and GCE hence express the correlation between |(ΔX
t
)|
q
and |(ΔY
t
)|
q
,
2782.indb 287 9/11/09 12:17:06 PM
288 Fractals and Multifractals in Ecology and Aquatic Science
together with their scale and moment dependence. Note that at a given scale t, if the uctuations
of the stochastic processes (ΔX
t
) and (ΔY
t
) are independent, r(p, q) = 0 for any combination of p and q.
Increasing values of r(p, q) would thus characterize increasing dependence between |(ΔX
t
)|
p
and
|(ΔY
t
)|
q
. Note that while independence implies uncorrelation, uncorrelation does not imply indepen-
dence. Uncorrelation corresponds to the relation r(1, 1) = 0 and implies independence only in spe-
cial cases such as for Gaussian processes. In the general case, this is no longer true: Independence
between the stochastic processes means that r(p, q) = 0 whatever the values of p and q. Figure 8.18A
A
–2.8
–2.9
–3.0
Log c (p, 2)
–3.1
–3.2
0.0 0.5 1.0 1.5 2.0 2.5 3.0 3.5
0.022
0.02
0.018
0.016
0.014
0.012
0.01
0.008
0.006
0.004
0.002
0
5
4.5
4
3.5
3
2.5
2
1.5
1
0.5
0.511.5 2 2.5 3 3.5 4 4.5 5
Log τ
B
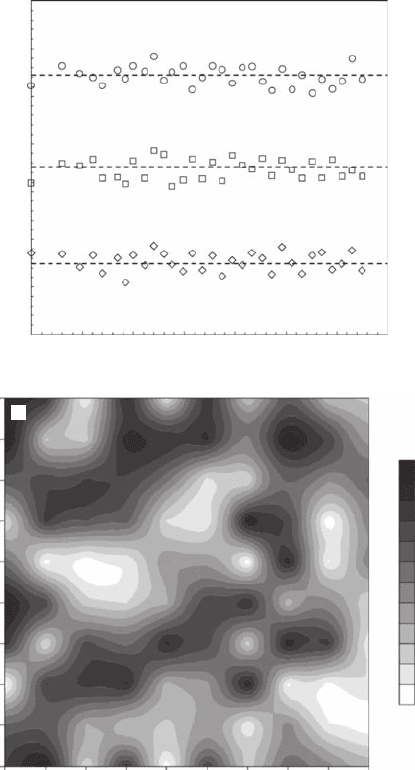
Figure 8.18 (A) The generalized correlation functions c(p, q) vs. the time scale t in log-log plots, for the
grid-generated turbulent velocity time series and the in vivo uorescence time series shown in Figure 8.14A,D,
respectively. The function c(p, q) shown here has been estimated for a constant value of the statistical order
of moment q of velocity uctuations (q = 2), and various values of the statistical order of moment p of in vivo
uorescence (that is, p = 1, 2, and 3, from bottom to top). The slopes of the linear regression estimated over the
scaling ranges (dashed lines) provide estimates of the generalized correlation exponents r(p, q) (B). (Modied
from Seuront and Schmitt, 2005a.)
2782.indb 288 9/11/09 12:17:09 PM

From Fractals to Multifractals 289
shows the GCF, c(p, q), plotted in log-log plots vs. t, for the grid-generated turbulent velocity
time series and the in vivo uorescence time series, respectively (shown in Figure 8.14A,D). As
these time series have been independently sampled, they represent an archetypical example of two
independent multifractal processes. The very low values taken by the functions c(p, q) indicate the
absence of any correlation between the turbulent velocity and uorescence uctuations, |(ΔV
t
)|
p
and |(ΔF
t
)|
q
. This is conrmed and specied by the related values of the function r(p, q), which
remain statistically undistinguishable from zero, whatever the combinations of p and q values
(Figure 8.18B); see Box 8.2.
The main advantages of this technique are that (1) it makes no assumptions about the spectrum
or the probability distribution of either data set, (2) it takes into account the multiscale intrinsic
properties of intermittent processes, and (3) it allows testing for the phenomenology responsible
for the high intensity (rare and unexpected) uctuations observed in intermittent distributions,
considering their potential association with both high- and low-intensity uctuations character-
ized by high and low orders of moment. The generalized correlation functions and exponents
thus provide a general framework, as they express the correlation between the elds (ΔX
t
) and
Box 8.2 GEnERALIZED CoRRELAtIon FunCtIonS AnD
ExPonEntS In SPECIAL CASES
The function c(p, q) and the related scaling exponent r(p, q) can be used as an analysis tool
to study the couplings between two multifractal elds x (x = ΔX
l
) and y (y = ΔY
l
). To provide
some basis for discussion and interpretation of experimental results, some limit cases are
considered.
If x and y are independent r(p, q) = 0. On the other hand, in case of perfect proportionality
x = Ky, where K is a constant, or for random proportionality x = ky, where k is a random vari-
able independent on y, it is readily seen that
rpqpqpq
YYY
(,) ()() ()=+−+
ζζζ
(8.B2.1)
In particular, one may note that r(p, q) > 0 due to the convexity of the scaling functions z(p).
This relation can be directly tested to verify the proportionality hypothesis. Furthermore, the
shape of the surface obtained is symmetric in the p-q plane. In this specic case, the function
r(p, q) has the desirable advantage to reduce considerably the number of data points—that is,
r(p, q) values—needed to understand the relationship between the elds x and y.
Another very simple situation occurs when x = Ky
b
with b > 0 and K constant, or when x =
ky
b
with k random and independent of y, then
r
Y
(,)()()( )pq bp qbpq
YY
=+−+
ζζζ
(8.B2.2)
r(p, q) in Equation (8.B2.2) is still positive but no longer symmetric in the p-q plane but in the
bp-q plane. The value of b may be rst estimated as the positive value such that
rp rbp(,0) (0,)=
(8.B2.3)
Using the values of b, this can be tested by verifying that r(p/b, q) is indeed symmetric in the
p-q plane. More generally speaking, the more r(p, q) is positive, the more the x = ΔX
l
and
x = ΔY
l
are dependent random variables.
2782.indb 289 9/11/09 12:17:13 PM
290 Fractals and Multifractals in Ecology and Aquatic Science
(ΔY
t
), together with their scale dependence and their moment dependence. This indicates if high-
intensity uctuations of one eld are highly correlated to low intensities of the other (or, in other
words, the gradients of two elds are proportional or inversely proportional) and the scales over
which these correlations occur.
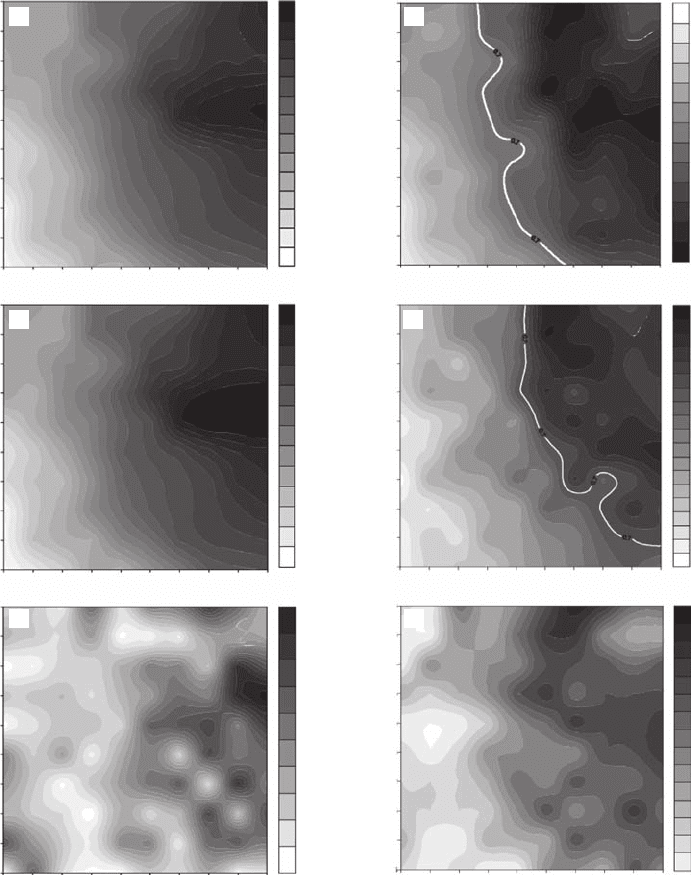
8.5.2.2 applications
The potential effect of varying turbulent forcing on the local structure of physical and biological
parameters has been investigated using structure function analysis in Section 8.2.4.1 on the basis
of 24 time series of temperature, salinity, and in vivo uorescence (Figures 8.11 and 8.12). Those
results demonstrated that temperature and salinity uctuations remained similar under different
turbulent and tidal forcings, while in vivo uorescence (that is, phytoplankton biomass) clearly
exhibited more intermittent uctuations during ebb tide than ood tide and under conditions of low
turbulence. However, this does not provide any information on the nature of biophysical couplings
and their relation to turbulence and tide. This issue is investigated here using the generalized cor-
relation functions and exponents introduced in Section 8.5.2.1.
The nature of the dependence between temperature and phytoplankton distributions has
been assessed through the generalized correlation functions, c(p, q) and the related generalized
correlation exponents, r(p, q), between temperature and uorescence time series, for each of
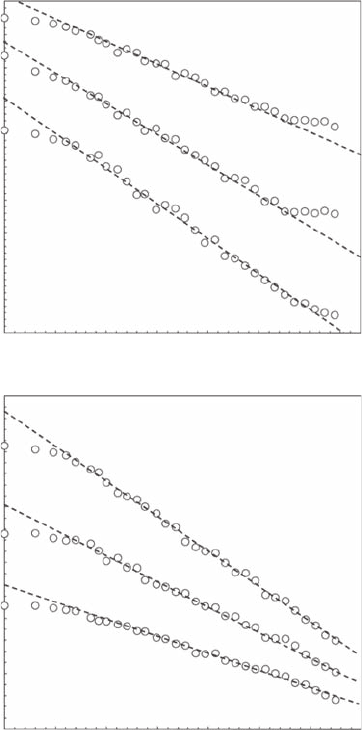
the 24 time series mentioned above. Figure 8.19 shows the GCF, c(p, q), plotted in log-log plots
versus the time scale t, for simultaneously recorded temperature and uorescence time series
for ebb tides (Figure 8.19A) and ood tides (Figure 8.19B), as well as for temperature and uo-
rescence time series taken at different moments of the tidal cycle, and a fortiori independent
(Figure 8.20A). Both the power-law behavior of the functions c(p, q) over the whole range of
available scales, and the positive values taken by the GCE, r(p, q), indicate a form of depen-
dence between temperature and uorescence uctuations. In addition, the values of the func-
tions c(p, q) are smaller during ood tide (Figure 8.19A) than during ebb tide (Figure 8.19B),
suggesting a differential correlation between temperature and phytoplankton biomass uctua-
tions controlled by tidal processes. On the other hand, the weak values taken by the functions
c(p, q) estimated between independent temperature and uorescence time series (Figure 8.20A)
indicate a low correlation between temperature and phytoplankton biomass uctuations, 〈(ΔT
t
)
p
〉
and 〈(ΔF
t
)
q
〉. This is conrmed by the related values of the functions r(p, q), which remain close
to zero, whatever the combinations of p and q values (Figure 8.20B).
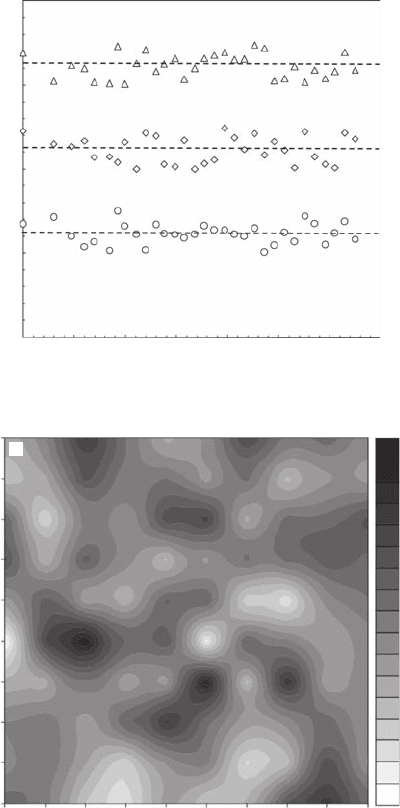
These observations were rened comparing the functions r(p, q) obtained between temperature
and uorescence time series in different tidal and turbulent conditions. Figure 8.21 shows the func-
tions r(p, q) obtained for all combinations of p and q values (between 0.5 and 5) with 0.1 increments
for three levels of turbulence (10
−4
, 10
−5
, and 10
−6
m
2
⋅s
−3
) during ebb and ood tides, respectively. In
both case, the correlation between temperature and uorescence uctuations increases with increas-
ing hydrodynamic conditions (Figure 8.21A,B,D,E) and is weaker, even nil, in low turbulent con-
ditions (Figure 8.21C,F). On the other hand, the decorrelation observed between temperature and
phytoplankton uctuations during both ebb and ood tides under weak turbulent conditions sug-
gests an increase in the biological contributions to the control of phytoplankton biomass distribution
and conrms previous observations (cf. Figure 8.12). Phytoplankton uctuations then appear inde-
pendent from the temperature uctuations under the lowest turbulence levels investigated here, that
is, 5 × 10
−7
m
2
⋅s
-3
(Figure 8.21C,F). This conrms the differential physical control suggested under
strong turbulent conditions from the analysis of the shape of the function z
F
(q), and its comparison
with the function z
t
(q) (see Figure 8.12).
More specically, the overall shape of the functions r(p, q) indicates that large phytoplankton
uctuations are associated, under strong enough turbulent conditions, to strong temperature gradi-
ents, and vice versa. This tendency seems to reect, over a slightly wider range of scales, ndings
2782.indb 290 9/11/09 12:17:14 PM
From Fractals to Multifractals 291
of Desiderio et al. (1993), who observed the occurrence of 0.1 to 0.2-meter-thick uorescent lay-
ers just above local temperature gradients. As this suggests a proportionality relationship between
temperature and phytoplankton uctuations, Equation (8.B2.2) has been veried testing the validity
of Equation (8.B2.3) over a wide range of b values (Box 8.2). Using b values ranging between 0.05
and 5 (with 0.05 increments), we then showed that Equation (8.B2.3) is veried for four of the six tur-
bulence levels investigated during ebb tides, i.e., e = 10
−4
m
2
⋅s
–3
with b = 0.90, e = 5 × 10
−5
m
2
⋅s
–3
with
b = 0.85, e = 10
−5
m
2
⋅s
–3
with b = 0.80, and e = 5 × 10
−6
m
2
⋅s
–3
with b = 0.78, and two of the six turbu-
lence levels investigated during ood tides, that is, e = 10
−4
m
2
⋅s
–3
with b = 0.96 and e = 5 × 10
−5
m
2
⋅s
–3
B
A
Log τ
Log c (2, q )
Log c (2, q)
0.0
0.6
0.4
0.2
0.0
–0.2
–0.4
–0.6
–0.8
–1.0
–1.2
–1.4
0.0 0.5 1.0 1.5 2.0 2.5 3.0 3.5
Log τ
0.0 0.5 1.0 1.5 2.0 2.5 3.0 3.5
–0.5
–1.0
–1.5
–2.0
–2.5
–3.0
Figure 8.19 The generalized correlation function c(p, q) vs. the time scale in log-log plots, for temperature
and uorescence time series simultaneously recorded during ebb tide (A) and ood tide (B). The function
shown here have been estimated for a constant value of the statistical order of moment q of temperature uc-
tuations (q = 2), and various values of the statistical order of moment p of in vivo uorescence (that is, p = 1,
2, and 3, from bottom to top). The slopes of the linear regression estimated over the scaling ranges (dashed
lines) provide estimates of the generalized correlation exponents r(p, q). (Modied from Seuront and Schmitt,
2005b.)
2782.indb 291 9/11/09 12:17:17 PM
292 Fractals and Multifractals in Ecology and Aquatic Science
with b = 0.91. Figure 8.22 shows the relation r(p, 0) vs. r(0, bp) corresponding to the functions
r(p, q) shown in Figure 8.21A,B with b = 0.90 and b = 0.80, respectively. The correlation shown
between temperature and phytoplankton uctuations under high turbulent conditions is then
related to a power-law dependence relationship of the form ΔF
t
∝
(ΔT
t
)
b
.
–1.80
–1.90
Log c (2, q)
–2.00
–2.10
–2.20
0.0
5
4
3
2
1
1 234
0.04
0.03
0.02
0.01
q (fluorescence)
p (temperature)
5
0.5 1.0
A
1.5 2.0
Log τ
2.5 3.0 3.5
B
Figure 8.20 The generalized correlation function c(p, q) vs. the time scale t in log-log plots, for tempera-
ture and uorescence time series simultaneously recorded at different moments of the tidal cycle, and a priori
independent (A). The function c(p, q) shown here have been estimated for a constant value of the statistical
order of moment q of temperature uctuations (q = 2), and various values of the statistical order of moment p of
in vivo uorescence (that is, p = 1, 2, and 3, from bottom to top). The slopes of the linear regression estimated
over the scaling ranges (dashed lines) provide estimates of the generalized correlation exponents r(p, q) shown
in (B). (Modied from Seuront and Schmitt, 2005b.)
2782.indb 292 9/11/09 12:17:19 PM
From Fractals to Multifractals 293
8.6 intermittency and multiFractals:
biological and ecological imPlications
Intermittency can have implications in a wide range of biological and ecological processes in
terrestrial and aquatic ecosystems. Based on the marine background of the author, this section
explores a few areas of marine sciences that could be signicantly affected by intermittency.
Specically regarding probabilistic arguments derived from the multifractal framework described
5
1.50
1.30
1.10
0.90
0.70
0.50
0.30
1.20
1.00
0.80
0.60
0.40
0.20
0.00
1.20
1.00
0.80
0.60
0.40
0.20
0.00
0.90
0.80
0.70
0.60
0.50
0.40
0.10
0.30
0.20
0.07
0.06
0.05
0.04
0.03
0.02
0.01
0.00
0.08
0.06
0.04
0.02
0.00
12345 12345
q (fluorescence) q (fluorescence)
p (temperature)
4
3
2
1
5
12345
p (temperature)
4
3
2
1
5
12345
p (temperature)
4
3
2
1
5
12345
p (temperature)
4
3
2
1
5
12345
p (temperature)
4
3
2
1
5
p (temperature)
4
3
2
1
D
A
E
B
F
C
Figure 8.21 The generalized correlation exponents r(p, q), shown as a function of both p and q, which char-
acterize temperature and in vivo uorescence uctuations, respectively. The functions r(p, q) correspond to
three different levels of turbulence:
e = 10
−4
m
2
⋅s
−3
(A,D), e = 10
−5
m
2
⋅s
−3
(B,E), and e = 10
−6
m
2
⋅s
−3
(E,F) inves-
tigated during ebb tide (left panel) and ood tide (right panel). (Modied from Seuront and Schmitt, 2005b.)
2782.indb 293 9/11/09 12:17:24 PM