Seuront L. Fractals and Multifractals in Ecology and Aquatic Science
Подождите немного. Документ загружается.

274 Fractals and Multifractals in Ecology and Aquatic Science
where the angle brackets “〈
.
〉” indicate ensemble averaging, λ the scale ratio between the largest external
scale L and the actual scale l (that is, λ = L/l), K
e
(q) and K
c
(q) the scaling moment functions for the uxes
e
l
and c
l
, and z
V
(q) and z
V,S
(q) the scaling moment functions of the velocity structure function and the
joint structure function scaling exponent of the product (ΔS
l
)
2
ΔV
l
. From Equations (8.34) and (8.35), the
functions K
e
(q) and K
c
(q) can be dened as:
Kq qq
V
ε
ζ
() ()=− 3
(8.40)
Kq qq
VS
χ
ζ
() ()
,
=− 3
(8.41)
Because the uxes are conserved by the equation of motion over the inertial subrange, they are
assumed to be scale-independent:
〈〉≈〈 〉
εε
l 1
(8.42)
〈〉≈〈 〉
χχ
l 1
(8.43)
Equations (8.36) and (8.37) subsequently lead to:
K
ε
()10=
(8.44)
K
χ
()10=
(8.45)
Such multifractal elds are called “conservative multifractals,” and the conservation of the uxes e
l
and c
l
(Equations 8.44 and 8.45) lead to:
ζ
V
()31=
(8.46)
ζ
VS,
()31=
(8.47)
Equations (8.46) and (8.47) correspond to the exact formulations for the small-scale dissipation
elds. The scaling moment functions K
e
(q), K
c
(q), z
V
(q), and z
V,S
(q) characterize all the uctuations
of the uxes of energy and scalar variance, and the uctuations of the velocity shear and scalar
gradient. In other words, as under fairly general conditions, the probability distribution of a random
variable is equivalently specied by its statistical moments, the scaling moment functions K(q) and
z(q) describe the scale dependence of the statistical moments of order q.
Equation (8.36) through Equation (8.39) characterize all the uctuations of the energy ux e
l
(Equation 8.34) and scalar variance ux c
l
(Equation 8.35) through the scaling moment functions
K(q) and z(q). The uctuations of a passive scalar are dened by the scaling moment function
z
S
(q) as:
〈〉≈
−
||
()
∆S
l
q
q
S
λ
ζ
(8.48)
However, because the passive scalar ux j
l
is a nonconservative mixed ux of energy e
l
and scalar
variance c
l
as:
ϕεχ
lll
=
−12 32//
(8.49)
2782.indb 274 9/11/09 12:16:14 PM

From Fractals to Multifractals 275
which are intrinsically correlated, the scaling moment function z
S
(q) is related to the structure func-
tion of velocity uctuations and scalar gradients as:
ζζ ζ
SVSV
qqq() (/)(/)
,
=−32 2
(8.50)
where z
V
(q) = q/3 + K
e
(q/6) − K
c
(q/2); see Seuront and Schmitt (2005a). Equations (8.35) and (8.49)
also lead to expressing the squared passive scalar uctuations, 〈ΔS
l
2
〉 = 〈(S
x+l
= S
x
)
2
〉, as:
〈〉≈∆Sl
ll
22323
ϕ
//
(8.51)
With the introduction of discrete and continuous cascade models, a wide variety of distributions
(including improvement of the initial lognormal proposal) has been proposed for e
l
and j
l
. A
brief review of the distributions found in the literature, and a test of their performance at tting
oceanic temperature uctuations (that is, a proxy for phytoplankton biomass), are proposed in
Section 8.3.3.
8.2.4.2.2 Lagrangian Multiscaling Relations for Turbulent Velocity and Passive Scalars
In an intermittent framework, the Lagrangian scaling relations given by Equations (4.25) and (4.26)
are rewritten as:
ε
t
l
V
t
≈
∆
2
(8.52)
and
χ
t
l
S
t
≈
∆
2
(8.53)
where
∆VV tV
t
=+− | ()()|
ττ
and
∆SStS
t
=+− | ()()|
ττ
are the velocity shear and passive scalar
gradients for an element of uid at the scale t. The scalar variance ux in Equation (8.53) does not
depend any more on a cross-product of velocity and passive scalar uxes as in the Eulerian frame-
work; see Equation (8.35). The related scaling relations then come as:
〈〉≈≈
−
()
() ()
ε
εε
t
q
Kq Kq
tΛ
(8.54)
〈〉≈≈
−
()
() ()
χ
χχ
t
q
Kq Kq
tΛ
(8.55)
〈〉≈≈
−
||
() ()
∆ΛVt
t
q
qq
VV
ζζ
(8.56)
〈〉≈≈
−
||
() ()
∆ΛSt
t
q
qq
SS
ζζ
(8.57)
2782.indb 275 9/11/09 12:16:21 PM

276 Fractals and Multifractals in Ecology and Aquatic Science
where Λ = T/t is the scale ration between the xed outer time scale T and the actual time scale t,
and the Lagrangian scaling moment functions for the velocity and passive scalar uxes K
e
(q) and
K
c
(q) are given by:
Kq qq
V
ε
ζ
() ()=− 2
(8.58)
Kq qq
S
χ
ζ
() ()=− 2
(8.59)
The uxes are still assumed to be conservative, that is, K
e
(1) = 0 and K
c
(1) = 0, which implies z
V
(2) = 1 and
z
S
(2) = 1 (Seuront et al. 1996b). As Equation (8.32) is still valid in the Lagrangian framework, there
is no intermittency correction for the second moment, corresponding exactly to a power spectrum
E(f) ≈ f
−2
. The difference in spectral slope can then be used to identify Lagrangian and Eulerian
regimes in oceanic data, as illustrated in Section 4.2.1.3.3 (Figure 4.10).
The Lagrangian velocity structure function scaling exponents z
V
(q) and the Lagrangian passive
scalar structure function scaling exponents z
S
(q) are estimated from Equations (8.56) and (8.57),
and are respectively given by:
ζ
ε
V
q
q
K
q
()=−
22
(8.60)
ζ
χ
S
q
q
K
q
()=−
22
(8.61)
where K
e
(q) and K
c
(q) are estimated from the intermittent eld e
t
and c
t
. The structure function
exponent z(q) estimated from the Lagrangian regime of the time series of temperature and salinity
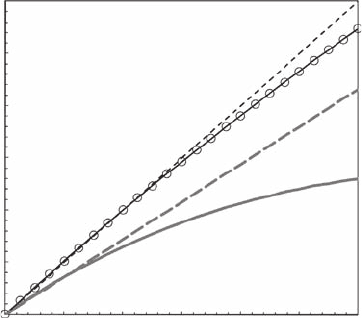
shown in Figure 4.10 exhibit a nonlinear signature indicative of multifractality (Figure 8.15).
8.3 cascade models For intermittency
8.3.1 h
i s T o r i c a l ba c k g r o u n d
The rst description of the turbulence cascade came with the intuitive scheme of Richardson (1922),
who recognized that “big whirls have little whirls that feed on their velocity, and little whirls have
lesser whirls and so on to viscosity” in the molecular sense. This was later formalized by the self-
similarity hypothesis (Kolmogorov 1941), which states that velocity uctuations between two points
separated by a distance l depend only on the average dissipation rate e. The squared velocity uctuation,
〈〉=〈 −〉
+
∆VVV
lxlx
22
[]
, thus writes as:
〈〉∝∆Vl
l
22323
ε
//
(8.62)
where x and x + l are two points separated by a distance l. In Fourier space, Equation (8.62) is strictly
equivalent to Equation (4.23) for turbulent velocity uctuations and Equation (8.51) to Equation (4.24)
for passive scalar uctuations. The generalized structure functions for moments of order q > 0 of the
absolute velocity increments are dened as:
〈〉∝||
//
∆Vl
l
qqq
ε
33
(8.63)
2782.indb 276 9/11/09 12:16:27 PM
From Fractals to Multifractals 277
Equation (8.63) leads to the K41 linear law (that is, nonintermittent, homogeneous turbulence):
z
V
(q) = q/3 (8.64)
where z
V
(q) is the scaling exponent of the velocity structure functions:
〈〉∝||
()
∆Vl
l
q
q
V
ζ
(8.65)
For any passive scalar advected by turbulent ows, Equation (8.51) rewrites as:
〈〉∝||
()
∆Sl
l
q
q
S
ζ
(8.66)
where z
S
(q) is the scaling moment function of scalar gradients; see Equation (8.50). Furthermore,
Equation (8.62) and Equation (8.63) lead to a general relationship between the spectral exponent b
and the second-order moment structure function exponent z(2):
b
i
= 1 + z
i
(2) (8.67)
where b
i
= b
V
for velocity uctuations (see Equation 2.5) and b
i
= b
S
for passive scalar uctuations
(see Equation 4.23), and z
i
(2) = z
V
(2) for velocity uctuations (see Equation 8.65) and z
i
(2) = z
S
(2)
for passive scalar uctuations; see Equation (8.66).
Kolmogorov (1962) and Obukhov (1962) took intermittency into account considering that the
structure function of velocity uctuations is a function of a locally averaged dissipation rate for a
q
6
2.5
3.0
2.0
ζ(q)
1.5
1.0
0.5
0.0
054321
Figure 8.15 Empirical values of the Lagrangian structure function exponents z(q) for temperature (black
continuous line) and salinity (open dots) time series recorded in the eastern English Channel from a drifting
boat 24.9 m long. The dotted black line is the theoretical exponents z(q) = q/2 expected in case of noninter-
mittent Lagrangian turbulence. The thick continuous line is the empirical Eulerian z(q) for temperature and
salinity estimated over Eulerian scales, and the thick dashed gray line the theoretical case z(q) = qH expected
in case of nonintermittent Eulerian turbulence, respectively.
2782.indb 277 9/11/09 12:16:31 PM

278 Fractals and Multifractals in Ecology and Aquatic Science
sphere of radius l, e
l
. They hypothesized that e
l
was lognormally distributed with the variance s
l
2
of log e
l
given by:
s
l
2
= A + m log(L/l) (8.68)
where A is a constant associated with the macrostructure of the ow, m a universal constant, and L
the largest external scale. This hypothesis has been introduced without rm theoretical foundations;
Kolmogorov (1962) did not provide any justication for this hypothesis, just stating that “it is natural
to suppose that.” Obukhov (1962) was more specic, indicating that the distribution of any positive
quantity should be approximated by a lognormal distribution with the appropriate values for the rst
and second moments. For velocity uctuations, Equation (8.63) can be rewritten as:
〈〉∝||
//
∆Vl
l
q
l
qq
ε
33
(8.69)
Equation (8.69) is also known as the rened similarity hypothesis (RSH). This leads to the nonlinear
form for the structure function exponent z
V
(q) characterizing intermittency.
8.3.2 ca s c a d E mo d E l s F o r Tu r b u l E n c E
Since the rst attempt to provide a quantitative description of the Richardson cascade was made
by Yaglom (1966) and Gurvich and Yaglom (1967), a range of discrete and continuous cascade
models have been introduced to describe intermittent uxes (see Seuront et al. [2005] for an
exhaustive review).
A rst family of models is composed of discrete models, for which the scale ratio between a
structure and the daughter structure is a discrete integer. Due to their discrete nature, these models
are not realistic but have been introduced for their simplicity and ability to reproduce experimental
intermittency. These models include the lognormal model, the mono-fractal β-model, the α-model,
the p-model, the random β-model, and the B-model. Detailed reviews of these models may be found
in Paladin and Vulpiani (1987), Meneveau and Sreenivasan (1991), Frisch (1996), and Seuront et al.
(2005). In addition, the limitations of these models and their limited ability to t experimental data,
especially for the higher orders of moment q, are detailed in Frisch (1996).
The continuous log-innitely divisible (log-ID) stochastic models represent a more realistic fam-
ily of cascade models. Specically, innite divisibility species that any random variable belonging
to this law may be written as a sum of an arbitrarily large number of independent random variables,
each having the same law (independent identically distributed) (see, for example, Feller, 1971).
This property intrinsically limits the number of probability laws; the most known ID laws are the
Gaussian, Lévy stable, Poisson, and Gamma. The corresponding log-ID continuous cascade models
for velocity uctuations and passive scalar uctuations are briey reviewed and their ability to t
the uctuations of oceanic in vivo uorescence (that is, a proxy of phytoplankton biomass) critically
assessed.
8.3.2.1 lognormal model
The lognormal model (Kolmogorov 1962; Obukhov 1962) corresponds to a quadratic form for z
V
(q)
and z
S
(q). For velocity uctuations, Equation (8.46) and the condition z
V
(0) = 0 lead to expressing
z
V
(q) as:
ζ
µ
V
q
qqq
()=−
−
32 33
2
(8.70)
2782.indb 278 9/11/09 12:16:33 PM
From Fractals to Multifractals 279
where the intermittency parameter m = K
e
(2), and
Kq
ε
µ
()=
2
[(q/3)
2
− (q/3)]. Similarly, for passive
scalar uctuations, the function z
S
(q) writes as:
ζ
µ
S
qqHqq() ()=− −
2
2
(8.71)
where the parameter H is the degree of nonconservation of the average eld; that is, H = z
S
(1), m =
K
j
(2), and
Kq
ϕ
µ
()=
2
(q
2
− q).
8.3.2.2 the log-lévy model
Because the Gaussian law belongs to the Lévy-stable family of random distributions, that is, stable
and attractive processes under addition (Feller 1971), the lognormal cascade model has been gener-
alized to log-stable cascades (Schertzer and Lovejoy 1987; Kida 1991). In this context, the structure
function scaling exponents z(q) have a precise theoretical shape dened as (Seuront et al. 1996a):
z(q) = Aq + Bq
a
(8.72)
where A and B are empirical constants, and a is the Lévy exponent for stable variables (Feller
1971). Equation (8.72) denes a family of distributions dened according to the value of a, 0 <
a ≤ 2. When a = 2, Equation (8.72) recovers the lognormal model, and the β-model when a → 0
(Seuront et al. 2005). For 1 ≤ a < 2, the scaling is superdiffusive (Shlesinger et al. 1996), while the
value a = 1 indicates that the scaling becomes quadratic in time and corresponds to the lower limit
of superdiffusive processes, that is, Lévy ight (Shlesinger et al. 1996). In contrast, values a ≤ 0 do
not correspond to probability distributions that can be normalized. When a ≤ 2, the variance of the
process diverges, and when a ≤ 1 the mean is not dened. For turbulent velocity, the normalization
condition z
V
(3) = 0 leads to the reformulation of Equation (8.70) as:
ζ
α
ε
ε
α
ε
V
q
q
C
qq
()=−
−
−
3133
1
(8.73)
where
Kq
C
qq
ε
α
α
ε
ε
ε
() (( ))=−
−
1
13 3
, and the parameter C
1e
(C
1e
= m/2) is an intermittency parameter char-
acterizing the fractal dimension of the mean. It satises 0 ≤ C
1e
≤ 1 (the larger C
1e
, the more inter-
mittent the process): C
1e
= 0 for a homogeneous process and C
1e
= 0 for a process so heterogeneous
that the fractal dimension of the set contributing to the mean is zero (Seuront et al. 1999). For pas-
sive scalar uctuations, the lack of a known condition of normalization leads to:
ζ
α
ϕ
ϕ
α
ϕ
S
qqH
C
qq() ()=−
−
−
1
1
(8.74)
where
Kq qq
C
ϕ
α
α
ϕ
ϕ
ϕ
() ()=−
−
1
1
. We can estimate C
1j
and a
j
from Equation (8.74). If Equation (8.74)
is differentiated and evaluated at q = 0, simple algebra shows that:
qq
Cq
ζζ
α
ϕ
α
ϕ
'() ()0
1
1
−=
−
(8.75)
a
j
is given by the slope of [qz′(0) − z(q)] vs. q in a log-log plot, and C
1j
can be estimated from the
intercept.
2782.indb 279 9/11/09 12:16:40 PM

280 Fractals and Multifractals in Ecology and Aquatic Science
8.3.2.3 log-Poisson model
The log-Poisson model (Dubrulle 1994, 2006; She and Waymire 1994; Castaing and Dubrulle 1995)
describes the functions z
V
(q) and z
S
(q) as:
ζγγ
V
q
q
q
c
q
() ()
/
=− −−+
3
1
3
1
3
(8.76)
and
ζγγ
S
q
qqHc q() ()=−−−+()11
(8.77)
where
Kq c
q
q
ε
γγ
() (( ))
/
=−−+11
3
3
and K
f
(q) = c((1
− g)q − 1 + g
q
). g is linked to a maximum inter-
mittency (that is, the most extreme event reachable from a nite sampling), and c is an analogue of
C
1
and characterizes the heterogeneity of this maximum intermittency. To estimate the parameters
g and c, one needs to note that:
ζ
γ
ζ
γ
γ
SS
q
c
q
c
H''() () ()+=−
+−11
(8.78)
The slope and the intercept of a z′(q + 1) vs. z′(q) plot give respectively (1
− g /c) and
γ
γ
c
H()−
; then
considering the parameter H (that is, H = z(1)), the estimation of g and c is straightforward.
8.3.3 as s E s s m E n T o F ca s c a d E mo d E l s F o r pa s s i v E sc a l a r s i n a Tu r b u l E n T Fl o w
The strength of the lognormal (LN), log-Lévy (LL), and log-Poisson (LP) models to describe the
intermittent properties of passive scalars passively advected by fully developed turbulence was
assessed against the functions z
S
(q) estimated from a time series of temperature* sampled simulta-
neously with the in vivo uorescence time series shown in Figure 8.14D. Figure 8.16 shows the func-
tion z
S
(q), for moment up to order 8 (with a 0.1 increment), together with the theoretical ts given by
Equations (8.71), (8.74), and (8.77), for the lognormal, log-Lévy, and log-Poisson models, with the
values proposed in Table 8.1. The lognormal model ts the empirical data for statistical moments
q
< 2.5. This shows that the lognormal model is only compatible with the data up to relatively low
order of moments. In contrast, the empirical curves for both the log-Lévy and log-Poisson models
are indistinguishable for moments up to order 3 to 5 (Figure 8.16). The scaling exponents z
S
(q) were
linear after a critical moment q
c
because of sampling limitations; see Seuront et al. (1999, 2005)
and Seuront (2008) for further details on multifractal phase transitions. Briey, phase transitions
relate to the occurrence of a maximum intermittency g
max
. For rst-order phase transitions, g
max
is
the maximum value taken by a given scalar associated with the occurrence of very rare and violent
intermittencies. In contrast, for a second-order phase transition, g
max
corresponds to the maximum
intermittency effectively detected from a nite sample size. In both cases, for q
≥ q
c
, the function
z
S
(q) has the following linear asymptotic behavior:
ζγ
S
qq()=−1
max
(8.79)
* The reader is referred to (Seuront et al. 2005) for an evaluation of continuous cascade models to characterize the inter-
mittency of turbulent velocity uctuations in the atmosphere and the ocean.
2782.indb 280 9/11/09 12:16:45 PM
From Fractals to Multifractals 281
024
q
A
B
C
3.0
ζ(q)
2.0
1.0
0.0
3.0
ζ(q)
2.0
1.0
0.0
3.0
ζ(q)
2.0
1.0
0.0
68
024
q
68
024
q
68
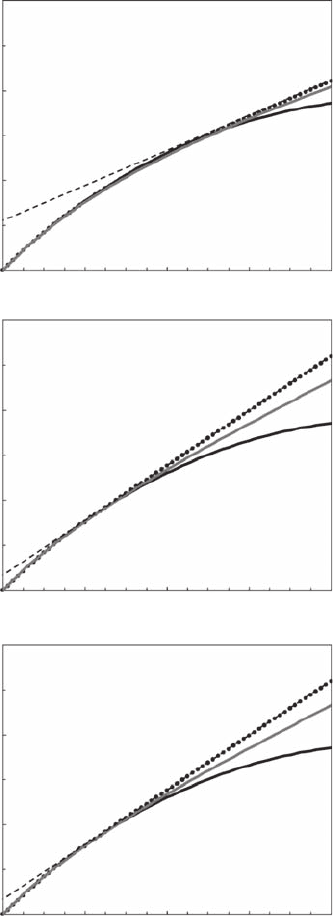
Figure 8.16 The structure function exponents z(q) estimated from 500 realizations (A), 100 realizations
(B) and 1 realization (C) of segments of 128 points using a temperature time series of 65,536 data points. The
critical order of moment q
s
(above which z(q) becomes linear due to sampling limitations) decreases with
decreasing independent realizations. The log-Lévy (black) and log-Poisson (gray) models t the nonlinear
part of the function z(q) very well (that is, for q ≤ q
s
), but the log-Lévy exhibits a universal shape whatever
the number of samples taken into account. In contrast, the log-Poisson model is intrinsically dependent on the
number of samples used in the analysis.
2782.indb 281 9/11/09 12:16:48 PM

282 Fractals and Multifractals in Ecology and Aquatic Science
In the case of sampling limitations, the critical exponent q
s
is given by:
q
s
= (Δs/C
1
)
1/a
(8.80)
Δs is the sampling dimension dened as:
Δs = 1 + logN
s
/logl (8.81)
where N
s
is the number of independent realizations and l is the ratio between the largest and the
smallest scales of the inertial subrange. From Equations (8.79) and (8.80), it comes that q
s
increases
with the number of independent realizations. First- and second-order multifractal phase transitions
then respectively occur when q
c
< q
s
and q
c
≥ q
s
. In this context, it is important to mention a fun-
damental advantage of the log-Lévy model over the log-Poisson model. The log-Poisson model, as
recently discussed (Seuront et al. 2005), is implicitly limited by the upper bound on the intermitten-
cies it can detect, even in case of innite sample size; for the log-Lévy model, there is no theoretical
upper bound for the intermittencies. This is illustrated in Figure 8.16 and Table 8.1. The log-Lévy
models capture the nonlinearity of the empirical exponents z
S
(q) independently of the number of
samples used to estimate z
S
(q), the value of the critical order of moment q
s
(Figure 8.16), and the
related parameters H, C
1j
and a
j
(Table 8.1). In contrast, the log-Poisson t and the values of the
parameters g and c are strongly linked to the number of samples used in the analyses (Figure 8.16
and Table 8.1).
These results have strong implications in terms of both appropriately sampling the marine envi-
ronment and understanding the nature of the related biophysical patterns. The previous results dem-
onstrate that the log-Lévy models are much more robust than the log-Poisson models to reliably
quantify the intermittency properties of marine scalars because of their ability to capture their statis-
tical properties even with a limited number of observations. This is critical for the implementation of
sampling strategies and the subsequent reliable assessment of intermittent patterns and processes.
8.4 multiFractals: misconcePtions and ambiguities
8.4.1 s
p i k E s , in T E r m i T T E n c y , a n d po w E r sp E c T r a l an a l y s i s
The limitations of power spectral analysis and the fact that the spectral slope is not necessarily a
strong test of any model of physical-biological interactions without a preliminary careful exami-
nation of the raw data have recently been emphasized by Franks (2005). For instance, different
table 8.1
temperature and salinity time series
Note: Parameters of the log-Lévy (H, C
1
, and a) and log-Poisson (g and c) models obtained for
500 (N
1
), 100 (N
2
), and 1 (N
3
) independent realizations of segments of 128 points using a tem-
perature time series of 65,536 data points. The log-Poisson parameters are strongly dependent to
the number of independent realizations considered in the structure function analysis. In contrast,
the log-Lévy model returns universal values for H, C
1
, and a.
H
C
1
α
γ
c
N
1
0.41
0.04
1.80
0.25
0.79
N
2
0.42
0.04
1.82
0.20
0.56
N
3
0.42
0.04
1.80
0.18
0.46
N
1
0.43
0.06
1.80
0.28
0.82
N
2
0.43
0.06
1.80
0.23
0.63
N
3
0.42
0.06
1.80
0.20
0.52
Salinity
Temperature
2782.indb 282 9/11/09 12:16:50 PM
From Fractals to Multifractals 283
phase relationships of the various sines and cosines making up the Fourier decomposition of the data
may indeed lead qualitatively very distinct signals to return a k
−5/3
spectral slope (see Franks 2005,
Figure 13). It is, however, acknowledged that a careful examination of the raw data to identify specic
features (for example, rst- and second-order stationarity) that might be driving the spectral slope is an
absolute prerequisite to spectral analysis (Bloomeld 2000), and ultimately to any type of time series
analysis; see, for example, Chateld (2003), Kantz and Schreiber (2004), and Wei (2005).
Franks (2005) found that the power spectra of images of phytoplankton uorescence gathered
with an imaging uorometer were “white” (b = 0) over nearly two decades. He subsequently
claimed that “the few, large, intensely uorescent cells” that occur over a background of low
uorescence—and might somehow be related to the uorescence intermittent hot spots clearly
visible in Figure 8.14d—“cause the spectrum to be at, or white.” To support this statement and
his empirical ndings, under the assumption that uorescence hotspots behave as delta functions,
he created 400 data series of 256 points with 20 randomly placed delta functions, calculated their
spectra, averaged them, and plotted the average spectrum, which was at. Similarly, he showed that
randomly adding 30 delta functions of increasing amplitudes to a synthetic data set 256 points long
created from 30 sine waves whose amplitude was determined by a k
−5/2
spectral slope lowers the
slope of the spectrum from k
−5/2
with no spikes to k
−2/3
when the spikes were 5× the amplitude of the
largest sine wave. As stated by Franks (2005), it is agreed that “spikes in plankton could arise from
any number of causes that have nothing to do with mixing in 3D isotropic turbulence.” However,
to consider that uorescence hotspots—whether they are created by large cells, aggregates, pieces
of seaweed, or zooplankton guts—behave as randomly distributed delta functions is a very strong
assumption. This implies that the distribution of these hotspots follows a Markovian process, thus
returning a “white,” memoryless power spectrum, which contradicts (1) many empirical works that
have found spectral slopes signicantly different from zero for nutrients, phyto- and zooplankton
distributions (Tsuda et al. 1993; Seuront et al. 1996a, 1999, 2002; Mountain and Taylor 1996; Wiebe
et al. 1996; Lovejoy et al. 2001; Pershing et al. 2001); and (2) more specic investigations speci-
cally dealing with the scaling properties of intermittent behaviors in nutrient, phytoplankton, and
zooplankton (Seuront et al. 1996a, 1996b, 1999, 2002; Seuront and Lagadeuc 2001; Lovejoy et al.
2001; Seuront 2005b). In addition, from a purely methodological point of view, the power spectrum
resulting from randomly placed delta functions will intrinsically return a “white” behavior because
the Fourier transform of a delta function is a constant, that is, a white spectrum. In contrast, there is
no assumption related to the use of structure functions, which would pick up the stochastic proper-
ties of any intermittent eld whatever they are, that is, at or steep spectra.
The role of intermittent uctuations on power spectral slopes is claried hereafter on both theoret-
ical and empirical grounds. From Equations (8.67) and (8.73), Equation (4.23) can be rewritten as:
Ek k
V
C
()
/( /( ))(( /) /)
≈
−− −−
53 12323
1
εε
α
ε
α
(8.82)
This leads to a slope steeper than 5/3 because z
v
(2) < 0 (see Equation 8.73). Using C
1e
= 0.15 and
a
e
= 1.50 for atmospheric turbulence and C
1e
= 0.16 and a
e
= 1.55 for oceanic turbulence (Seuront
et al. 2005) in Equation (8.82) leads to b
V
(k) = 1.70. Similarly, from Equation (8.67) and (8.74),
Equation (4.24) is rewritten as:
Ek k
s
HC
()
[(/( ))(( ))]
≈
−+ −−−12 12 2
1
ϕϕ
α
ϕ
α
(8.83)
Using C
1j
= 0.04 and a
j
= 1.70 for in vivo uorescence advected by fully developed turbulence in
the coastal waters of the eastern English Channel in Equation (8.83) leads to b
S
(k) = 1.77. Both
intermittent turbulent velocity uctuations and intermittent in vivo uorescence uctuations
lead to a spectral slope steeper than the theoretical b
S
(k) = 5/3 expected under nonintermittent
2782.indb 283 9/11/09 12:16:53 PM