Saltzman B. (editor) Anomalous Atmospheric Flows and Blocking
Подождите немного. Документ загружается.

314
A.
J.
SIMMONS
the
0.6
correlation coefficient reached on average about
I
day later in the
forecast period over Europe than over North America. However, the extent
of these differences is not confirmed by examination of another measure of
skill, the standard deviation of forecast error, normalized by persistence, for
the 850-mbar wind.
A
definitive specification of regional differences in fore-
cast accuracy over the extratropical Northern Hemisphere is thus difficult to
give on the basis of such objective verification.
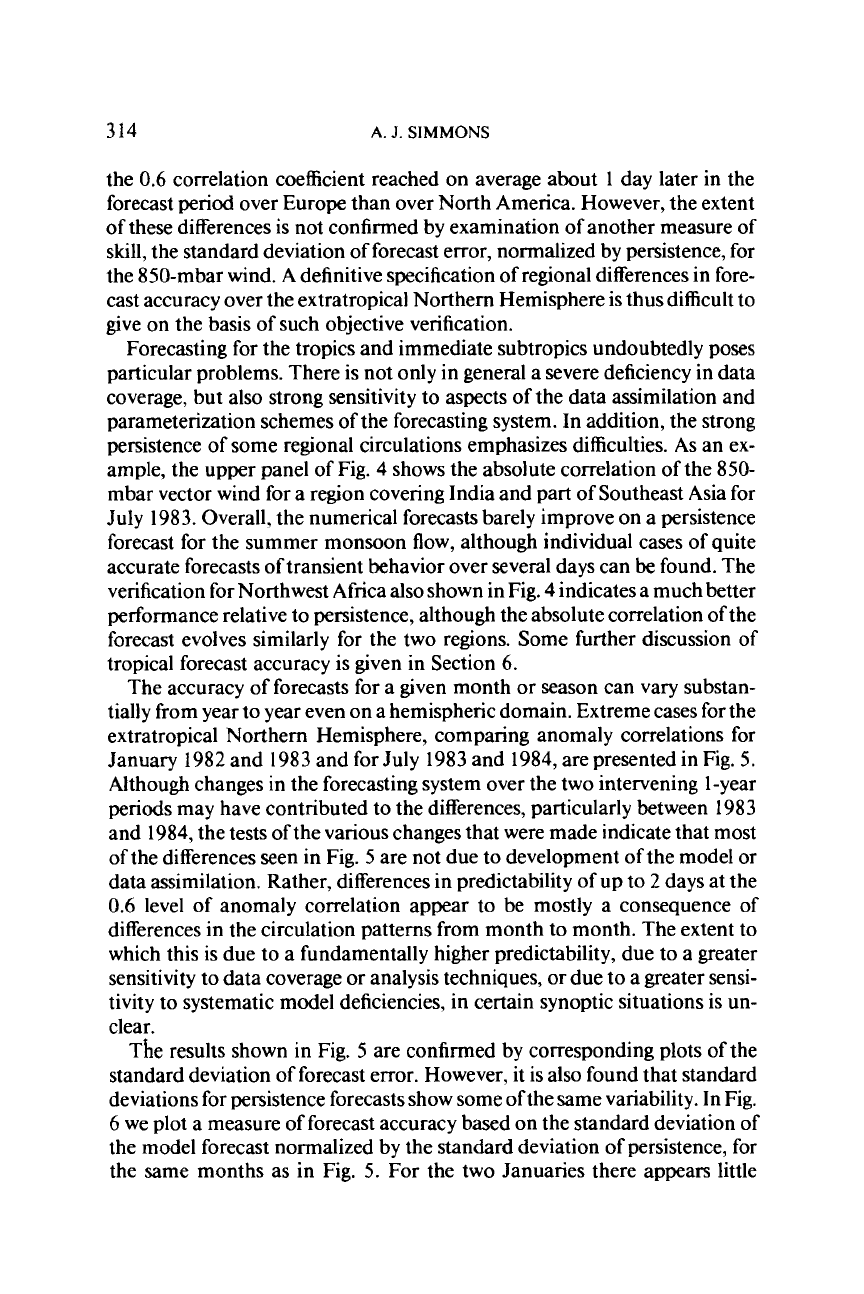
Forecasting for the tropics and immediate subtropics undoubtedly poses
particular problems. There is not only in general a severe deficiency in data
coverage, but also strong sensitivity to aspects of the data assimilation and
parameterization schemes of the forecasting system. In addition, the strong
persistence of some regional circulations emphasizes difficulties.
As
an ex-
ample, the upper panel of Fig.
4
shows the absolute correlation of the 850-
mbar vector wind for a region covering India and part of Southeast Asia for
July 1983. Overall. the numerical forecasts barely improve on a persistence
forecast for the summer monsoon flow, although individual cases of quite
accurate forecasts
of
transient behavior over several days can
be
found. The
verification for Northwest Africa also shown in Fig.
4
indicates a much better
performance relative to persistence, although the absolute correlation of the
forecast evolves similarly for the two regions. Some further discussion of
tropical forecast accuracy is given in Section
6.
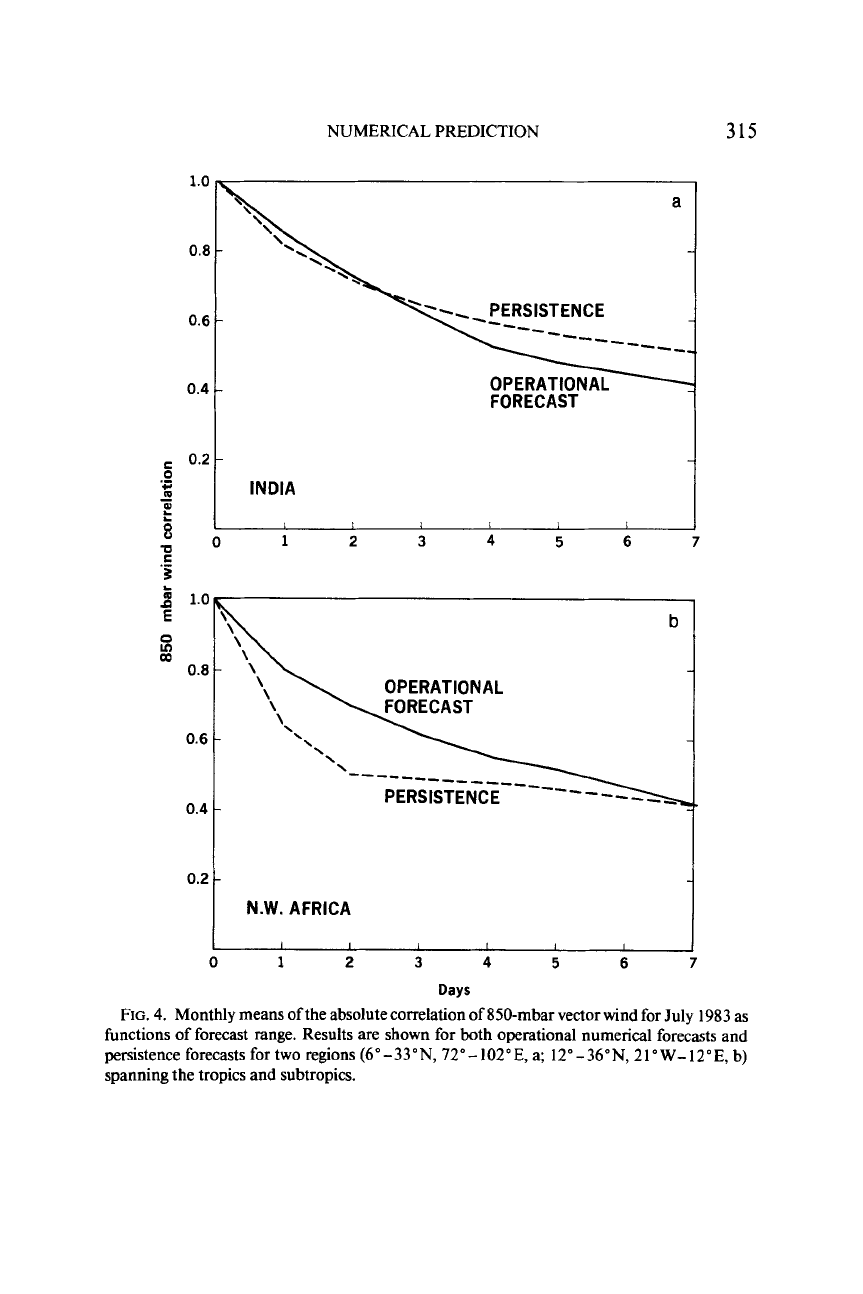
The accuracy of forecasts for a given month
or
season can vary substan-
tially from year to year even on a hemispheric domain. Extreme cases for the
extratropical Northern Hemisphere, comparing anomaly correlations for
January 1982 and 1983 and for July 1983 and 1984, are presented in Fig. 5.
Although changes in the forecasting system over the two intervening I-year
periods may have contributed to the differences, particularly between 1983
and 1984, the tests of the various changes that were made indicate that most
of the differences seen in Fig.
5
are not due to development of the model or
data assimilation. Rather, differences
in
predictability of up to
2
days at the
0.6
level of anomaly correlation appear to be mostly a consequence of
differences in the circulation patterns from month to month. The extent to
which this is due to a fundamentally higher predictability, due to a greater
sensitivity to data coverage
or
analysis techniques,
or
due to a greater sensi-
tivity to systematic model deficiencies,
in
certain synoptic situations
is
un-
clear.
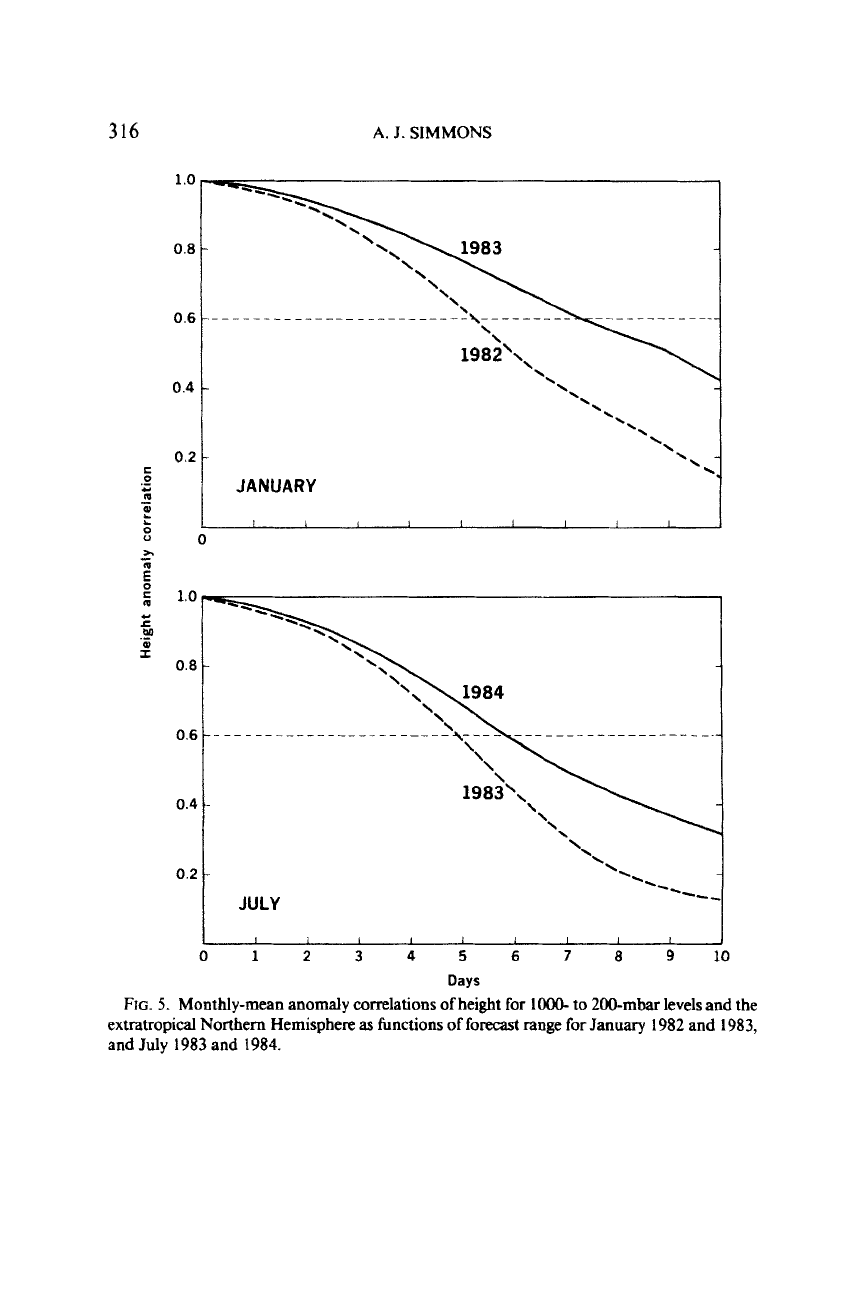
The
results shown in Fig. 5 are confirmed by corresponding plots
of
the
standard deviation of forecast error. However, it is also found that standard
deviations for persistence forecasts show some of the same variability. In Fig.
6
we plot a measure of forecast accuracy based on the standard deviation of
the model forecast normafized by the standard deviation of persistence, for
the same months as in Fig. 5.
For
the two Januaries there appears little
NUMERICAL PREDICTION
315
1.0
0.8
0.6
0.4
a
OPERATIONA-
FORECAST
INDIA
o.21---.--
N.W.
AFRICA
0
1
2
3
4
5
6
Days
FIG.
4.
Monthly means of the absolute correlation of 850-mbar vector wind for July 1983 as
functions of forecast range. Results are shown for both operational numerical forecasts and
persistence forecasts for two regions (6"-33"N, 72"-102"E, a; 12"-36"N, 2I0W-12"E, b)
spanning the tropics and subtropics.
316
A.
J.
SIMMONS
Days
FIG.
5.
Monthly-mean anomaly correlations
of
height
for
1OOO-
to
200-mbar
levels and the
extratropical
Northern Hemisphere
as
functions
of forecast
range
for
January
1982
and
1983,
and July
1983
and
1984.
E
.-
0
.-
m
0.2
0
e
I
>
D
0
12
3
4
5
6
7
8 9
10
Days
FIG.
6.
As
Fig.
5,
but
for
a measure of forecast accuracy based
on
standard deviation normal-
ized by persistence.
'
'\
'\.<
-
JANUARY
I
I
I I
I I
I
I
,
318
A.
J.
SIMMONS
difference in forecast quality out to day 4, according to this measure, al-
though the superiority of 1983 still becomes evident in the second half of the
forecast range. July 1984 appearsclearly better than July 1983 beyond day
2.
Thus although differences are not quite
so
pronounced for a measure nor-
malized by the skill of a persistence forecast, they are nevertheless substantial
in the medium range.
5.
THE
PREDICTION
OF
BLOCKING
AND
CUTOFF
Lows
Spells of above- and below-average predictability are also found within a
monthly time scale. Examples have been discussed by Bengtsson and Sim-
mons
(
1983), and here we present a more recent case, November 1983, as
a
basis for choice of specific examples
of
forecasts involving blocking and the
formation of cutoff lows.
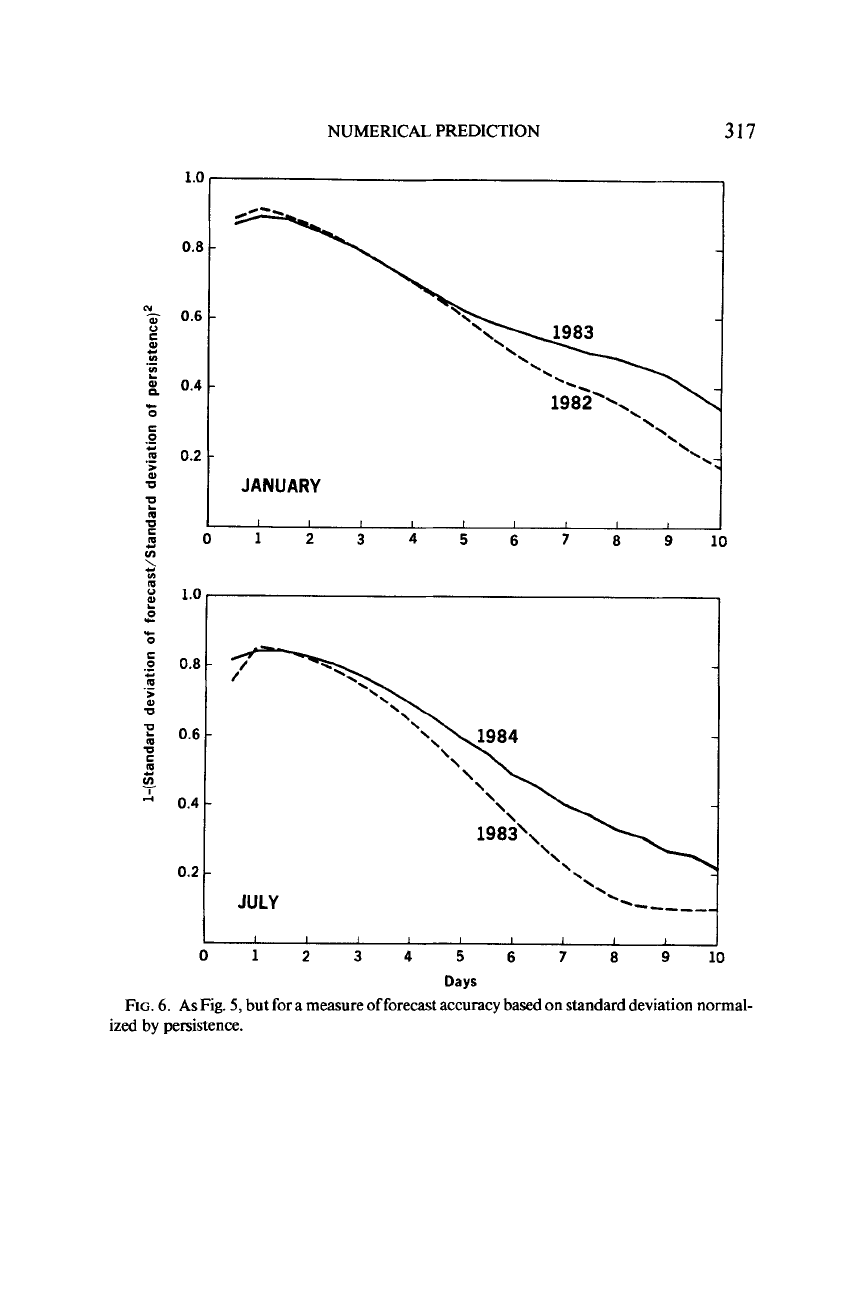
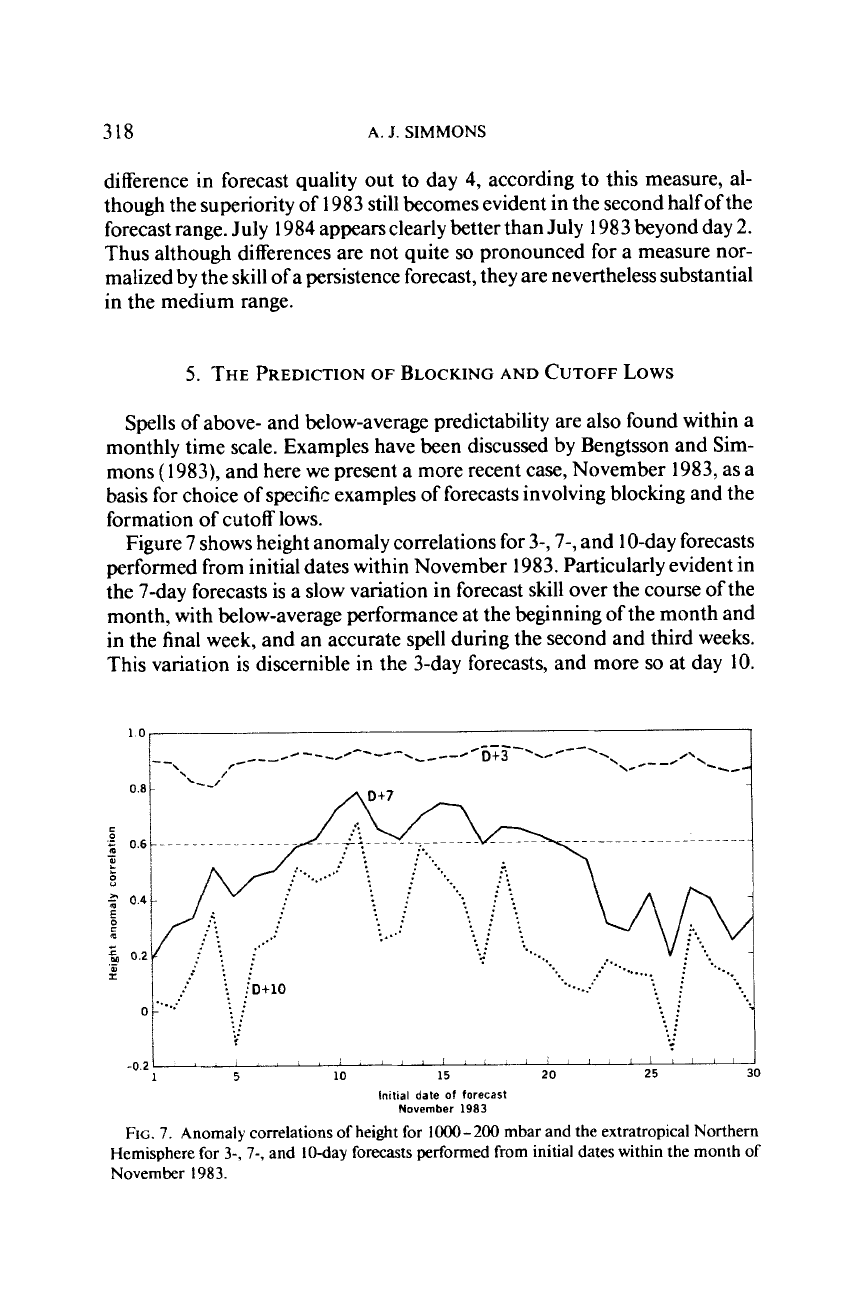
Figure 7 shows height anomaly correlations for 3-, 7-, and
1
0-day forecasts
performed from initial dates within November 1983. Particularly evident in
the 7-day forecasts is a slow variation in forecast skill over the course of the
month, with below-average performance at the beginning of the month and
in the final week, and an accurate spell during the second and third weeks.
This variation is discernible in the 3-day forecasts, and more
so
at day
10.
1.0
7
I
I.//I.l,,ll/ll
I
5
10
15
20
25
30
-021
Initial
date
of
forecast
November
1983
FIG.
7.
Anomaly correlations of height for
1000-200
mbar and the extratropical
Northern
Hemisphere
for
3-,
7-,
and
IMay
forecasts performed from initial dates within the month
of
November
1983.
NUMERICAL PREDICTION
319
Small daily variations in the accuracy of individual forecasts at
day
7
are seen
to be amplified at
day
10.
To
illustrate the range of accuracy
of
large-scale forecasts within this
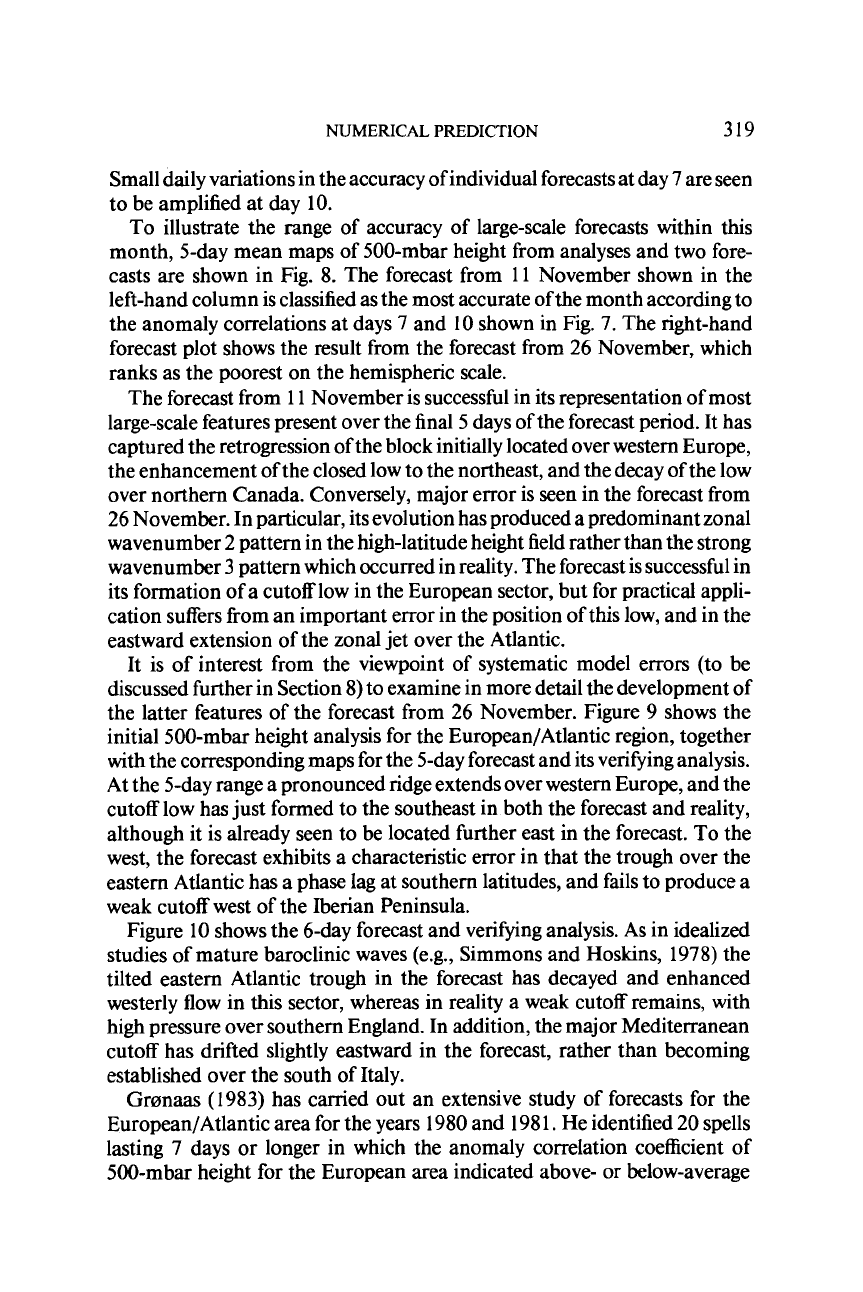
month, 5-day mean maps of 500-mbar height from analyses and two fore-
casts are shown in Fig. 8. The forecast from
11
November shown in the
left-hand column is classified as the most accurate of the month according to
the anomaly correlations at days
7
and 10 shown in Fig.
7.
The right-hand
forecast plot shows the result from the forecast from 26 November, which
ranks as the poorest on the hemispheric scale.
The forecast from
1
1
November is successful in its representation of most
large-scale features present over the final 5 days of the forecast period. It has
captured the retrogression of the block initially located over western Europe,
the enhancement of the closed low to the northeast, and the decay of the low
over northern Canada. Conversely, major error is seen in the forecast from
26 November. In particular, its evolution has produced a predominant zonal
wavenumber 2 pattern in the high-latitude height field rather than the strong
wavenumber
3
pattern which occurred in reality. The forecast is successful in
its formation of a cutoff low in the European sector, but for practical appli-
cation suffers from an important error in the position of this low, and in the
eastward extension of the zonal jet over the Atlantic.
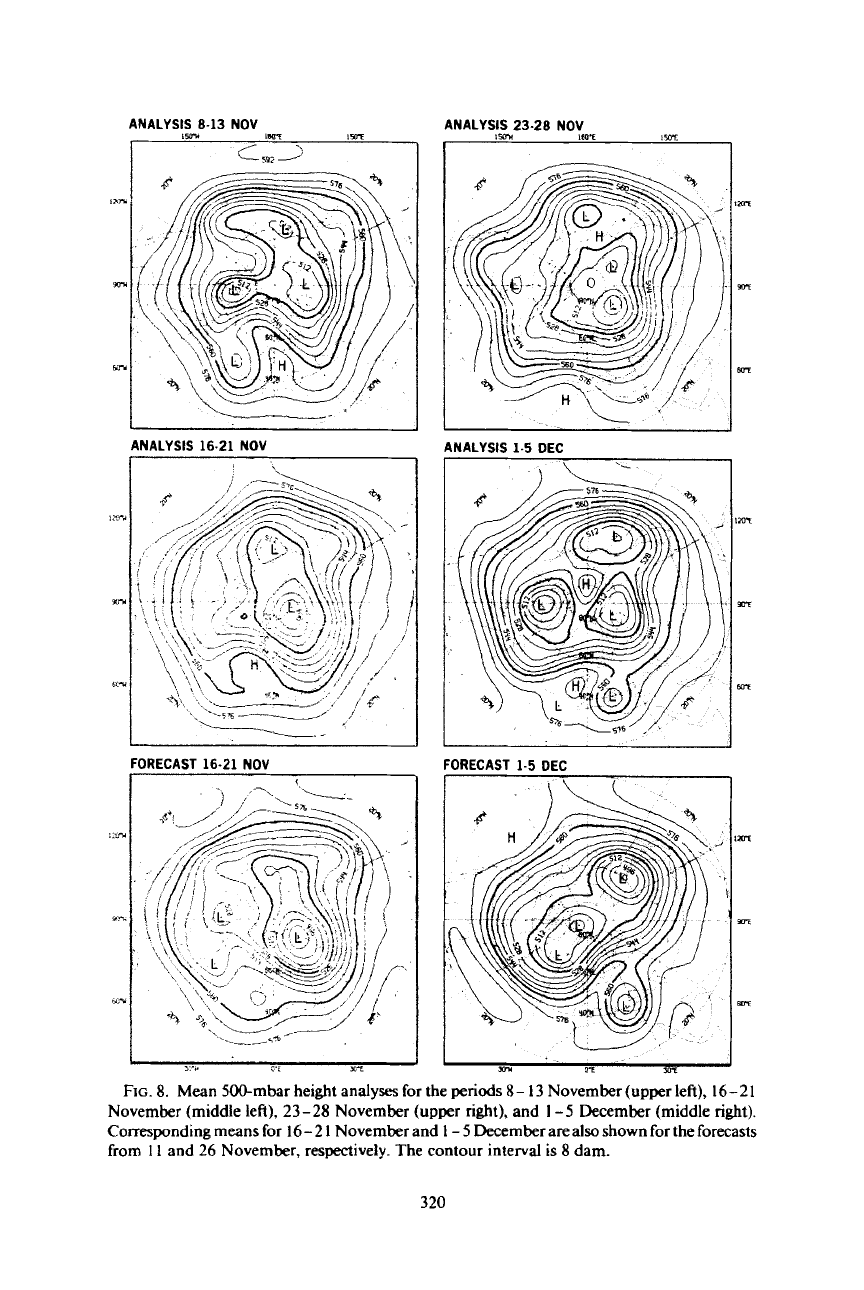
It is of interest from the viewpoint of systematic model errors (to be
discussed further in Section 8) to examine in more detail the development of
the latter features of the forecast from 26 November. Figure 9 shows the
initial 500-mbar height analysis for the European/Atlantic region, together
with the corresponding maps for the 5-day forecast and its verifying analysis.
At the 5-day range a pronounced ridge extends over western Europe, and the
cutoff low has just formed to the southeast in both the forecast and reality,
although it is already seen to be located further east in the forecast. To the
west, the forecast exhibits a characteristic error in that the trough over the
eastern Atlantic has a phase lag at southern latitudes, and fails to produce a
weak cutoff west of the Iberian Peninsula.
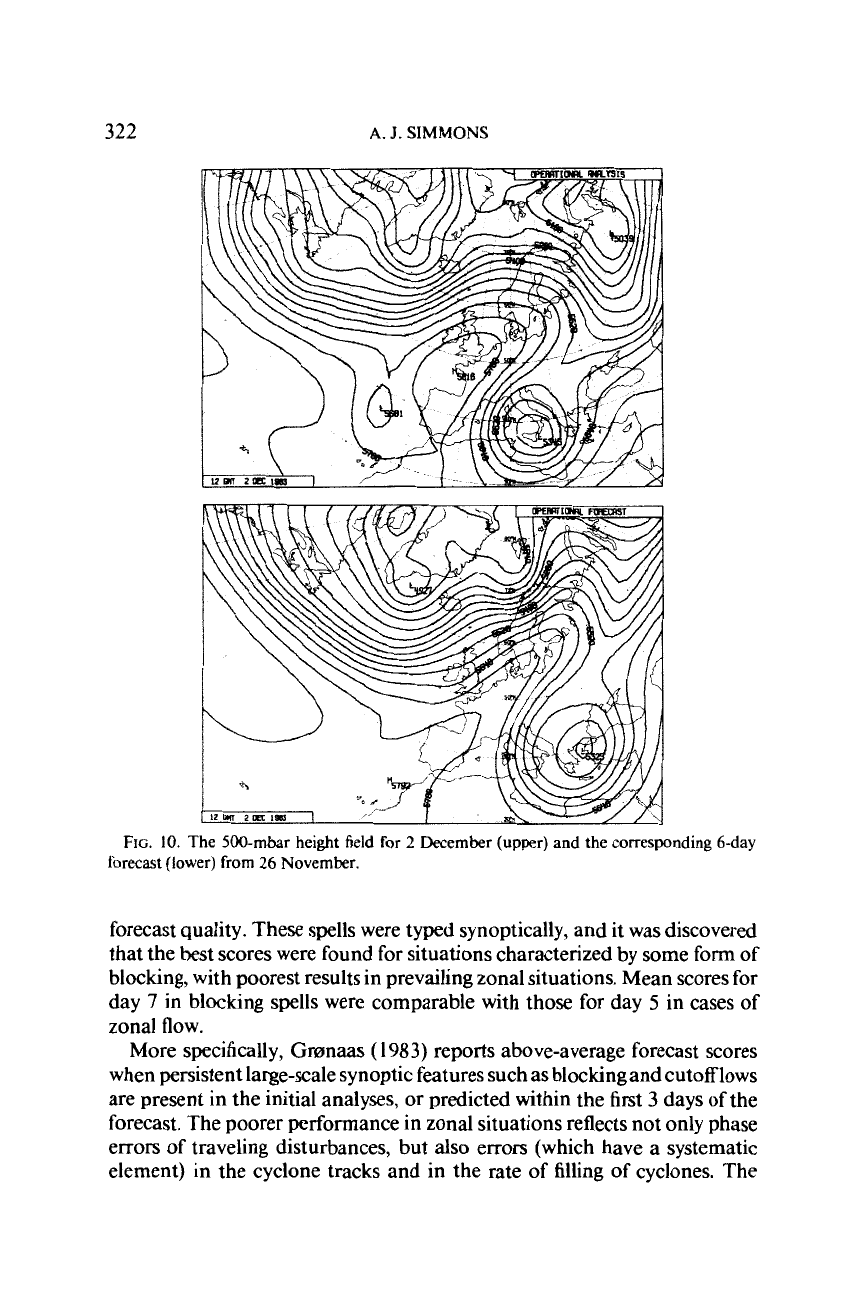
Figure 10 shows the 6-day forecast and verifying analysis. As in idealized
studies of mature baroclinic waves (e.g., Simmons and Hoskins, 1978) the
tilted eastern Atlantic trough in the forecast has decayed and enhanced
westerly flow in this sector, whereas in reality a weak cutoff remains, with
high pressure over southern England. In addition, the major Mediterranean
cutoff has drifted slightly eastward in the forecast, rather than becoming
established over the south of Italy.
Grernaas (1983) has carried out an extensive study of forecasts for the
European/Atlantic area for the years 1980 and 198
1.
He identified 20 spells
lasting
7
days or longer in which the anomaly correlation coefficient
of
500-mbar height for the European area indicated above- or below-average
1-
IM
ANALYSIS
8-13
NOV
1W.W
cl
'ipi
i
ANALYSIS
16.21
NOV
I
.
FORECAST 16-21 NOV
ANALYS!&23-28 NO!=+
,so+
I
I
NALYSIS 1-5
DEC
,
\
--
I
I
FORECAST 1-5
DEC
FIG.
8.
Mean
500-mbarheightanalysesfortheperiods8-13
November(upperleft), 16-21
November (middle
left),
23-28 November
(upper
right),
and
1-5
December (middle
right).
Corresponding means
for
16
-
2
1
November and
I
-
5
December are also shown
for
the forecasts
from
I
I
and 26 November,
respectively.
The contour interval
is
8
dam.
320
FIG.
9.
The 500-mbar height analysis for 12
GMT
26 November (upper) and
1
December
(middle), and the 500-mbar height field forecast for
1
December (lower) from initial conditions
for 26 November. The contour interval is 6 dam.
32
I
322
A.
J.
SIMMONS
FIG.
10.
The
500-mbar
height field
for
2
December
(upper)
and the corresponding
6-day
forecast
(lower) from 26 November.
forecast quality. These spells were typed synoptically, and it was discovered
that the best scores were found for situations characterized by some form of
blocking, with poorest results in prevailing zonal situations. Mean scores for
day
7
in blocking spells were comparable with those for day
5
in cases of
zonal flow.
More specifically, Gr~rnaas
(
1983)
reports above-average forecast scores
when persistent large-scale synoptic features such as blocking and cutoff lows
are present in the initial analyses,
or
predicted within the first
3
days of the
forecast. The poorer performance in zonal situations reflects not only phase
errors of traveling disturbances, but
also
errors (which have a systematic
element) in the cyclone tracks and in the rate of filling of cyclones. The
NUMERICAL
PREDICTION
323
systematic errors appear to inhibit the formation of blocking later in the
forecast period and give rise to a tendency for the cyclonic activity on
the western side of a ridge or block to break down that feature. An indication
of this has already been discussed with respect to the forecast from 26 No-
vember 1983.
Situations in which the development
of
blocking is accurately predicted
may also be used to examine the mechanisms and interactions involved, and
the features of the forecasting system which are of crucial importance. This
can be achieved by controlled numerical experimentation, and case studies
examining a range of sensitivities to such features as orography, model
resolution, and parameterizations have been reported by Bengtsson (198 l),
Ji and Tibaldi (1983), Tibaldi and Buzzi (1983), and Tibaldi and Ji (1983).
6. DEVELOPMENTS
IN
PREDICTIVE SKILL
Miyakoda
et
al.
(
1972) suggested that the results of their first comprehen-
sive trial of2-week predictions, using a hemispheric model, might
be
taken as
a benchmark for future comparisons. Their ensemble mean anomaly corre-
lations of 500-mbar height for the extratropical Northern Hemisphere, based
on 12 forecasts from January cases taken from the years 1964 to 1969, are
presented in Fig. 11, together with corresponding results from the opera-
tional ECMWF forecasts for the December to February period for the years
1982/1983 and 1983/1984. Included in the ECMWFresultsis the month of
January 1983, which we have already shown to have been one of high
predictability with the then-operational gridpoint model, but results with the
new spectral model and envelope orography for January 1984 are only
slightly poorer than achieved in the operational forecasts for the previous
January, and
Fig.
1 1
thus appears to be reasonably representative of current
ECMWF skill for the winter months.
Although a number
of
other qualifying remarks could be made about the
comparison presented in Fig. 11, it is nevertheless clear that a substantial
improvement has taken place over the past
10-
15
years in our ability to
predict at least the larger scales of motion over the extratropical Northern
Hemisphere. The improvement is confirmed by comparison of limited-area
verifications of operational forecasts over Europe
(L.
Bengtsson, personal
communication). Figure
11
shows a large increase in accuracy in the very
early part of the forecast, suggesting an important contribution from a more
accurate specification of the initial state. Overall, the more recent forecasts
reach the 0.8 level of anomaly correlation almost 2.5 days later, and they also
exhibit a somewhat smaller error growth beyond this time, as measured
either by anomaly correlation or by standard deviation. Differences between