Reed S.J.B. Electron microprobe analysis and scanning electron microscopy in geology
Подождите немного. Документ загружается.

has been described by Nielsen and Sigurdsson (1981). Techniques developed
specifically for hydrous glasses, whereby H
2
O is estimated by difference, have
been described by Morgan and London (1996).
Stormer, Pierson and Tacker (1993) observed variations i n the intensity of
the F Ka emission fr om apatite depending on crystal orientation. This
behaviour is explained by anisotropic diffusion of F ions to the surface,
10
5
0
0
(a)
12
Wt
% Na
345
10
30
70
Beam curren
t
(nA)
Time (min)
10
(b)
Wt
% Na
5
0
012
Time (min)
Beam diamete
r
(µm)
345
20
10
5
1
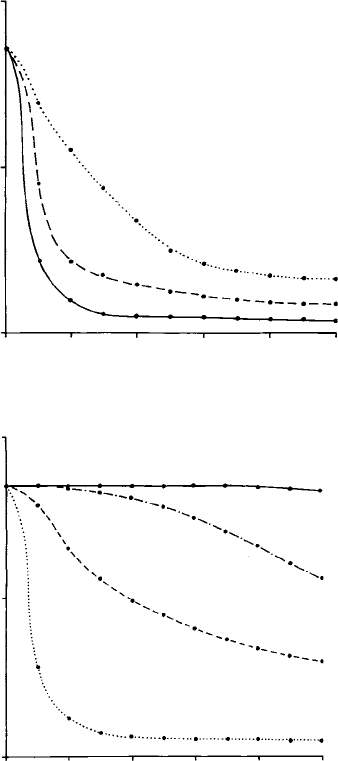
Fig. 8.4. Loss of Na from albite as a function of time (accelerating voltage
15 kV): (a) beam diameter 1 mm, various currents; and (b) beam current
50 nA, various diameters. After Autefage and Couderc (1980).
8.7 Beam damage 145
followed by loss of F to the vacuum over a longer time sc ale. Somewhat
similar, tho ugh less ext reme , behaviour is shown by Cl. Other minerals t hat
exhibit effects due to electron b ombardment i nclude realgar (AsS) and
cinnabar (HgS).
8.8 Boundary effects
The results of quantitative analyses close to boundaries between phases are
affected by the finite size of the X-ray source. Assuming that the beam
diameter is small (<1 mm), the source size (and hence the spatial resolution)
is governed by the penetration of the electrons and the spreading of their
trajectories in the specimen. The effective spatial resolution in quantitative
analysis can be defined as the size of the region within which 99% of the
measured characteristic X-rays are produced, and is related to the electron
range (Section 2.2.1). The effective range in the present context is the distance
travelled before the energy falls to the critical excitation energy, E
c
, beyond
which no more characteristic X-rays are produced. The diameter d (in micro-
metres) of the source region can be estimated from the following equation:
d ¼ 0:22ðE
1:5
0
E
1:5
c
Þ=; (8:3)
where E
0
and E
c
are in keV and is the density of the specimen. For example,
in the case of a silicate with a density of 3 g cm
3
and with E
0
¼ 15 keV and
E
c
¼ 4 keV (Ca), d ¼ 3.7 mm.
Finite spatial resolution modifies element profiles when the rate of change
is significant on a micrometre scale, for example in zoned minerals and
in artificial diffusion profiles used to determine diffusion coefficients. The
latter case has been analysed by Ganguly, Bhattacharya and Chakrabarty
(1988), who proposed a method of ‘deconvolution’ based on the assumption
of a Gaussian X-ray source profile, which enables the original profile to be
retrieved.
8.9 Special cases
Quantitative electron microprobe analysis is normally carried out on flat well-
polished specimens using a focussed electron beam at normal incidence. If
these conditions are not satisfied the accuracy of the results may suffer.
However, the cases of analysis under non-ideal conditions described in the
following sections are of practical interest and steps can be taken to minimise
the loss of accuracy.
146 X-ray analysis (2)
8.9.1 Tilted specimens
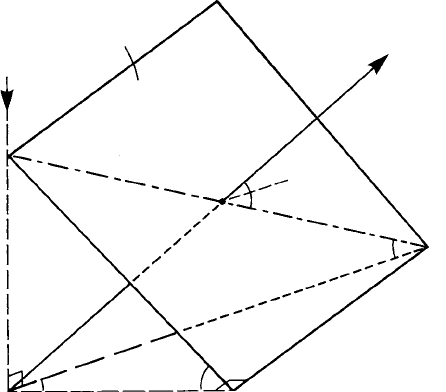
In an SEM the specimen may be tilted, which changes both the X-ray take-off
angle and the angle of electron incidence. Assuming that the shape of the (z)
function remains the same, the effect of tilt can be corrected by replacing cosec
in the absorption correction by cos T /(sinT cos A cos E þ sin E cos T ), where T
(tilt angle), A (azimuth angle) and E (elevation angle) are as shown in Fig. 8.5.
(The shape of (z) is affected somewhat by the angle of electron incidence, but
this is usually neglected, as is the effect of tilt on the backscattering correction).
If the specimen surface has irregular topography, the tilt angle is not known.
A procedure for dealing with such cases described by Wiens et al.(1994)
involves rotating the specimen through 180
o
and repeating the X-ray intensity
measurements on the same point. Reasonable results can be obtained by
simply averaging these values, provided that the tilt angle is not too large.
8.9.2 Broad-beam analysis
An essential characteristic of EMPA is its spatial resolution (normally
approximately 1 mm), but sometimes it is appropriate to use a deliberately
broadened beam (e.g. to determine the average composition of a devitrified
melt). The beam can be enlarged for this purpose by defocussing the final lens,
or alternatively the beam may be scanned in a raster. When WD spectrometers
Surface of
specimen
Electron
beam
Q
P
T
A
B
B
E
X-ray
path
R
Fig. 8.5. The geometry of absorption correction for a tilted specimen (see
the text).
8.9 Special cases 147
are used, the size of the analysed area should be limited to less than 100 mmto
minimise spectrometer defocussing, which affects different elements to a vary-
ing degree. Larger areas can be analysed by EDS (the count-rate should be
restricted, however, in order to avoid differential dead-time effects between
areas of varying composition when scanning is used).
The weighted sum of the matrix effects for the individual phases within the
analysed area is not the same as that of an equivalent homogeneous sample,
because of the nonlinear dependence of correction factors on concentration.
The results obtained by applying matrix corrections to broad-beam analyses
are therefore not as accurate as for normal point analyses of single phases.
8.9.3 Particles
Small particles (less than about 25 mm in diameter) are difficult to mount and
polish. They can, however, be analysed in an unpolished state, mounted on an
SEM stub, for example. Particles of the order of 1 mm in size should preferably
be supported on a thin carbon film, which gives minimal X-ray background.
Very small particles (less than 1 mm in diameter) should be analysed in an
analytical electron microscope (Section 1.4.1).
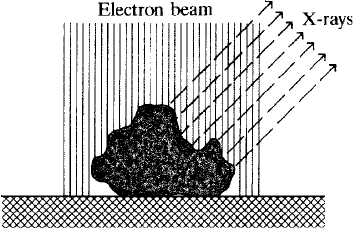
The usual procedure for quantitative analysis is liable to give inaccurate
results for particles, since the correction formulae are based on the ideal of a
flat well-polished specimen. Also, if the particle is too small to absorb the
entirety of the beam, the X-ray intensities are reduced by comparison with
solid standards (Fig. 8.6). The problem of loss of X-ray generation can be
avoided by deriving concentration ratios from the ratios of X-ray line inten-
sities: for example, Pyman, Hillyer and Posner (1978) obtained linear calibra-
tion plots of concentration ratios versus intensity ratios for clay mineral
particles in the 1–5-mm size range. However, this does not make any allowance
for differential absorption effects between X-ray lines of different elements.
A more rigorous approach is to use modified corrections that take account
of the particle geometry. In the Armstrong–Buseck method (Armstrong,
1991), correction equations derived for various idealised particle geometries
are used, the nearest to the actual geometry being applied in each case. Particle
shapes and sizes are assessed by means of SEM images or optical microscopy.
Alternatively, the Monte Carlo method (Section 2.7) can be used to simulate
X-ray generation in particles of various geometries.
Another possibility is to measure peak-to-background ratios and make use
of the fact that the effect of particle geometry on the continuum is similar to
that on characteristic X-rays of the same energy (Statham and Pawley, 1977;
Small, Newbury and Myklebust, 1979). Concentrations can be derived from
148 X-ray analysis (2)
peak-to-background ratios measured on the sample compared with ratios
measured on standards. In ED spectra it is often necessary to remove the
peaks by ‘stripping’ in order to determine the background, owing to the lack
of suitable peak-free regions in the spectrum. The precision of measured peak-
to-background ratios is governed by the statistical error in the relatively low
background intensity: this necessitates longer acquisition times than are cus-
tomarily used for measuring peaks.
8.9.4 Rough and porous specimens
Absorption and other corrections are affected by roughness (irregularities of
much less than 1 mm can have a significant effect). The angle of the surface is
also important and should not vary by more than 1
o
. Care should therefore be
exercised in order to avoid polishing relief at the edges of grains.
Porosity also affects the results of quantitative analysis. If the pores are filled
with mounting medium, a fraction of the incident electron energy will be
absorbed in the medium, causing a loss of X-ray production in the sample
itself and consequently low analytical results. If the pores are vacant the effect
is less marked. Also, extraneous material introduced during polishing can lead
to misleading results (e.g. spurious Al due to alumina).
The method based on peak-to-background ratios described in the preceding
section can be applied to rough and porous samples, in order to obtain at least
semi-quantitative results.
8.9.5 Thin specimens
Limits to spatial resolution governed by the penetration and spreading of the
beam in thick specimens can be overcome by using thin (e.g. 100 nm) specimens
Fig. 8.6. Particle analysis: results are affected by loss of X-ray intensity because
some electrons in the beam miss the particle (when this is smaller than the beam
diameter) and the X-ray absorption path varies owing to the irregular shape.
8.9 Special cases 149
through which electrons pass with relatively little scattering. Rock and mineral
specimens prepared as for transmission electron microscopy (usually by ion-
beam thinning) can be used. Either an electron microprobe or SEM with an ED
spectrometer can be utilised for the analysis of such samples, but it is better to
use an analytical electron microscope (AEM), as described in Section 1.4.1,with
which spatial resolution of about 10 nm is possible.
ED analysis is used in this field because of the need for high detection
efficiency to compensate for the low X-ray intensity. Methods of spectrum
processing used for thick specimens are applicable (see Section 7.6). Somewhat
different considerations apply, however, to the conversion of peak intensities
into concentrations, because the intensities depend on specimen thickness,
which is difficult to determine. The usual approach is to derive concentration
ratios from relative peak intensities within the spectrum. This requires infor-
mation on the ‘sensitivity factor’ (intensity per unit concentration) for each
element. This can be deduced from the efficiency of X-ray generation, which
can be calculated from first principles, and the detection efficiency, which can
also be calculated given knowledge of the thickness of the detector window etc.
Alternatively a purely empirical calibration curve based on measurements on
specimens of known composition can be used (Cliff and Lorimer, 1975). For
sufficiently thin specime ns the effects of absorption, fluorescence, etc. can be
neglected, but in practice an absorption correction is often required for geological
samples containing elements such as Na and Mg. For further details, see Joy,
Romig and Goldstein (1986); and for a discussion of geological aspects, see
Champness (1995).
8.9.6 Fluid inclusions
The analysis of fluid inclusions is a challenging problem, but residues left after
opening fluid-containing cavities by cleaving or fracturing the host crystals can
be analysed (Eadington, 1974), as can crystals that coexist with the fluid
(Metzger et al., 1977; Anthony, Reynolds and Beane, 1974). The results are,
however, only semi-quantitative, owing to the effects of topographic irregu-
larity. Aqueous fluids can be analysed in situ if frozen. Initial freezing should
be rapid in order to minimise segregation of ice; the samples must then be kept
cold while the host crystals are cleaved or fractured, given a conducting coat-
ing, and transferred to a cold stage in the instrument. Ayora and Fontarnau
(1990) used standards consisting of frozen solutions containing different
known amounts of Na, K and Ca chlorides, for quantitative analysis of frozen
natural fluids of similar composition. The beam current must be low in order
to avoid damage to the sample.
150 X-ray analysis (2)
8.9.7 Analysis in low vacuum
Scanning electron microscopy in the ‘low-vacuum’ or ‘environmental’ mode,
which is useful for samples that are hydrous and/or uncoated (Section 3.10.2),
can be combined with X-ray analysis, with certain provisos. The gas pressure
in the sample chamber is too low for there to be any significant effect on the
detection of the X-rays from the specimen, but additional peaks (e.g. O K from
water molecules) may appear owing to the interaction of electrons with gas
atoms. More importantly, scattering by gas atoms causes an extensive ‘skirt’ to
exist around the electron beam, which can excite X-rays from surrounding
objects, thereby degrading the effective spatial resolution. Various measures
can be applied to minimise this effect, including using a high accelerating
voltage, a gas of low atomic number, low gas pressure and minimum electron
path length in the gas. Various methods for correcting X-ray analyses for the
residual effect remaining even when such steps are taken have been proposed
(Newbury, 2002).
8.9 Special cases 151
9
Sample preparation
9.1 Initial preparation of samples
Most geological specimens require some preliminary treatment before mount-
ing for examination in the SEM or analysis by EMPA. Often cleaning is
necessary in order to eliminate unwanted contaminants. Sediments (and
soils) commonly need drying. Friable and porous materials usually require
impregnation, especially if polished samples are to be produced. Hand speci-
mens have to be cut to a slice of an appropriate size for mounting and
polishing. These processes are described in the following sections.
For further information on these and other aspects of specimen preparation
the reader is referred to Humphries (1992), Laflamme (1990), Miller (1988),
and Smart and Tovey (1982).
9.1.1 Cleaning
As collected, many samples contain unwanted components, which hinder exam-
ination of the specific features of interest and need to be removed. For example,
sediments and soils often require washing with distilled water to remove soluble
salts (mainly chlorides). Only gentle agitation should be used as a rule, ultra-
sonic cleaning being liable to damage the mineral grains. Unwanted carbonate
can be removed with hydrochloric acid, iron oxides with stannous chloride and
organic matter with potassium permanganate or hydrogen peroxide.
Hydrocarbons can be removed by soaking in a solvent such as trichloroethane
(pressure may be required in the case of low-porosity materials).
9.1.2 Drying
Some sample materials are wet in their normal state and must be dried. This
can be carried out by gentle heating in air (temperatures above about 50 8C can
152
cause loss of structural water from clay minerals). Other approaches are
required, however, when fragile structures need to be preserved. Damage can
be limited by replacing water with a volatile liquid of lower surface tension, such
as amyl acetate, before drying. Other techniques, developed for drying fragile
biological materials, can be adapted for clays and soils (McHardy, Wilson and
Tait, 1982). For example, in ‘freeze drying’ water is removed from the frozen
sample by sublimation in vacuum. The sample must be frozen rapidly to mini-
mise growth of ice crystals: this is achieved by immersing the sample (which
should be as small as possible) in a liquid cooled by liquid nitrogen.
The least damaging, but slowest, technique is ‘critical-point drying’, which
relies on conversion of liquid into vapour above the temperature of the critical
point, so that there is no phase change. For water this temperatu re is inconve-
niently high, so the water in the sample is replaced by a more suitable liquid before
drying. A typical procedure entails replacing the water first by methanol, then by
liquid carbon dioxide. The sample temperature is raised just above the critical
point of the latter (32 8C) and carbon dioxide is vented slowly from the chamber.
9.1.3 Impregnation
Friable materials require impregnation with a suitable medium such as a low-
viscosity epoxy resin to impart the necessary mechanical strength for normal
specimen-preparation procedures to be applied. Also, the filling of pores and
cavities is desirable in order to avoid entrapment of polishing materials etc.
and outgassing in the instrument vacuum. In some cases it is desirable to dilute
the medium with a solvent such as toluene or acetone.
The effectiveness of impregnation can be improved by removing air in a
vacuum chamber and then applying atmospheric pressure to force the medium
into the pores. This can be achieved by lowering the sample into a liquid medium
under vacuum, then admitting air. (For epoxy resins the pressure should not be
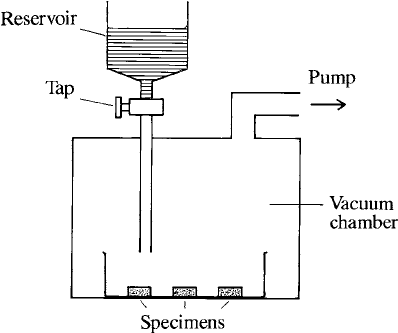
below 10 torr, or excessive frothing will occur.) Alternatively, the liquid medium is
poured onto the sample (Fig. 9.1) and, on admitting air into the sample chamber,
is forced into the pores. To achieve maximum penetration, several pumping and
venting cycles may be necessary. Higher pressures can be applied by using gas
from a cylinder. Gamberini and Valdre
`
(199 5) have described a preparation
procedure for pumice, involving repeated vacuum embedding and grinding.
9.1.4 Replicas and casts
For applications in which pore structures are of interest, it is useful to produce
replicas or casts for examination in the SEM. This entails impregnation, as
9.1 Preparation of samples 153
described above, followed by dissolution of the sample material, using hydro-
chloric acid for carbonates and hydrofluoric acid for silicates. Repeated
pumping and venting cycles can be used to obtain maximum penetration by
the medium. Details of methods suitable for chalk specimens have been given
by Walker (1978) and Patsoules and Cripps (1983).
Latex rubber casts of fossil plant impressions can be used for scanning
electron microscopy (Chaloner and Gay, 1973). Latex may be applied in
several successive layers, allowing each to dry before applying the next. The
resulting cast is adequately resistant to vacuum and electron bombardment for
SEM examination.
9.1.5 Cutting rock samples
Hand specimens of rocks require cutting to give pieces of suitable size and
shape for mounting and polishing. Usually cutting is done with a circular
diamond saw, a parallel-sided slice (typically a few millimetres thick) being cut
off and then trimmed to the size required for the mounted section. Friable
specimens need to be impregnated (as described in Section 9.1.3) before cutting.
Damage to the specimen occurring during these operations may extend to
considerable depth, possibly affecting the final product; therefore the methods
used should be as gentle as possible.
Fig. 9.1. Vacuum impregnation: the chamber is evacuated to remove air from
pores in specimens; liquid embedding medium (e.g. epoxy resin) is intr oduced
by opening a stopcock; on venting the chamber, medium is forced into pores
by air pressure.
154 Sample preparation