N?lting B. Methods in Modern Biophysics
Подождите немного. Документ загружается.

6.1 Transmission electron microscope (TEM) 113
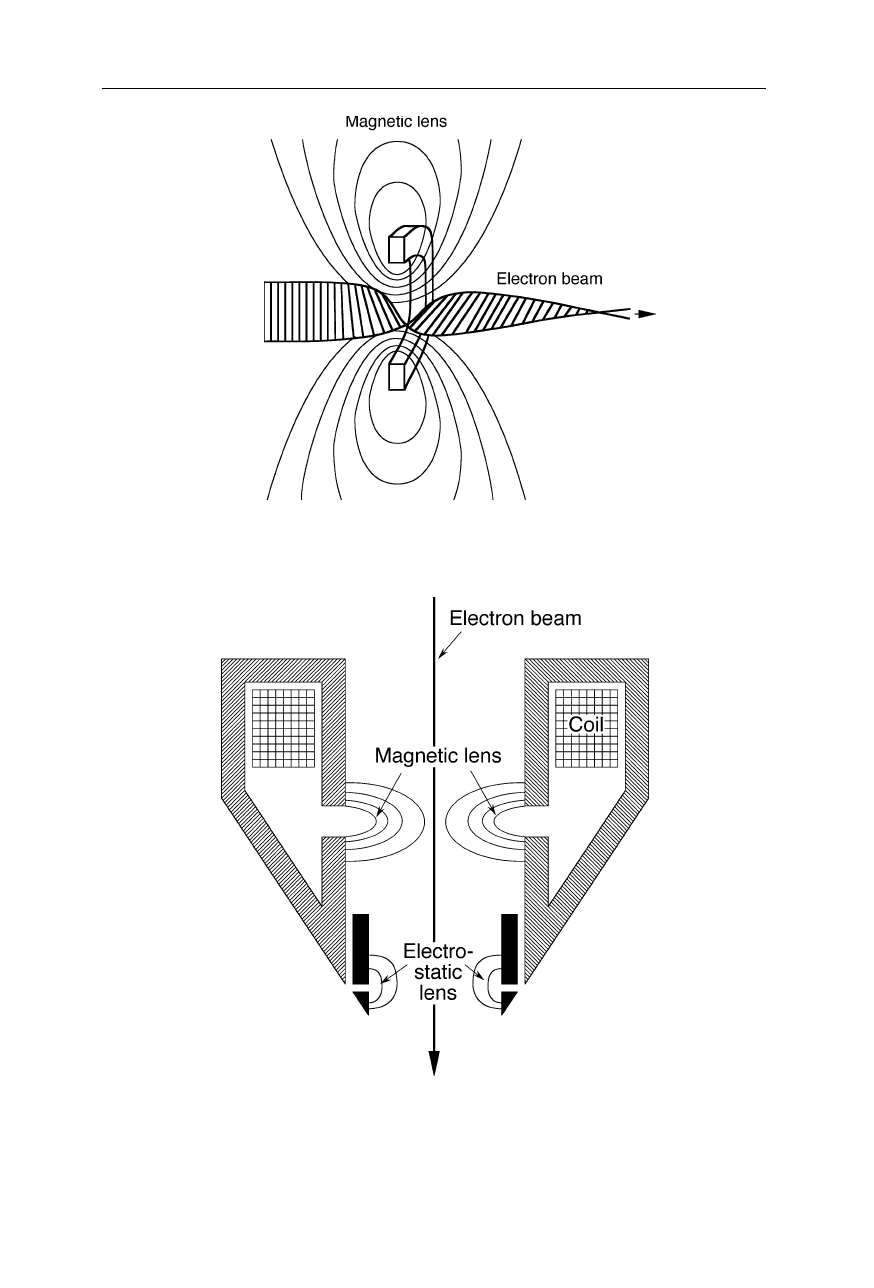
Fig. 6.9
Function of a magnetic electron lens (pohlschuh lens). One of Ernst Ruska's major
achievements was the development of electron lenses
Fig. 6.10
Compound lens made from magnetic and electrostatic lenses: the magnetic field
forces the electrons on spiral-shaped trajectories; the electric field further decreases the
diameter of the electron beam. Additional coils may serve for the correction of spherical
aberration (not shown)
114 6 Electron microscopy
One important difference of electron optics compared with photon optics is the
mutual charge interaction of electrons in the beam. That is why electron optics is
often designed for beam paths with few if any intermediate crossovers.
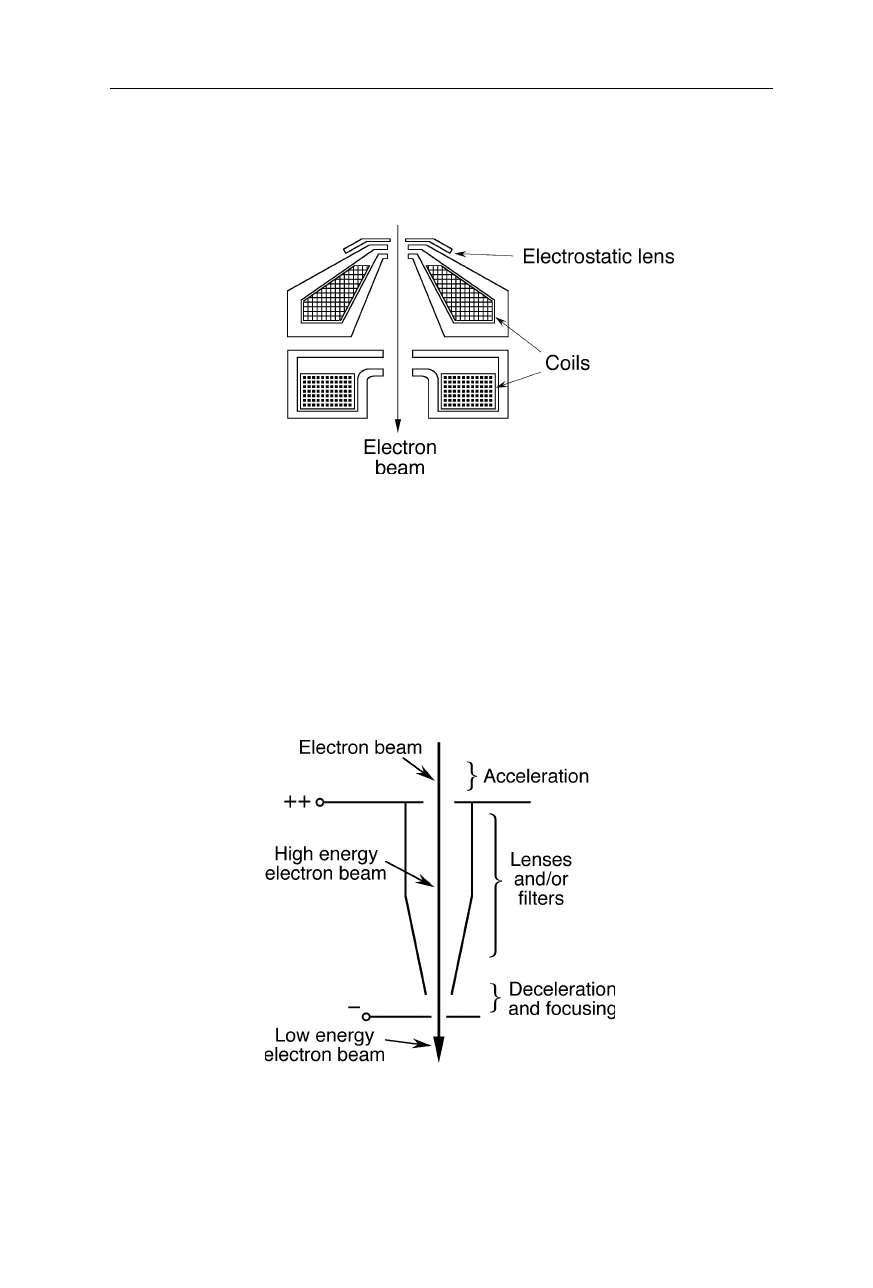
Fig. 6.11
Compound lens made from magnetic and electrostatic lenses
In the beam booster technique (LEO Elektronenmikroskopie GmbH, Ober-
kochen, Germany; Fig. 6.12) a high energy beam is generated, passed through the
condenser column of the microscope, and then decelerated and passed through the
sample. The high energy electrons are less affected by stray magnetic and electric
fields. Also the propagation of the electrons in the column is independent from
the selected electron probe energy.
Fig. 6.12
Beam booster (LEO Elektronenmikroskopie GmbH, Oberkochen, Germany).
The electrons are accelerated to a high energy, passed through condenser lenses and filters,
and then decelerated prior to interacting with the sample. This technique largely protects
the electron beam against stray magnetic fields in the column of the microscope
6.1 Transmission electron microscope (TEM) 115
6.1.6 Electron-sample interactions and electron spectroscopy
There are different sources of chromatic aberration: (a) inelastic scattering of the
electrons by the sample changes their energy (Fig. 6.13), and (b) the electrons
leave the electron source with slightly different energies. The dispersion of
electron energy is measured with energy filters (Fig. 6.14). Similar dispersive
elements serve for the reduction of chromatic aberration, i.e., the selection of
monochromatic electrons (Figs. 6.14 and 6.15)
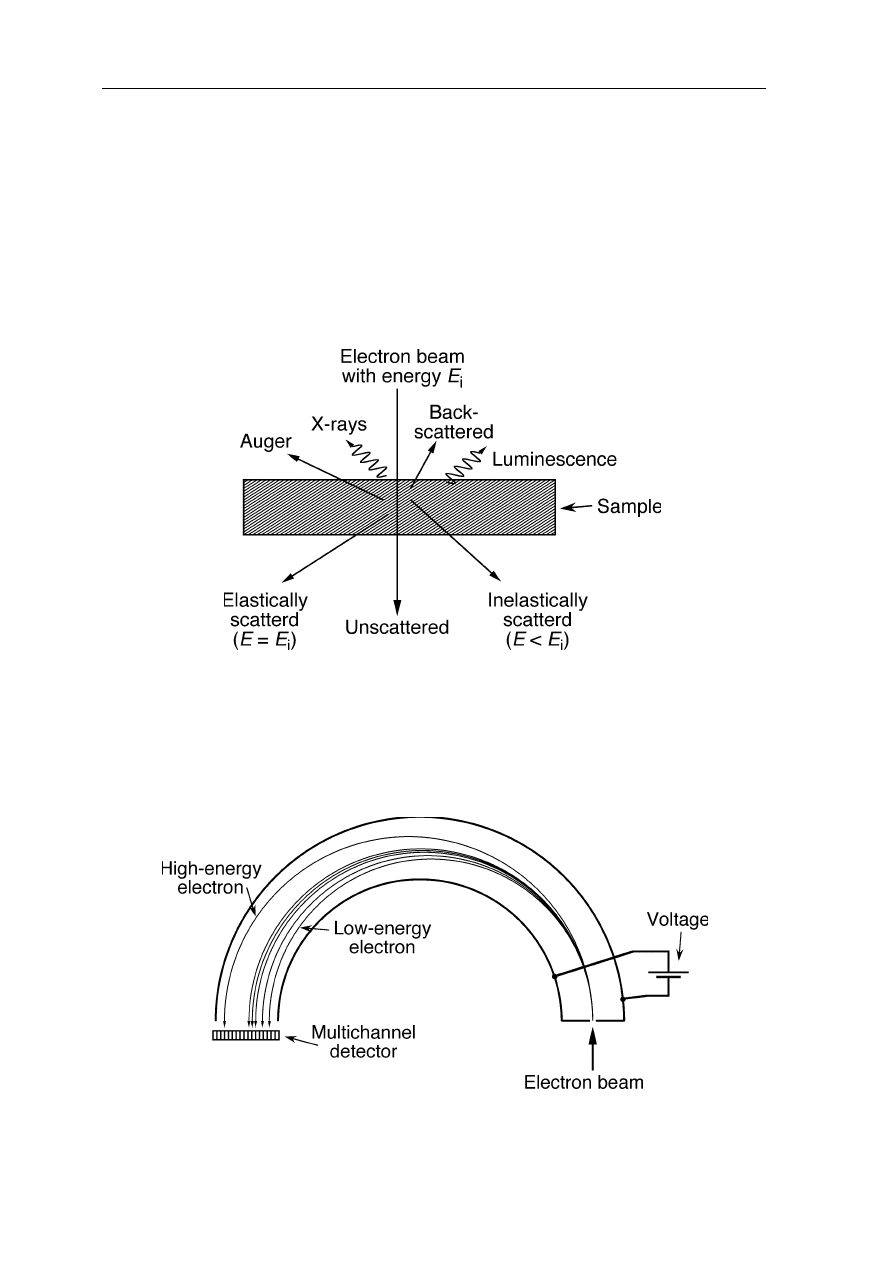
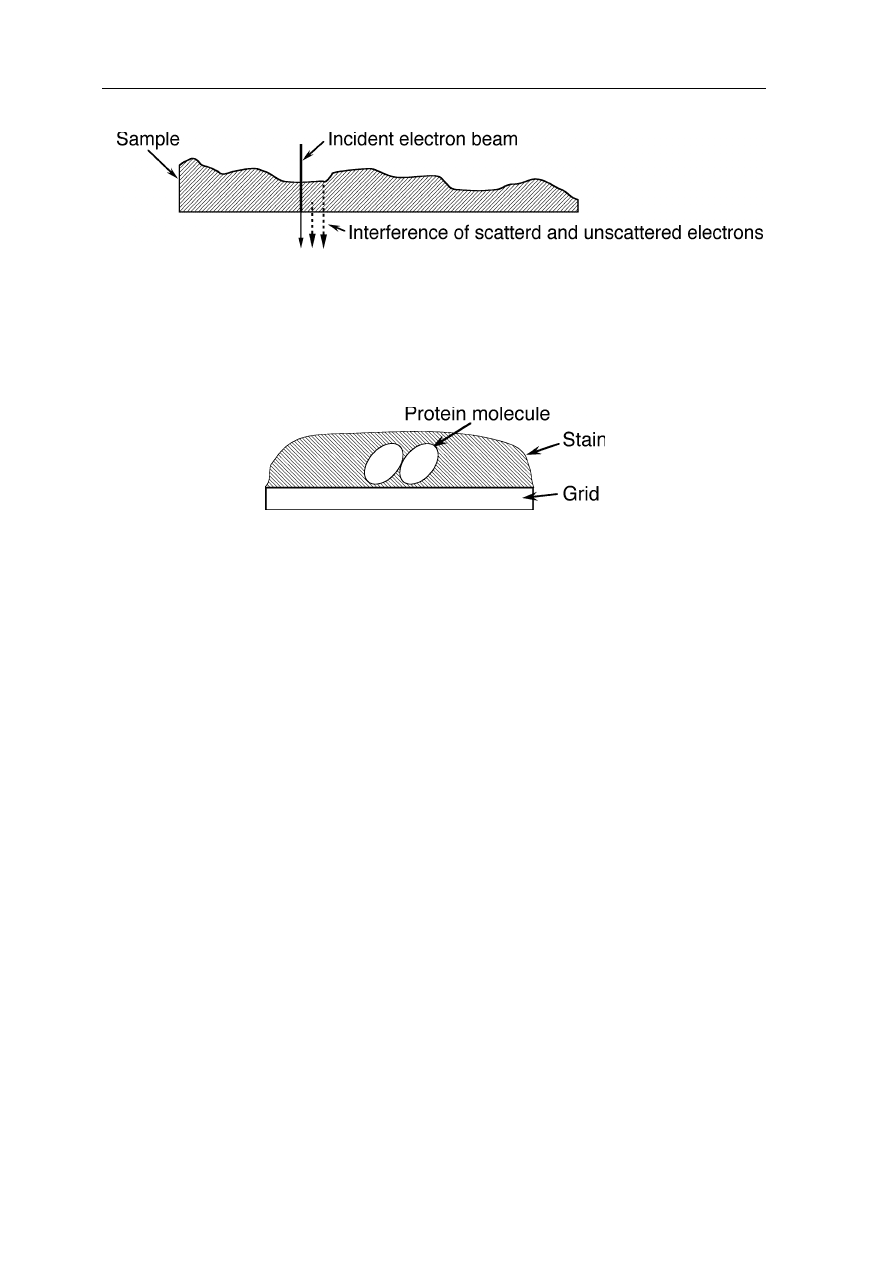
Fig. 6.13
Interaction of the electron beam with the sample. Inelastically scattered
electrons have changed both direction and energy and may generate a diffuse contrast-
reducing background image unless these electrons are eliminated by energy filtering (see
Fig. 6.15). Elastically scattered electrons interfere with another and with unscattered
electrons to produce a phase contrast image
Fig. 6.14
Determination of electron energies. The voltage applied between the two
hemispherical electrodes disperses the electrons with respect to their velocity. In order to
record a full spectrum for a large range of electron energies, the applied voltage is swept
116 6 Electron microscopy
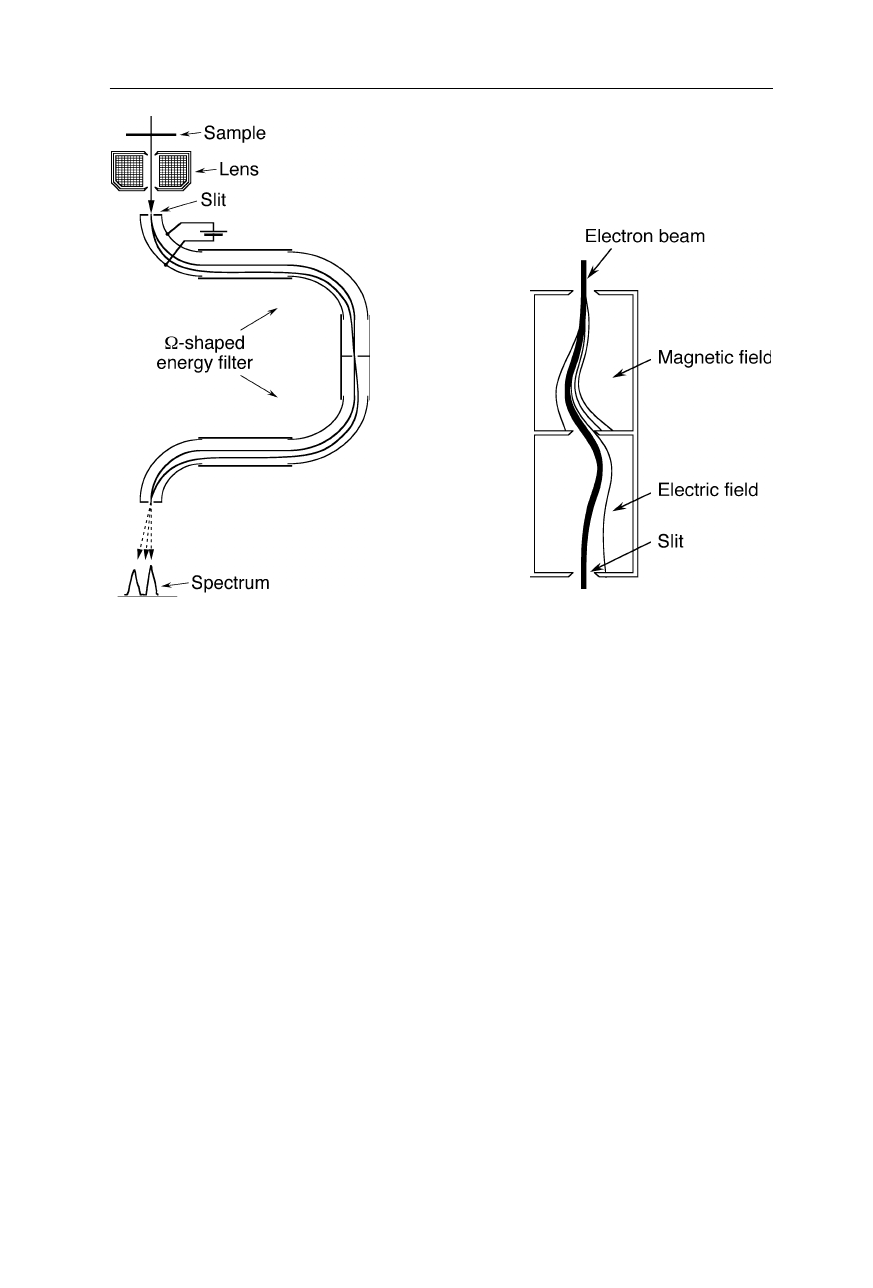
Fig. 6.15
Two types of dispersive elements for energy filtering of the electron beam to
eliminate inelastically scattered electrons, removing the diffuse background and thereby
enhancing contrast, or to perform a chemical analysis of the sample. Left:
Ω
-filter. Right:
filter using magnetic and electric fields
Phase differences due to differences in the optical pathlength and electron
scattering contribute to the contrast (Fig. 6.16). Often it is quite difficult to
generate sufficient sample contrast at very high resolutions. A common method to
visualize very small biological structures, such as single protein molecules, is
negative staining: the sample is embedded in a stain with strong electron-optical
properties (Fig. 6.17). Important innovations towards better contrast were the
introduction of a technique for enhanced resolution (Haider et al., 1998) and the
nanofabrication of solid-state Fresnel lenses for electron optics (Ito et al., 1998).
For biological samples a further important reason for the limitation of the
resolution of TEMs is radiation damage, i.e., the destruction of the sample by
inelastically scattered electrons. Since a certain number of electrons is necessary
to obtain an image, this limit depends on the ratio of inelastically to elastically
scattered electrons. Practically the resolution of frozen protein molecules is re-
stricted by this reason to worse than about 5 Å. Negatively staining (Fig. 6.17)
may provide some improvement, nevertheless atomic resolution of proteins is still
beyond reach. It was suggested the theoretical possibility of a neutron micro-
scope, for which the ratio of elastically to inelastically scattered particles may
much
better for isotope-exchanged proteins (Henderson, 1996). Another theoreti-
6.1 Transmission electron microscope (TEM) 117
Fig. 6.16
Generation of amplitude contrast. The electron beam is weakened at different
points to a different degree by scattering and interference: elastically scattered electrons,
i.e., those which have changed direction but not energy, interfere with each other and with
unscattered electrons to produce a phase contrast image
Fig. 6.17
Edge-on view of a negatively stained sample: the TEM senses volumes of lower
density in the stain
cal possibility to overcome the problem of the decay of the structure of sample
during the measurement might be the use of ultrashort electron flashes on deeply
frozen samples: if the duration of the flash is shorter than the time of mechanical
movement of the protein molecule, its chemical decomposition would affect the
obtained micrograph to a lesser degree.
6.1.7 Examples of biophysical applications
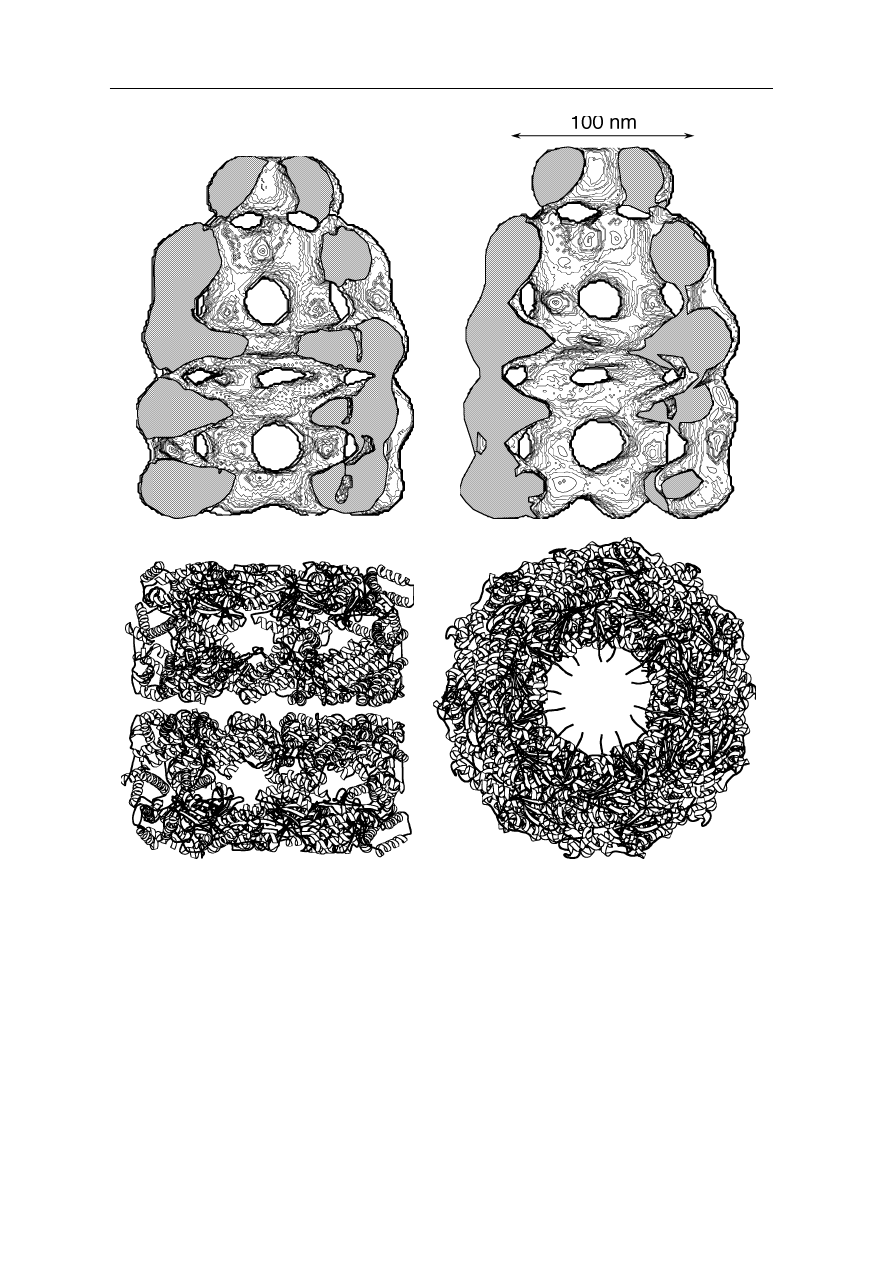
Fig. 6.18 demonstrates the resolution power of TEM for large protein complexes
(Roseman et al., 1996; White et al., 1997; Ranson et al., 1998; Rye et al., 1999;
Saibil, 2000a). Clearly differences between two conformations of GroEL/GroES
are resolved. The TEM structure is consistent with the crystal structure.
Electron microscopy resolved the structure of the bacteriophage
Φ
29 packaging
motor (Simpson et al., 2000) and visualized the filamentous phage pIV multimer
(Linderoth et al., 1997). Electron microscopy contributed to the understanding of
conformational changes connected with the opening of an ion channel through a
membrane (Saibil, 2000b), and with connexin trafficking (Gaietta et al., 2002).
In groundbreaking experiments Terry G. Frey and coworkers succeeded in the
3D-visualization of cell organelles using electron tomography. In this method the
three-dimensional structure is calculated from a series of electron micrographs of
samples tilted over a range of angles (Dierksen et al., 1992; Perkins et al., 1997a,
1997b; Frey and Mannella, 2000).
118 6 Electron microscopy
Fig. 6.18
Top: electron micrograph of two conformations of GroEL/GroES at 30 Å
resolution (Roseman et al., 1996; White et al., 1997; Ranson et al., 1998; Rye et al., 1999;
Saibil, 2000a). Bottom: the X-ray crystal structure of GroEL at 2.4 Å resolution for
comparison (Braig et al., 1994; Boisvert et al., 1996). The latter figure part was generated
using MOLSCRIPT (Kraulis, 1991)
6.2 Scanning transmission electron microscope (STEM)
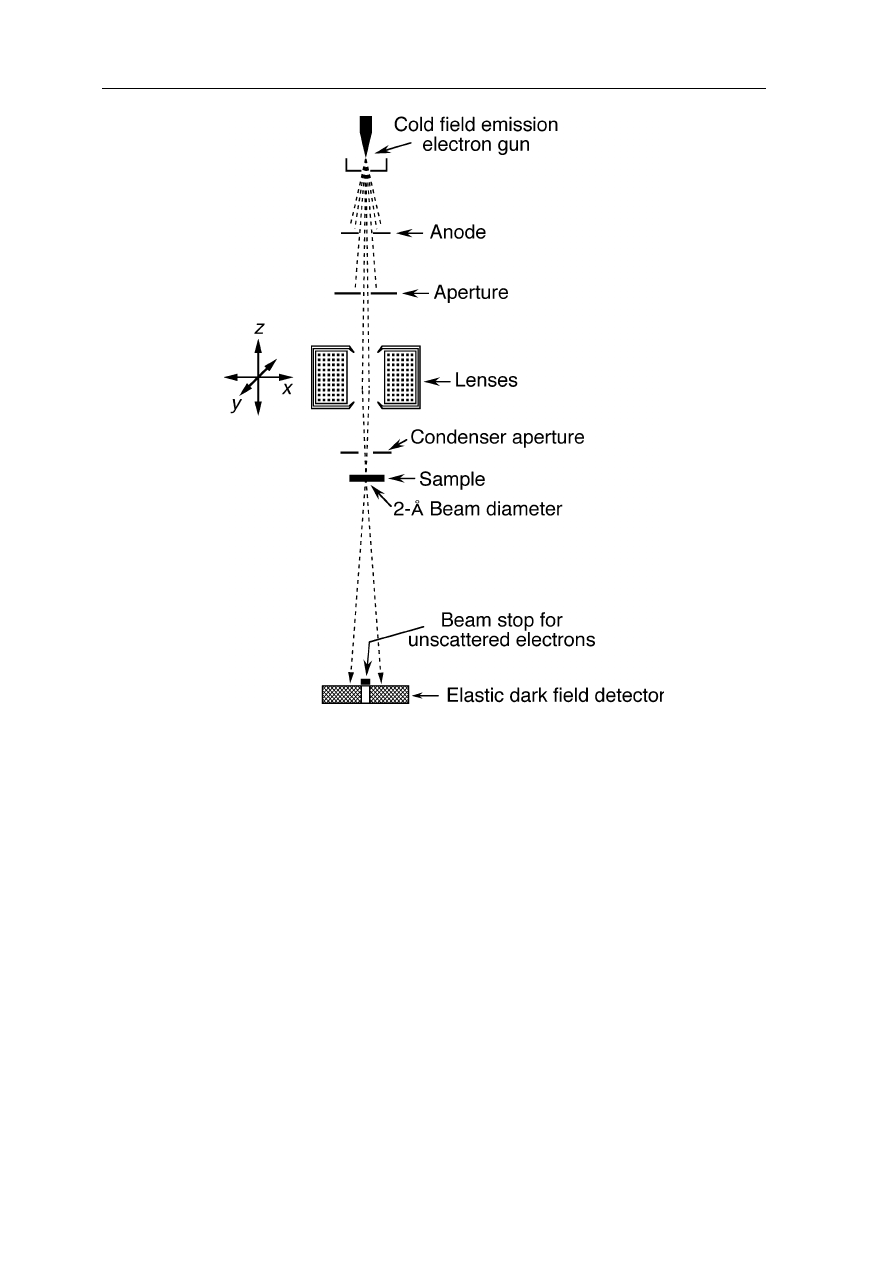
In contrast to TEMs, scanning transmission electron microscopes use an electron
beam with only a few Å or nm diameter to scan the sample area (Fig. 6.19). The
resolution is generally limited by the diameter of the electron beam at the location
of the sample and radiation damage.
6.2 Scanning transmission electron microscope (STEM) 119
Fig. 6.19
Scheme of a scanning transmission electron microscope: The objective lens
focuses the electron beam onto a small sample section. Scattered electrons are detected
with the elastic dark field detector. The STEM image is generated by moving the focussed
beam over the specimen
Although the STEM was pioneered already in the thirties of last century,
mainly by adding scan coils to a TEM (von Ardenne, 1940), significant
developments have taken place in the last years: electron optics has been
significantly improved and the resolution increased by several orders of
magnitude. Nowadays high resolution STEMs offer unprecedented capability for
the characterization of biomolecules, allowing structure to be determined with up
to sub-nm resolution.
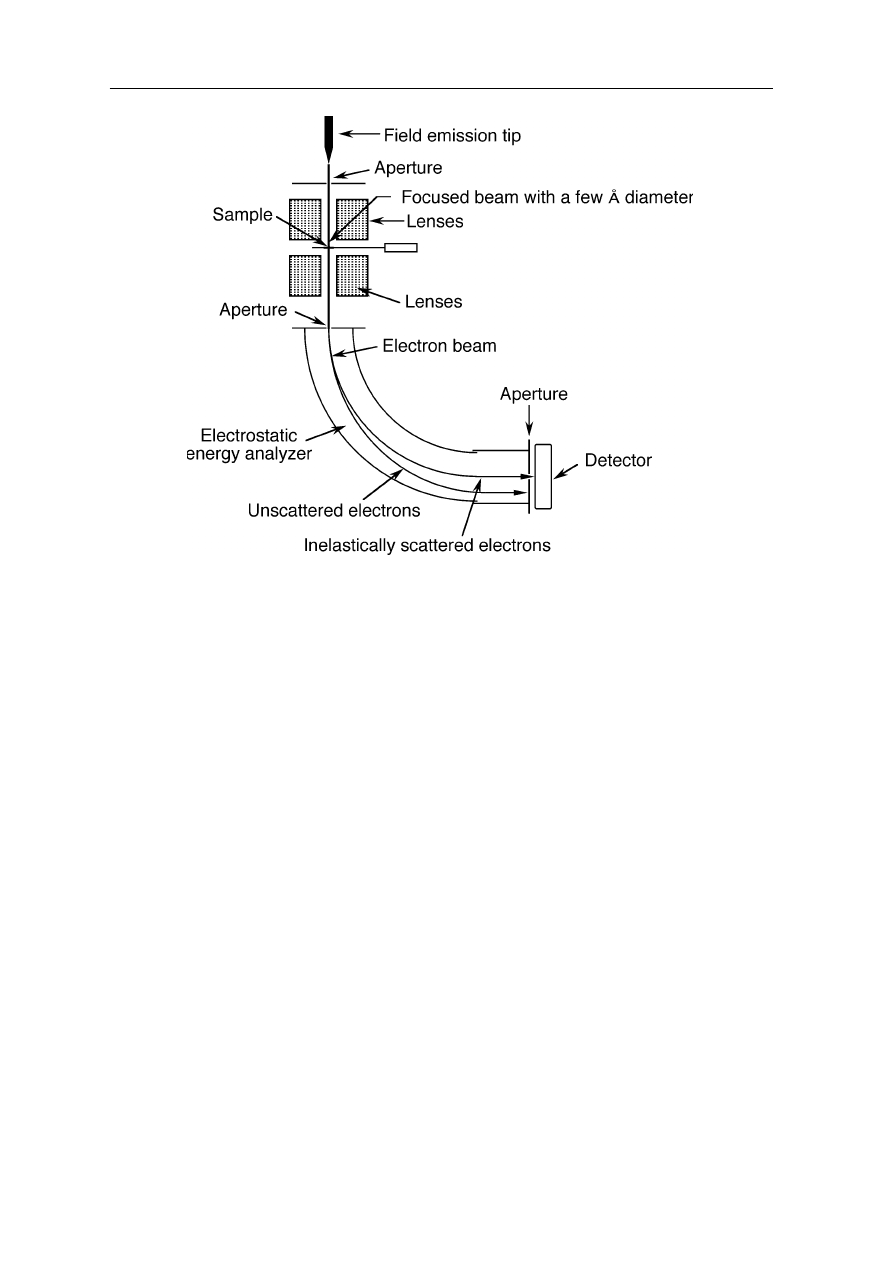
Similarly to TEMs, the STEM can employ various energy filtering techniques
for chemical analysis and improvement of resolution, e.g., by removing
unscattered electrons in inelastic dark field imaging (Fig. 6.20). Many STEM
have both capabilities, elastic dark field imaging (Fig. 6.19) and inelastic dark
field imaging (Fig. 6.20). A third mode is bright field detection where electrons
are
collected through a small aperture placed on the optical axis and an energy
120 6 Electron microscopy
Fig. 6.20
Example of a scanning transmission electron microscope with an energy filter:
inelastically scattered electrons, i.e., those which have changed both energy and direction
upon interaction with the specimen, are collected yielding the inelastic dark field image.
Electrons with different energies are separable by their trajectories with different curvatures
in the electric field applied perpendicular to the flight direction
filter removes those electrons that have lost energy, i.e., low-angle elastically
scattered and unscattered electrons are collected to produce the image.
7 Scanning probe microscopy
Scanning probe microscopes generate a highly-resolved image of the specimen by
scanning it with a small mechanical, electrical, optical, thermal, or other probe.
7.1 Atomic force microscope (AFM)
The AFM was invented by Gerd Binnig, Christoph Gerber, and Calvin F. Quate in
the mid-eighties (Binnig et al., 1986), and is one type of the so-called scanning
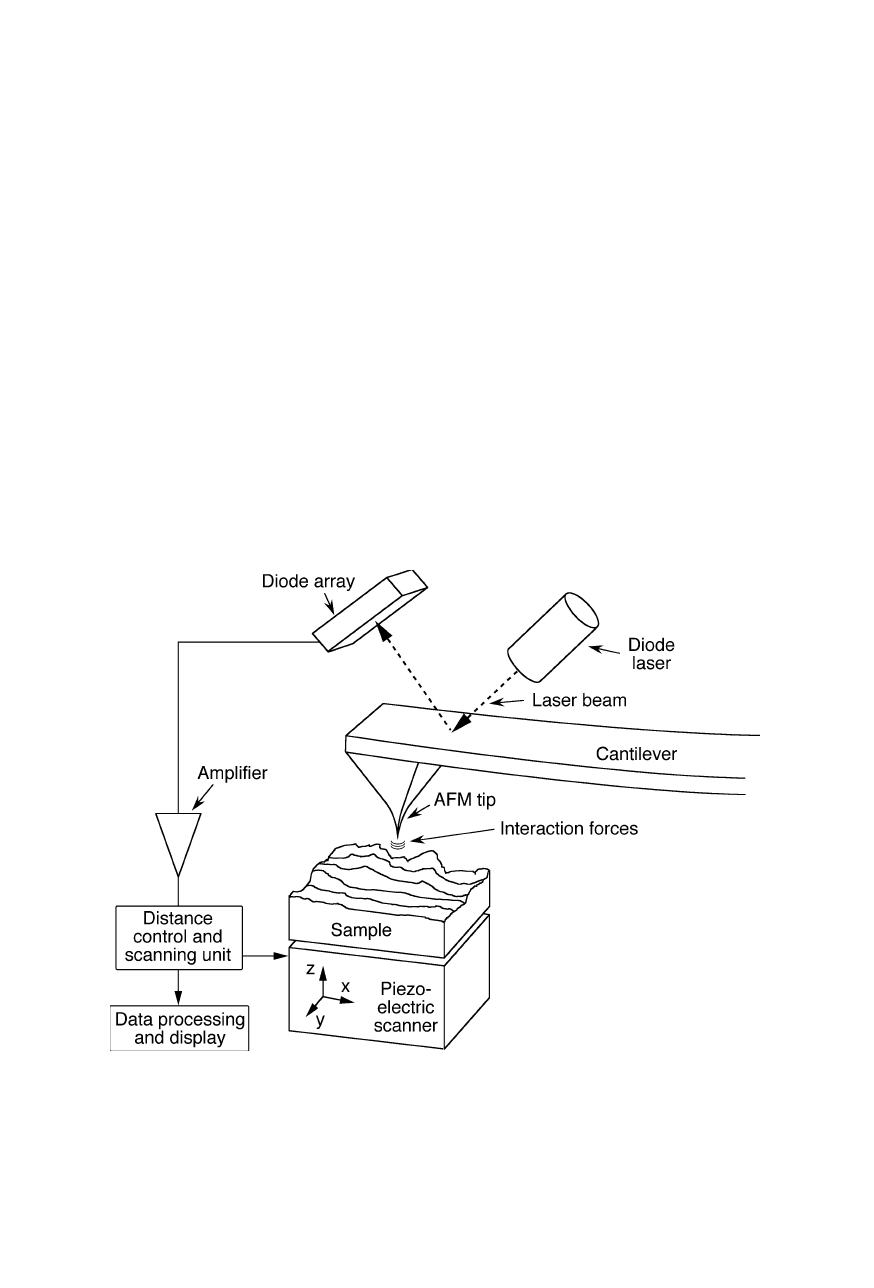
Fig. 7.1
Principle of operation of an atomic force microscope. A very sharp tip attached to
a tiny cantilever probes the sample surface. An optical system comprised of diode laser
and detector, e.g., a diode array or a position-sensitive diode, senses the bending of the
cantilever and thereby the distance-dependent tip-sample interaction force. For scanning
the surface, the sample is moved by the piezoelectric scanner (Binnig et al., 1986)
122 7 Scanning probe microscopy
probe microscopes (SPMs) which also include scanning tunneling microscope
(STM; Sect. 7.2; Binnig et al., 1982a, 1982b, 1983; Binnig and Rohrer, 1987),
scanning near-field optical microscope (SNOM; Sect. 7.3), scanning thermal
microscope (SThM; Sect. 7.4), and the scanning ion conductance microscope
(SICM; Sect. 7.4). The AFM is used in both industrial and fundamental research
to obtain atomic-scale images of metal surfaces and nanometer-scale images of the
three-dimensional profile of the surface of biological specimens. It is a very useful
tool for determining the size and conformation of single molecules and aggregates
adsorbed on solid surfaces. The AFM scans the sample with a tiny tip mounted on
a small cantilever (Fig. 7.1). It measures the small force of interaction between tip
and sample surface by sensing the reflection changes of a laser upon cantilever
movement caused by interaction with the sample. An image of the sample surface
relief is recorded using piezoelectric translation stages that move the sample
beneath the tip, or the tip over the sample surface, and are accurate to a few Å.
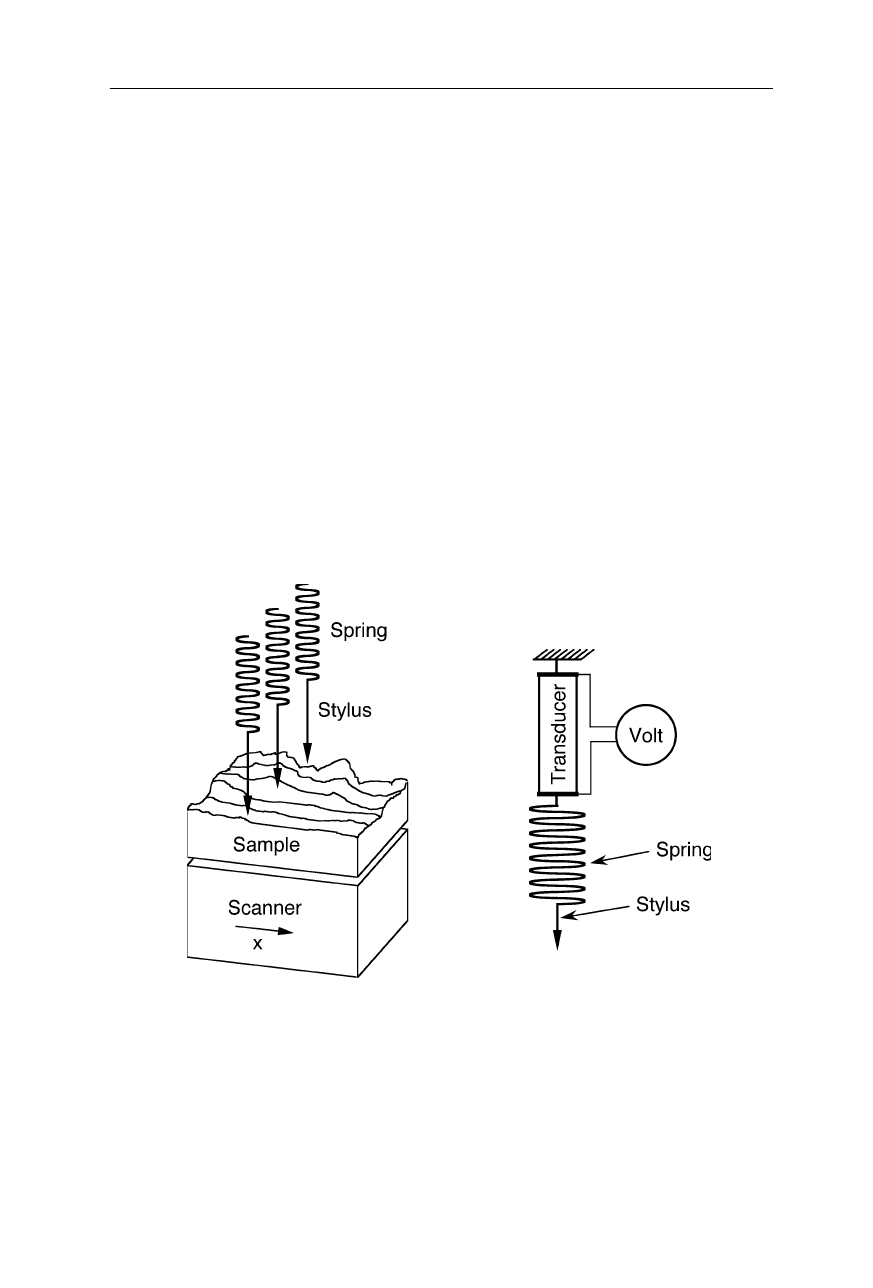
Note the similarity of the AFM (Fig. 7.1) to the stylus profilometer (Fig. 7.2)
and to the STM (Fig. 7.19). Actually, the idea of AFM is based on the design of
stylus profilometers, but the AFM can reveal the sample relief with subnanometer
resolution.
Fig. 7.2
Stylus profilometer for comparison with the AFM. A set of styli probes the
sample which is drawn below the set of styli. The small motions of the styli are
transformed into an electrical signal by linear, variable transducers. Step heights of down
to a few 10 nm are resolvable
The force of tip-sample interaction (Fig. 7.3) has a magnitude of typically only
a few pN – nN. That is why the cantilever must have a small mass, and the