Morris & Fan. Reservoir Sedimentation Handbook
Подождите немного. Документ загружается.

CASE STUDY: HEISONGLIN RESERVOIR, CHINA 25.5
Portion of lost storage capacity. The stable long-term capacity that can be maintained at
Heisonglin by all sediment management techniques is about 2.5 to 3.0 Mm
3
, or 20
percent of mean annual inflow.
25.3 SEDIMENT MANAGEMENT STRATEGIES
The original operating mode of Heisonglin Reservoir was for continuous impounding.
Sediment management was initiated by modifying this operating mode to incorporate
seasonal emptying during July and August when most sediment enters the
impoundment. Turbid density currents were also vented whenever possible. Reservoir
operations during an annual cycle incorporating seasonal drawdown are summarized in
Fig. 25.4.
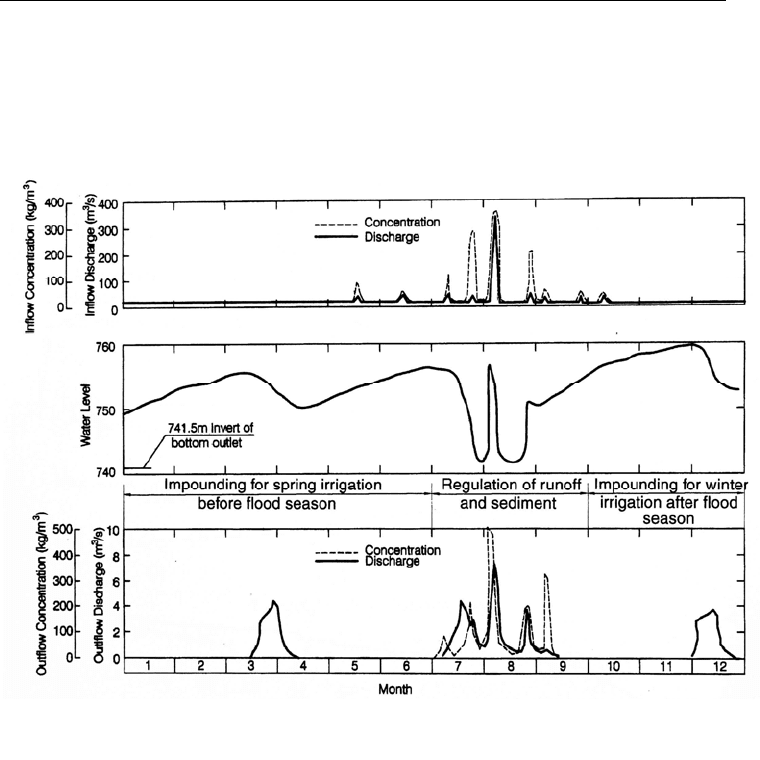
FIGURE 25.4 Annual operational cycle for Heisonglin Reservoir incorporating seasonal emptying
(after Northwest Institute of Hydraulic Research, 1983).
During the early part of the summer flood season when both flow and suspended
solids concentration are low, the reservoir impounds water but turbidity currents are
released downstream for irrigation. The middle flood season, July and August, is
characterized by intense rainstorms, and both flows and suspended-sediment
concentrations are high. During this period the reservoir is emptied and operated to release
floods at the maximum capacity of downstream irrigation diversions. Because the silts
settle slowly in the high-concentration fluid, if the flood can be discharged within 2 days,
about 70 percent of the sediment can normally be released (Xia, 1987). In addition, as the
reservoir is emptied at the end of each flood and riverine flow is again established,
deposited silt is scoured out by flushing action. At the end of the flood season, the base
flow is high and suspended-sediment concentration is low, and during this period the
reservoir impounds water for winter irrigation deliveries in December. The reservoir
CASE STUDY: HEISONGLIN RESERVOIR, CHINA 25.6
impounds water and is again emptied for spring irrigation deliveries in late March.
Impounding then continues again until summer irrigation deliveries in July, after which
the reservoir remains empty for flood season sediment release.
Although the reservoir remains empty during the July and August flood season, it still
captures floodwater and diverts all inflow to irrigation. Between floods, the river flows
freely through the reservoir, exits the open bottom outlet, and is diverted into irrigation
intakes farther downstream along the river. Seasonal floods that exceed the capacity of
the irrigation intakes are temporarily impounded and released to irrigators at the
maximum capacity of the downstream irrigation diversions, thereby minimizing the
period of floodwater detention and sediment deposition in the reservoir. Lateral erosion is
also performed during this drawdown period. The exception to this procedure occurs
during dry years, when the reservoir continuously impounds and sediment-laden inflows
are released as density currents. Between 1962 and 1978, a total of 61 Mm
3
of water
containing 13 Mt of sediment was released to irrigators during the seasonal drawdown
period. The average suspended solids in the released water was about 210 g/L.
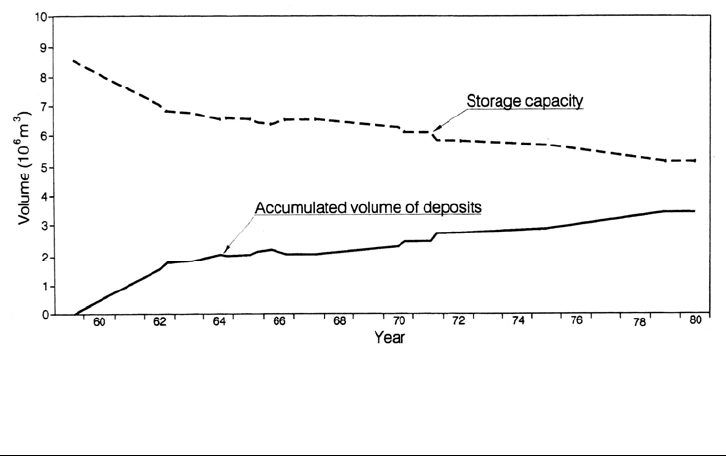
Procedures for lateral erosion were developed which allowed part of the lost flood-
plain storage to be recovered, and, when used in conjunction with other methods, allows
a sustainable sediment balance to be achieved (Fig. 25.5). Lateral erosion by a discharge
of 0.2 m
3
/s carried away 4000 m
3
/day of sediment deposits from the reservoir. By using
this flow rate for approximately 40 days per year, in combination with seasonal
emptying, it was possible to develop an equilibrium between sediment inflow and
discharge (Xia, 1993).
FIGURE 25.5 Variation in storage capacity, Heisonglin Reservoir (after Northwest Institute o
f
H
ydraulic Research, 1972b).
25.4 WARPING
A unique feature of Heisonglin is that, not only is a sediment balance achieved in the
reservoir, but both water and sediment are diverted to beneficial use. Operation of the
dam is guided by the slogan, "Release not a drop of water nor a particle of sediment to
Wei River." The ability to irrigate during the summer flood season with water having
sediment concentrations of hundreds of grams per liter is an essential aspect of sediment
management at Heisonglin and other reservoirs in the loess region of China. Irrigation
with high or hyperconcentrated (typically over 200 g/L) flows of muddy water, a practice
termed warping, has been used for at least 2000 years in China; the use of muddy flows
containing several parts of silt per 10 parts of volume is described in the Han Dynasty
CASE STUDY: HEISONGLIN RESERVOIR, CHINA 25.7
(206 B.C. - 25 A.D.) "Record of Ditches" archives. The silt-laden water enhances soil
fertility by providing nutrients, increasing organic matter content, and improving
moisture retention in coarse soils. Crop yields per hectare in the Heisonglin area almost
doubled between 1958, when dam construction started, and 1974, with most of the yield
increase occurring after warping was initiated (Zhang et al., 1976). Maximum
application depth of muddy water depends on the crop, ranging from 5 to 7 cm for corn
and Chinese sorghum, and from 3 to 6 cm for cotton (Cheng and He, 1989). Warping also
offers the benefit of diverting to the land sediment that would otherwise flow into
downstream reservoirs. Warping is facilitated at Heisonglin and other sites in the
Yellow River basin where traditional river diversions for irrigation were already
adapted to using the high-concentration flows that naturally occurred in the region, and
peasants applied muddy water to their fields prior to dam construction.
25.5 DEPOSITION PATTERNS
Because of the short length of the reservoir, steep gradient, and high inflowing sediment
concentration, during impounding periods turbidity currents travel to the dam and create
a submerged muddy lake. Sediments depositing from the muddy lake created longitudinal
floodplain deposits that were nearly horizontal in the reach near the dam. After seasonal
emptying was initiated, sediment continued to deposit in the same longitudinal pattern, but
with two important differences: the rate of the accumulation was lower, and a main
flushing channel was scoured through the deposits. During impounding and flood detention
periods, sediments were deposited on the floodplain and within the channel. Drawdown and
emptying eroded and flushed sediments out of the main channel, but the floodplain deposits
on either side of the channel remained and the surface of the floodplains rose continuously.
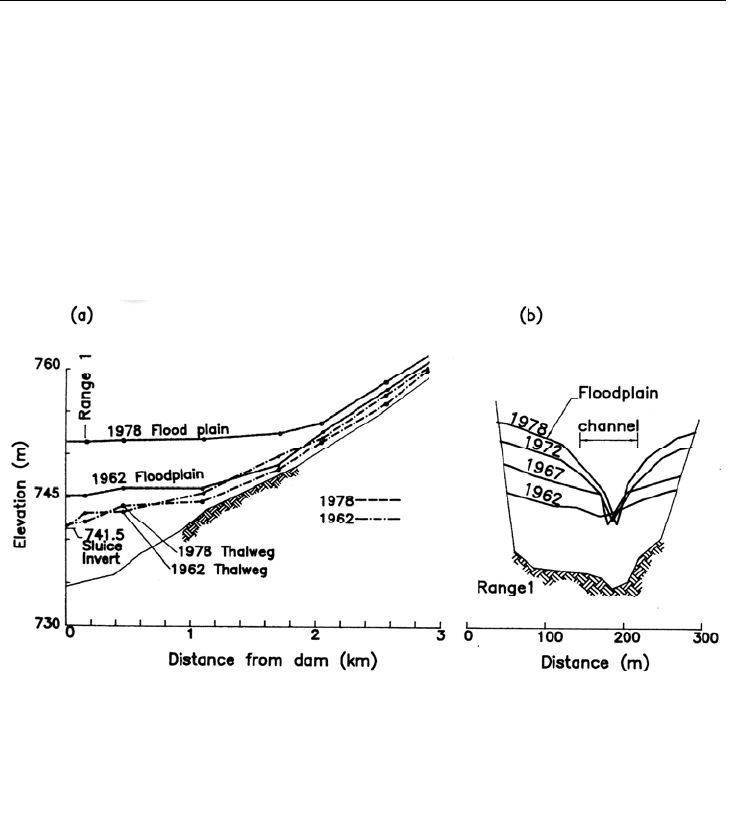
The resulting pattern of sediment accumulation is illustrated in Fig. 25.6, and the change in
one channel cross section during an annual cycle is illustrated in Fig. 25.7, which shows
FIGURE 25.6 Timewise pattern of sediment accumulation in Heisonglin Reservoir illustrate
d
using (a) longitudinal profiles along the flushing channel thalweg and the floodplain and (b)
successive cross sections at range 1. There is continual accumulation of sediments on the floodplains,
but the main channel is maintained by flushing (after Xia and Ren, 1980).
CASE STUDY: HEISONGLIN RESERVOIR, CHINA 25.8
the alternating periods of deposition and scour within the channel. In the narrow upstream
portion of the reservoir, the main channel occupies the entire reservoir width, preventing
flood- plain formation in this zone (see ranges 7 to 10 in Fig. 25.1).
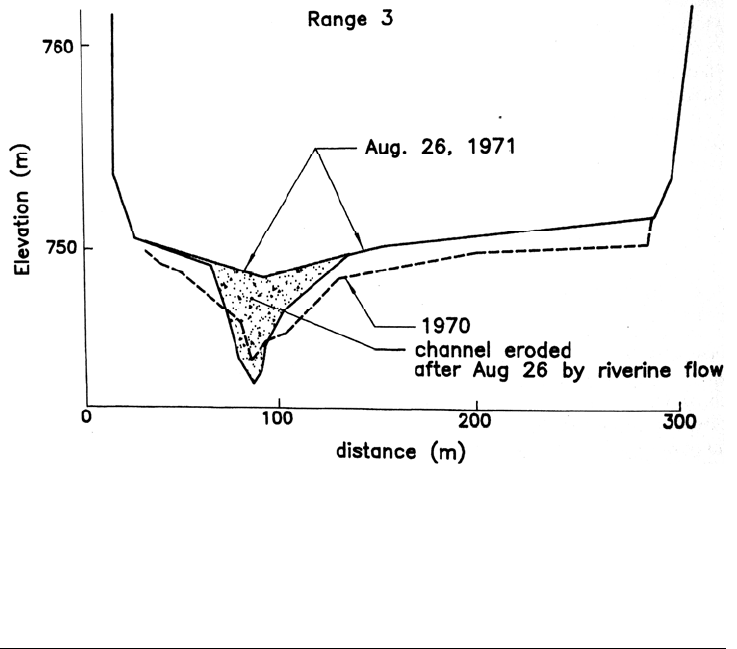
FIGURE 25.7 Sequence of sediment deposition and scour at range 3, Heisonglin Reservoir. The
sediments deposited in the main channel during the detention phase of the large August 20, 1971,
flood (shown in Fig. 25.8) were subsequently scoured out by river base flow. However, the floodplain
level rises continuously (after Northwest Institute of Hydraulic Research, 1972a).
25.6 SEDIMENT FLUSHING AND ROUTING
25.6.1 Drawdown Flushing
When the reservoir is emptied in July, the declining water levels initiate the erosional
processes associated with flushing, including bank sloughing, progressive erosion of
deposits along the main channel, and the progressive transport of sediments toward the
bottom outlet. A large and highly concentrated discharge of sediment occurs at the
transition from drawdown to flushing. Thereafter, smaller amounts of sediment are
removed by base flow and the small inflow events that can be released through the
bottom outlet with little backwater behind the dam, since flow runs along the already-
eroded main channel. At Heisonglin, the events with low peak discharges contribute
relatively little sediment. Flushing with large flood flows to widen the main channel
cannot be performed at Heisonglin because it is not compatible with the operational
objective at this site, which is to detain inflow and then release it at a low discharge rate,
allowing the diversion of all water for irrigation.
25.6.2 Detention Flushing
When floods entering the reservoir storage pool during the drawdown period exceed the
release rate to irrigators, the pool becomes partially filled with silt-laden water for periods
CASE STUDY: HEISONGLIN RESERVOIR, CHINA 25.9
of hours or days. Some of the main characteristics of temporary flood detention at
Heisonglin are shown in Fig. 25.8, which illustrates hydrograph behavior and reflects the
depositional and erosional processes during detention flushing of the large flood on
August 20-21, 1971. The flood contained 5.92 Mm
3
of water and 1.48 Mt of sediment, for an
average concentration of 250 g/L, and the reservoir was empty before the flood. Because of the
large flood volume and limited discharge rate, 6 days were required to release the
floodwaters.
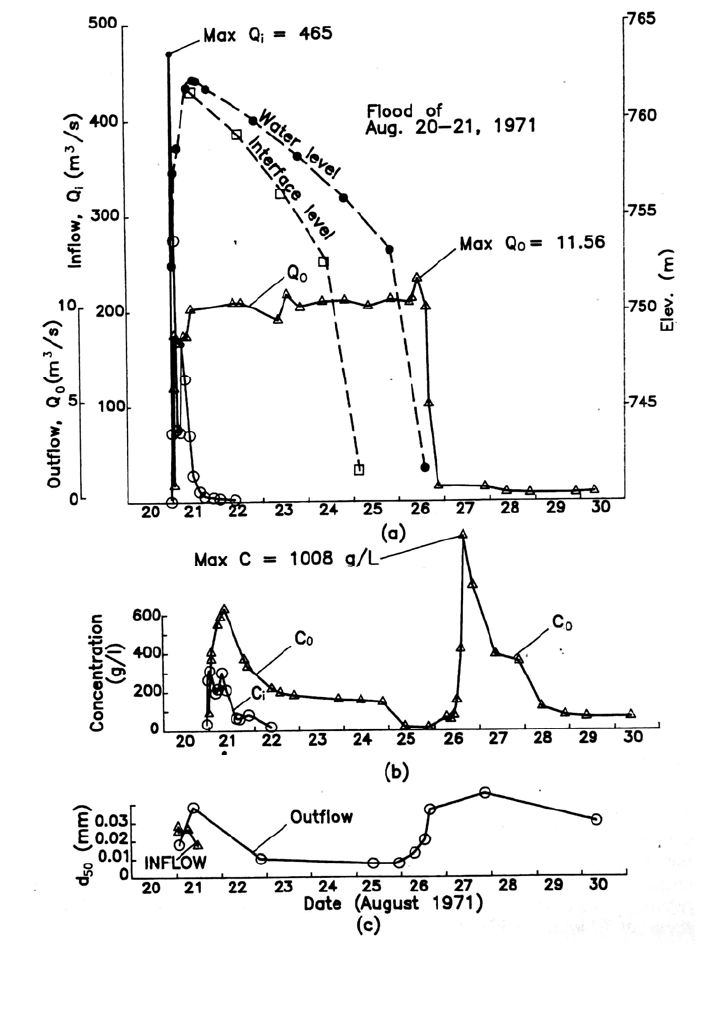
FIGURE 25.8 Characteristics of inflow and discharge at Heisonglin Reservoir during a large
detention flushing event. The volume of this flood equaled 42 percent of the mean annual discharge
(after Xia and Ren, 1980).

CASE STUDY: HEISONGLIN RESERVOIR, CHINA 25.10
Sediment continuously accumulated in the reservoir during the detention period, and
both sediment concentration and grain size in the discharge declined until the reservoir
was emptied on August 26, at which time both concentration and grain size values
suddenly peaked. In parts b and c of Fig. 25.8 it is seen that suspended solids
concentration and d
m
, were larger in the discharge from the dam than at the inflow
station, at both the beginning and the end of the event. Four factors may have contributed
to this phenomenon:
The rapid settling of coarser grains can create a hyperconcentrated bottom layer
within the muddy lake. Because the outlet is at the lowest elevation in the reservoir,
and as long as discharge is not so great that overlying clear water will be aspirated,
the discharge concentration will reflect conditions in this concentrated bottom layer.
Higher sediment discharge values at the beginning of the event may reflect the
scouring of channel deposits along the reach between the inflow hydrologic station and
the reservoir as the flood discharge increased, which would cause the inflowing sediment
concentration measured at the hydrologic station to be smaller than the concentration
actually entering the reservoir.
A vertical concentration profile was measured through the portion of the floodwaters
overlying the left floodplain at range 1 on August 23 (Table 25.2). Although the
mean concentration of 110 kg/m
3
measured within the muddy lake at range 1 is less
than the outflow concentration of approximately 180 kg/m
3
that same day (Fig.
25.8), the liquid mud at 9.22 m depth was highly concentrated and contained
larger grains because of the accelerated settling of layer particles. Settling is retarded in
this hyperconcentrated bottom layer of liquid mud, and the drainage of this
concentrated liquid mud from the submerged floodplain into the main channel may
have contributed additional sediment to the channel.
TABLE 25.2 Vertical Profile during Detention Flushing, Aug. 23, 1971, Range 1,
Heisonglin Reservoir
Water depth, m Concentration, g/L d,, mm Notes
2.56 177 0.0070 Turbidity interface
3.81 112 0.0082
4.81 120 0.0082
5.82 98 0.0094
6.82 112 0.0076
9.22 894 0.0160 Mud bottom
Source: Ren (1986).
When the reservoir was emptied on August 26, the outflow suspended-solids
concentration and grain size both increased because of the scouring of sediments
from the channel. On August 27 a base flow of about 1 m
3
/s flowed along the
flushing channel, continuing to scour sediments and discharge a hyperconcentrated
flow of relatively coarse material for another day. This riverine flow was responsible
for the scouring illustrated in Fig. 25.7.
As the flood entered the empty reservoir, a nonsubmerged muddy lake was formed initially,
which was transformed into a submerged muddy lake as a result of settling. The falling
interface between the muddy water and overlying clear water shown in Fig. 25.8a resulted
from hindered settling and the separation of clear water from the muddy lake. During the

CASE STUDY: HEISONGLIN RESERVOIR, CHINA 25.11
flood, 1.4 Mm
3
, or 23 percent of the inflow flood volume, seeped from the muddy lake
and into the overlying clear water, as computed from the rate of lowering of the water
level, the turbidity interface, and the outflow discharge. The muddy water interface fell by
0.03 to 0.05 m/h, which was faster than the water level (Table 25.3).
TABLE 25.3 Settling of Turbidity Interface Measured August 21-24, 1971, Heisonglin
Reservoir
W
ater level in
reservoir, m
Depth of
interface, m
Interface
settling rate, m/h
Amount of clear
water seeped, 10
3
m
3
T
ime of observation
Aug. 21, 11:30 1761.98 0.6 - 324
Aug. 22, 11:00 1760.62 1.41 0.034 620
Au
g. 23, 11:00 1758.80 2.56 0.047 1050
Aug. 24, 10:34 1756.69 4.05 0.063 1460
Source: Northwest Institute of Hydraulic Research (1972b).
Previous flume experiments and field data (Fan, 1980) showed that the interface settling
velocity is inversely proportional to the suspended-solids concentration of the muddy
suspension. For loessal silts, the settling velocity of the interface (V
z
, cm/s) may be
expressed as a function of suspended solids concentration (C, g/L) by the following
formula:
V
z
0.02C
2/3
(25.1)
For the mean concentration of 110 g/L on August 23, the interface settling velocity may
be computed as V
z
= 0.00087 cm/s = 0.031 m/h, which is of the same order of magnitude
as the average interface settling rate of 0.048 m/h observed in the field (Table 25.3). As
the sediment thickness in the muddy lake decreased, clear water was aspirated into the
bottom outlet and diluted the outflow concentration (Fig. 25.8).
The coarsest materials in a muddy lake settle first, thereby sorting the deposits from
individual flood events. Floodplain sediments deposited by the August 20, 1971, event
were sampled as a function of depth, showing that grain size in the deposit increased
with depth because coarse particles settled faster and became concentrated toward the
bottom of the deposit (Fig. 25.9). Deposit depth was relatively uniform from range 1 to
8 and decreased further upstream.
25.7 TURBIDITY CURRENT VENTING
In dry years characterized by low runoff during the early flood season, the reservoir was
not emptied but sediment was released by venting turbidity currents. Hydrographs for
two turbidity current venting events are shown in Figs. 25.10 and 25.11. Both events
involved relatively small inflowing floods in which the inflowing sediment-laden water
plunged beneath the already-impounded water and accumulated as a submerged muddy
lake behind the dam, where it was gradually released through the bottom outlet. There is
a 1.5-hour hydraulic travel time over the 7.5 km from the inflow gage station to the dam.
Of this distance, the first 5.8 km is above the plunge point and flow is nonstratified.
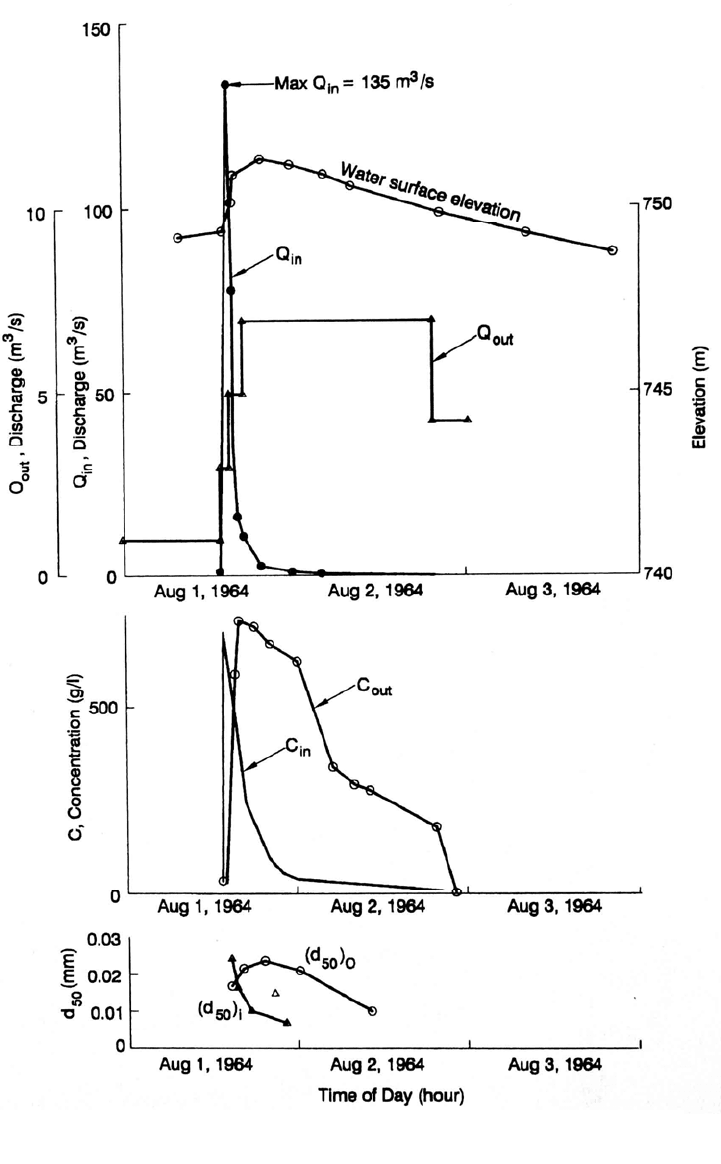
During the larger 1964 event (Fig. 25.10) the peak outflow sediment concentration slightly
exceeded peak inflow concentration. This may be a result of either scour and
entrainment of sediment downstream of the inflow gage station or increased sediment
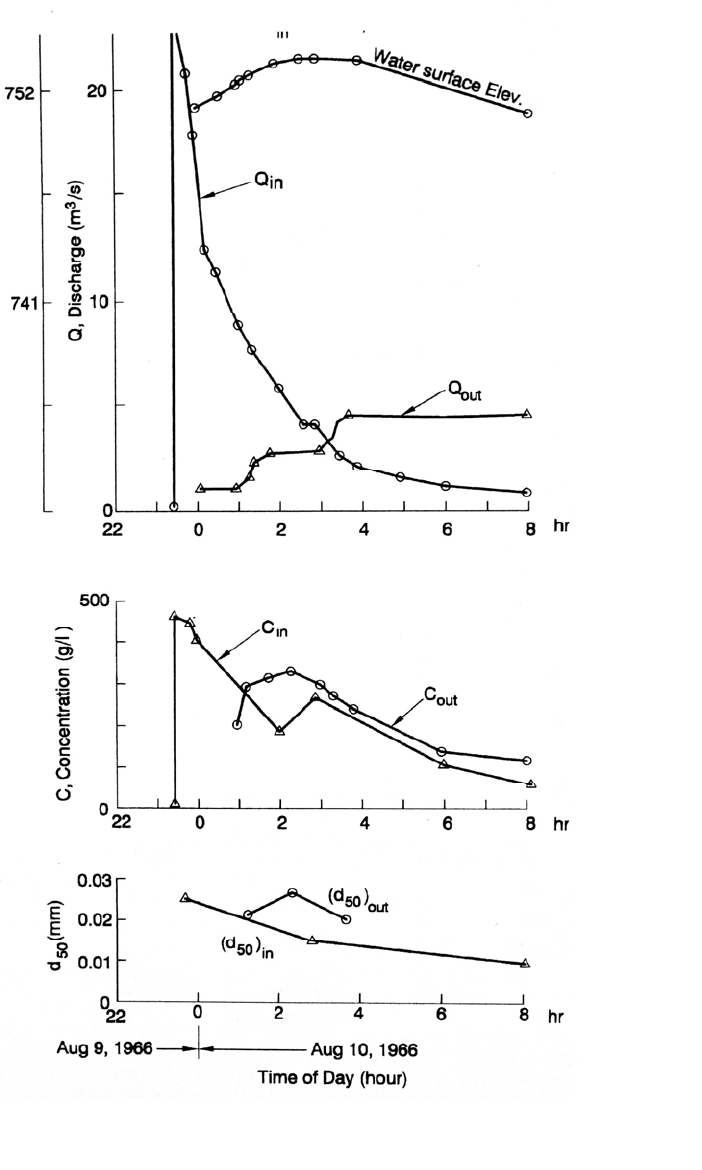
concentration due to settling within the muddy lake. In the smaller event (Fig. 25A1), the

CASE STUDY: HEISONGLIN RESERVOIR, CHINA 25.12
FIGURE 25.9 Increase in grain size with depth in floodplain deposits due to differential settling
rates of sediments from a single flood event at Heisonglin Reservoir. Numbers indicate range
locations for the samples (after Ren, 1986).
density current was released almost as soon as it reached the reservoir without creating
an appreciable muddy lake, and the discharge concentration was lower than the
maximum inflowing sediment concentration. This reduction of outflow concentration as
compared to inflow concentration is typical of turbidity current hydrographs measured in
larger reservoirs. Figure 25.12 shows vertical profiles of velocity, concentration, and
sediment grain size within the main channel during turbidity current venting. Grain size
was nearly constant within the turbidity current except near the clear water interface
where the sediment particles became much finer.
25.8 LATERAL EROSION
Experiments were initiated at Heisonglin to attempt to create a longitudinal channel
running parallel to the existing flushing channel for hydraulic scouring of floodplain
deposits, but relatively low rates of erosion were obtained because of the low
longitudinal slope. However, the accidental overflow of this longitudinal channel
initiated lateral erosion which quickly scoured a gully across the deposits. From this
it was recognized that erosion of the deposits would proceed much faster by directing the
flow along the high lateral slopes from the side of the reservoir toward the main channel,
as opposed to a longitudinal channel of lower slope running parallel to the existing
main channel (Xia, 1987). Because of the high gradient that can be achieved by
CASE STUDY: HEISONGLIN RESERVOIR, CHINA 25.13
FIGURE 25.10 Characteristics of flood inflow and density current discharge at Heisonglin
Reservoir, August 1-3, 1964 (Northwest Institute of Hydraulic Research et al., 1972a).
CASE STUDY: HEISONGLIN RESERVOIR, CHINA 25.14
FIGURE 25.11 Characteristics of flood inflow and density current discharge at Heisonglin
Reservoir, August 9-10, 1966 (Ren, 1986).