Morris & Fan. Reservoir Sedimentation Handbook
Подождите немного. Документ загружается.

ENGINEERING FEATURES OF DAMS AND RESERVOIRS 3.21
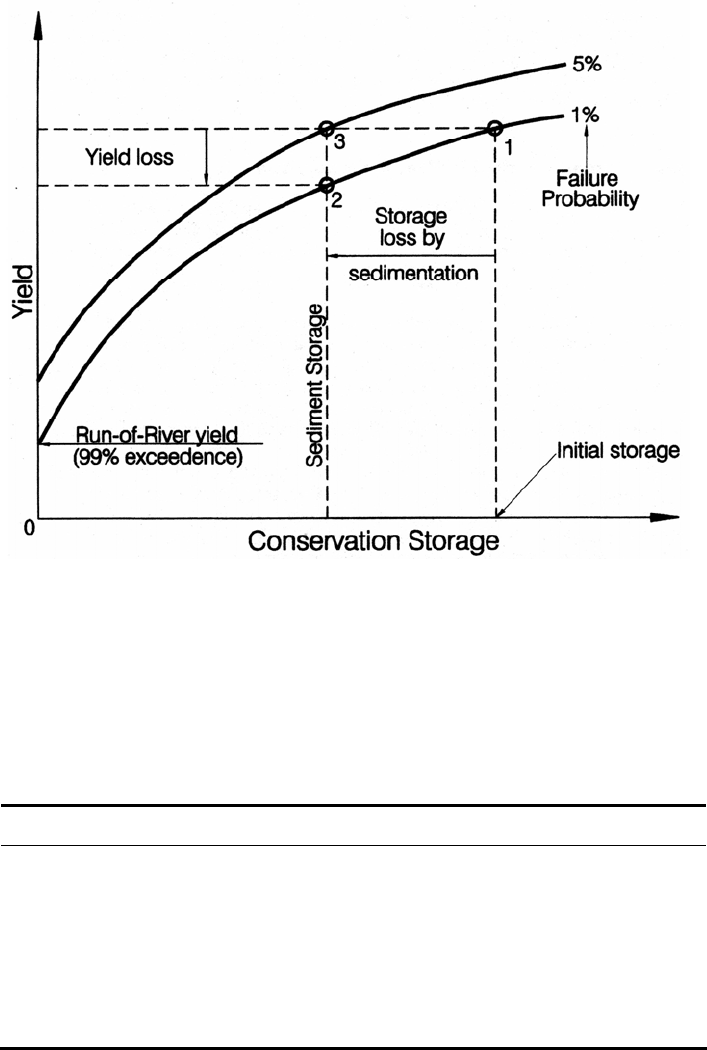
FIGURE 3.15 General shape of a reservoir storage-yield curve, in which yiel
d
asymptotically approaches the mean watershed yield, less evaporative and seepage
losses, as storage becomes very large. Two yield curves are shown for different levels
of service. The impact of sediment accumulation in the conservation pool may be
expressed as either a reduction in yield at a given level of relia
b
ility (point 1 to 2) or
a
reduction in reliability at a fixed yield (1 to 3).
TABLE 3.5 Values of Gould's Correction Factor d as a Function of Zp
Lower p percentile value* Z
P
Correction factor d
0.5 3.30 d not constant
1.0 2.33 1.5
2.0 2.05 1.1
3.0 1.88 0.9
4.0 1.75 0.8
5.0 1.64 0.6
7.5 1.55 0.4†
10.0 1.28 0.3†
* Probability of failure.
† Gould's Gamma method not recommended for use in this range.
Source: McMahon and Mein (1986)
ENGINEERING FEATURES OF DAMS AND RESERVOIRS 3.22
As an example, consider a stream with C
v
= 0.60, a desired draft ratio equal to 50 percent
of the mean annual discharge (D = 0.50), and a 1 percent probability of failure
(probability p = 1% and Z
p
= 2.33 from the table of normal distribution). From table 3.5
the value of d = 1.5, and the equation is solved for a capacity inflow value of = 0.437
for the conservation storage pool.
3.8.3 Computing Yield by Behavior Simulation
The yield from single or multiple reservoirs may be analyzed by iteratively solving water
mass balance across the impoundments for a given storage volume, inflow series and
operating rule, using a continuity equation having the following general form:
Storage
t
= storage
t-1
+ inflow - withdrawals - losses
Storage is the volume of water in the impoundment at the end of each time step. Inflow
includes all natural plus regulated inflows. Withdrawals include all controlled release
including diversions, minimum streamflow releases, and releases for sediment
management. Losses include all uncontrolled releases including spills, evaporation, and
seepage. By expressing reservoir geometry using stage-area and stage-storage curves,
behavior simulation can also provide information such as water levels, available power
head and evaporative losses at each time step.
The mass balance equation is solved iteratively over the duration of the entire hydro-
logic sequence, executing at each time step the operating rule which specifies parameters
such as the rate and seasonality of withdrawal, rationing or allocation rules when storage
drops below stated minimum levels, operating requirements associated with sediment
management, etc. At each time step, information on delivery rate, pool elevation, power
generation, spills and other parameters generated by the simulation are recorded, and can
subsequently be analyzed to determine the probabilistic characteristics of the system
behavior. Time steps of 1 month are frequently used in reservoir yield simulations, but at
sites where sediment management requires drawdown periods that are not even-month
multiples or last only a few days per year, shorter time steps will be required. Sediment
management activities using only water that would otherwise be spilled, such as sediment
routing described in the Loíza and Feather River case studies, do not require yield
analysis. However, real-time modeling of reservoir behavior during short time steps (e.g.,
15 minutes) may be necessary for analysis and implementation this procedure.
A behavior analysis for a single reservoir using historical datasets can be performed
using an electronic spreadsheet. Both simple and complex systems, including multiple
watershed, multiple-reservoir, multiple-use systems, can be analyzed by computer models
such as HEC-5 (U.S. Army, 1982) and the Ackers Reservoir Simulation Program (ARSP)
distributed by Boss International (1993).
3.8.4 Hydrologic Time Series
The historical data series available for any analysis will not be repeated exactly in future,
but may be interpreted and manipulated to provide insight into potential future hydrologic
patterns. If a short-term streamflow record contains a drought of sufficient intensity, as
documented by long-term rainfall records, the historical dataset may provide a reasonable
estimate of the long-term yield. The historical series is used to generate and subsequently
ENGINEERING FEATURES OF DAMS AND RESERVOIRS 3.23
verify the reasonableness of synthesized dataset and their resulting simulation, and may
also be used to establish the initial operating rule to be subsequently tested with multiple
synthetic datasets constructed using statistical parameters computed from the historical
datasets.
Fundamental to this procedure is the assumption that hydrologic conditions are
stationary (not changing with time) and that historical conditions are representative of the
future. However, both streamflow and sediment delivery may be affected by many
variables, including upstream storage and diversion projects, deforestation, reforestation,
and other land use changes that influence water yield, and both natural and human-
induced climatic change. Reforestation of a degraded watershed will decrease both
sediment and water yield (Bosh and Hewlett, 1982).
3.8.5 Sedimentation Effect on Yield
Sedimentation can affect system yield in three ways: it reduces conservation pool
volume, sediment management may require that reservoir operation be altered, and
watershed management for sediment control may affect water yield. The first two
impacts can be readily evaluated within the framework of behavior analysis modeling,
while the third requires modeling of watershed processes.
In a single reservoir the decline in yield (or the decline in reliability at a fixed yield)
may be predicted from the storage-yield relationship by subtracting sediment accumu-
lation from the conservation pool to predict future storage. In a system containing
multiple reservoirs, each site will contribute only a portion of the total water yield or
other benefit and the rate of storage loss will also vary among the sites. Selection of the
most efficient means to sustain yield from the entire system requires information on the
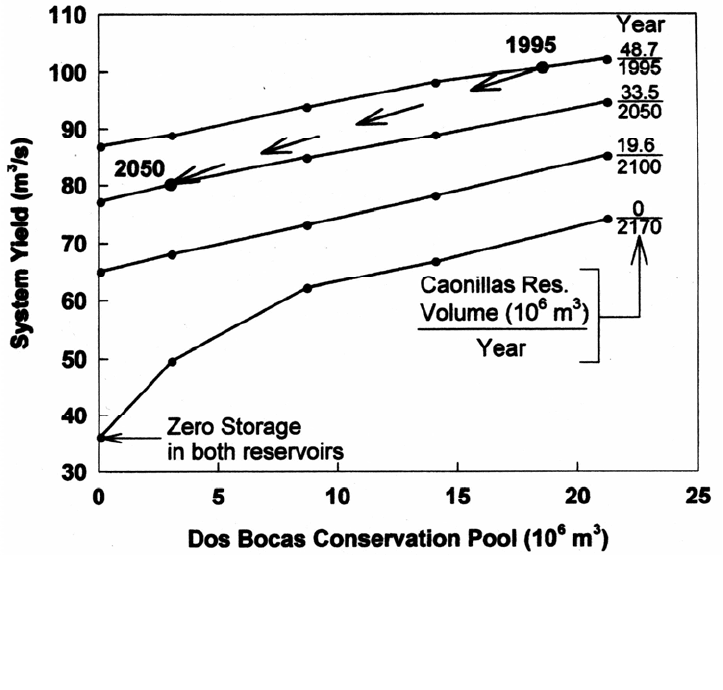
FIGURE 3.16 Effect of sedimentation on yield in a two-reservoir system (Morris, 1996).
ENGINEERING FEATURES OF DAMS AND RESERVOIRS 3.24
cost and yield impact of different sediment management alternatives at each site. Limited
economic resources should be focused on those sites and activities that generate the
greatest net benefit, subject to environmental and other constraints.
Analysis of a multiple reservoir system may be performed by analyzing different
storage capacities, to define the impact of storage loss (or recovery) at each site on the
overall system yield. Model runs are used to define the relationship between system yield
and reliability for various storage combinations, and the resulting yields and service
levels are plotted to fit a continuous curve. Results for a simple two-reservoir system are
plotted in Fig. 3.16. The yield impact of storage loss or recovery in either of the two
reservoirs can be estimated by holding the capacity of one reservoir constant and
computing the change in yield caused by different amounts of sedimentation in the other
reservoir. The anticipated yield reduction caused by simultaneous sedimentation in both
reservoirs is illustrated in the figure. A similar approach can be used for systems
containing more than two reservoirs, in which case the graph would illustrate the effect of
storage loss in any single reservoir on the system yield.

CHAPTER 4
CONCEPTS OF RESERVOIR LIMNOLOGY
Environmental impacts associated with dams and reservoirs influence both the design and
"success" of engineering projects. Both physical and biological within-lake processes
influence the pattern of organic sediment deposition, which can affect oxygen and nutrient
budgets within the impoundment and in released water. This makes it important for
engineers to understand some of the basic concepts and terminology of limnology, that
branch of science which encompasses the study of physical and biological processes in
inland water bodies. The limnology of natural lakes is described in several texts including
those by Home and Goldman (1994), Wetzel (1983), and Cole (1994). The characteristics
of reservoirs are rather distinct from natural lakes, and reservoir limnology has been
summarized by Thornton et al. (1990).
4.1 COMPARISON OF LAKES AND RESERVOIRS
4.1.1 Summary Differences
Great differences exist within the population of both natural and impounded lakes. Both
include water bodies ranging from deep, nutrient-poor, seasonally ice-covered alpine
lakes to warm, shallow lakes experiencing high sediment and nutrient loads.
Characteristics of natural and artificial lakes may be similar if they occupy similar climatic
zones and have comparable hydraulic residence time, nutrient and sediment loading,
depth, and water level variation. Both lakes and reservoirs are populated by many of the
same species and have many similar physical and biological characteristics. However, in
comparisons of one population against the other there emerge several fundamental
differences, summarized in Table 4.1 and Fig. 4.1. Differences also occur because
reservoirs are often located in climatic zones or geologic environments having few, if any,
natural lakes.
4.1.2 Hydrologic Size and Loading Rate
A fundamental difference between natural lakes and reservoirs is their disparity in
hydrologic size, expressed as the mean hydraulic retention time or CI (Capacity:Inflow)
ratio. Cassidy (1989) argued that reservoirs will not be similar to natural lakes unless
their mean hydraulic detention period exceeds 1 year (CI > 1), and pointed out that of
2650 reservoirs in the United States having a total storage capacity exceeding 6.17 Mm
3
,
only 20 percent had C:I > 1 while 45 percent had C:I < 0.3.
CONCEPTS OF RESERVOIR LIMNOLOGY 4.2
TABLE 4.1 Summary Differences between Natural Lakes and Reservoirs
Parameter Natural Lake Reservoir
Hydrologic size (C:I ratio) Large Small
Age 1000s of years 10s of years
Water level variation Small Moderate to extreme
Discharge level Surface* Surface and deep
Watershed: lake area ratio Small Large
Sediment and nutrient loading Low High
Shape Oval/circular Linear/dendritic
Primary productivity Lower Higher
Species diversity Higher Lower
Senescence Slow Rapid
Transparency Higher Lower
Impact of watershed activities High Extreme
Water quality gradients Weak/concentric Strong/longitudinal
Shoreline: area ratio Low High
* Except lakes primarily exchanging water with the groundwater system
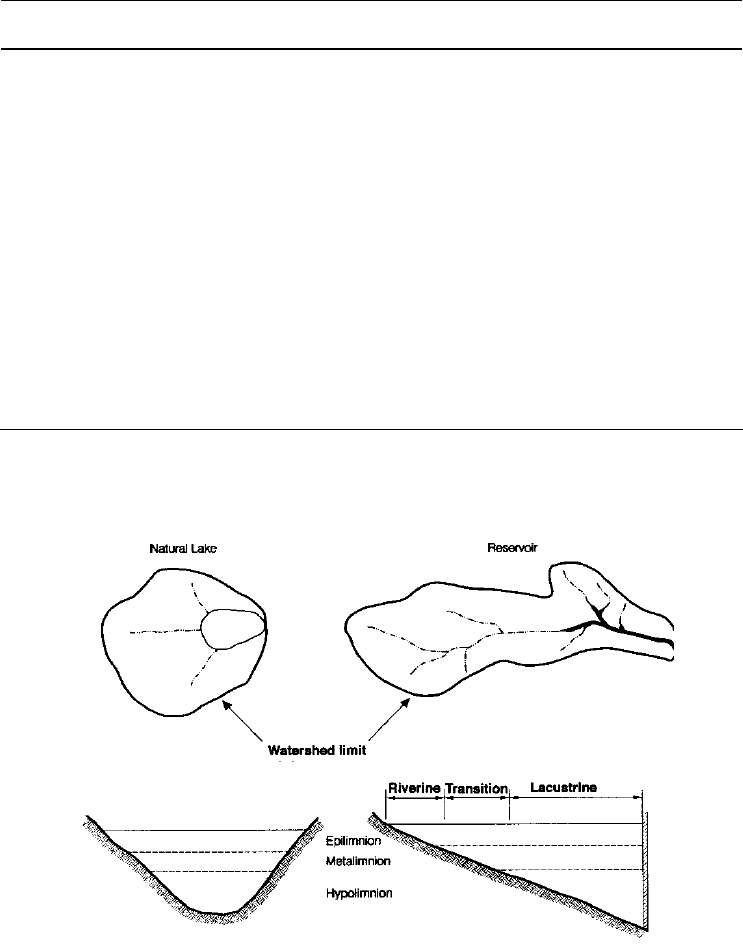
FIGURE 4.1 Comparison of natural lakes and reservoirs.
Natural lakes characteristically have relatively small drainage areas contributing,
nutrients and sediment, and a significant part of the watershed may drain directly into the
lake via ephemeral streams. Although this reduced watershed area limits the
hydraulic loading and detention time on the lake, water quality conditions in lakes
CONCEPTS OF RESERVOIR LIMNOLOGY 4.3
are nevertheless heavily dependent on conditions in the watershed. In contrast, reservoirs
are constructed across streams draining large watersheds, producing comparatively high
loading rates for sediment and nutrients. Reservoir water quality reflects watershed
processes to an even greater degree than do natural lakes. Hydrologic size has another
important impact on reservoir biology; in reservoirs having short hydraulic residence
times due to small impoundment volume or hydraulic manipulation, water will be
flushed from the impounded reach faster than some species can reproduce. Thus, a
hydrologically small reservoir may remain at a state of "arrested" ecological
succession compared to natural lakes, supporting populations of only those species
that can reproduce rapidly prior to being washed downstream. Planktonic species
that drift with currents are particularly sensitive in this respect.
4.1.3 Age and Senescence
Over time, both natural and artificial lakes experience sediment accumulation, decreasing
water depth, and nutrient enrichment as organic and inorganic sediments accumulate.
This process continues until the lake is converted into a shallow marsh and ceases to
exist as an open body of water. Shallow oxbow lakes formed by meander cutoffs in
sediment-laden rivers can experience high sediment loading and may have life spans
of only a few decades or centuries. At the other end of the spectrum are extremely
ancient lakes, such as Lake Baikal in Russia, the world's deepest (1620 m) and largest
(23,000 km
3
) freshwater body, which contains more than 3 times the total capacity of
all reservoirs worldwide. However, natural lakes more typically have ages on the
order of tens of thousands of years, many of them dating from the last glaciation. In
contrast, most reservoirs are extremely young, only a few decades old, and are
subject to high or extreme rates of sediment loading and greatly accelerated
senescence processes compared to natural lakes.
4.1.4 Geometry and Longitudinal Gradients
Natural lakes are typically oval-shaped as a result of either geologic factors influencing
their formation (such as nearly circular sinkhole lakes) or the gradual infilling of
embayments or dendritic branches with sediment. Lakes are typically shallow around
the edge and deepen toward the middle. Reservoir geometry is dramatically different.
Reservoirs typically have highly elongated geometries, shallow at the upstream end
with regularly increasing depth toward the dam. This produces strong longitudinal
gradients in the physical, water quality, and biological characteristics in reservoirs
which are largely absent in natural lakes. These gradients must be considered in the
development of sampling programs for reservoirs (Thornton et al., 1982). The
presence of multiple reservoirs along a stream can also result in a water quality
gradient from reservoir to reservoir.
Lakes and reservoirs receive inputs of water, sediment, nutrients, and both dissolved
and detrital organic material from their tributary streams. The term allochthonous is used
to designate the external material inputs into the lake. The term autochthonous refers to
material produced within the lake itself, such as the organic material produced by phyto-
plankton or nutrients resuspended into the water column from lake sediments. Reservoirs
may be longitudinally divided into the three zones illustrated in Fig. 4.1 (Thornton,
1990). The upstream riverine zone is an area of narrow geometry and shallow water char-
acterized by significant flow velocities and transport of silts and clays, while the coarse
fraction of the inflowing sediment deposits to form a delta. Allochthonous
riverbome organic detrital material predominates in this zone. Despite potentially

CONCEPTS OF RESERVOIR LIMNOLOGY 4.4
significant organic loading, the water column is aerobic because of its limited depth, the
absence of stratification, and the inflow of oxygenated river water. Light penetration may
be limited by high turbidity from suspended solids delivered by the river, or high algae
population sustained by high nutrient concentrations in the river inflow. The lacustrine
zone occur closer to the dam and exhibits characteristics more similar to natural lakes
including clearer water, lower sediment loads, and a stratified water column. The food
chain in the pelagic (open water) zone closer to the dam will depend more heavily on
autochthonous organic matter produced by plankton. Primary production may be
nutrient-limited rather than light-limited. These two zones are separated by a transition
zone.
4.1.5 Shorelines and Water Level Variation
Reservoirs having irregular or dendritic planforms are characterized by very long shore
lines per unit of surface area. Given a stable water level, this could produce an
extensively vegetated littoral zone which could significantly influence the reservoir
biology. However, many reservoirs are characterized by wide water level fluctuations,
including complete emptying every year, which eliminates the possibility of establishing
littoral vegetation. Limited water level manipulations to control aquatic vegetation, to
consolidate sediment, and to promote fisheries have been described by Cooke et al. (1993)
However, the large drawdown or emptying used to manage sediments can severely limit the
species that can populate the reservoir.
4.1.6 Sediment Loading
One of the most significant differences between natural lakes and reservoirs is the
increased sediment loading, which not only greatly accelerates shallowing and related
senescence processes in reservoirs, but also produces higher turbidity. Natural lakes often
have a zone of light penetration, the photic or euphotic zone, many or even tens of meters
deep. In contrast, the euphotic zone in reservoirs is more typically on the order of only a
few meters deep. High turbidity levels can be caused by sediment inflow or the resuspension
of bottom sediment by wave action, and can produce euphotic zones a shallow as 1 m.
Vertical mixing in this environment can keep algae below the euphotic zone for prolonged
periods, resulting in very low populations of primary producers and associated
zooplankton. During seasonal runoff events the inflow of turbid water may reduce the
euphotic zone to a fraction of a meter in depth, especially in the upstream riverine zone of
reservoirs.
4.2 TEMPERATURE AND STRATIFICATION
4.2.1 Stratification
Water bodies more than a few meters deep have a strong tendency to stratify because of
changes in fluid density caused by differences in temperature and suspended solids.
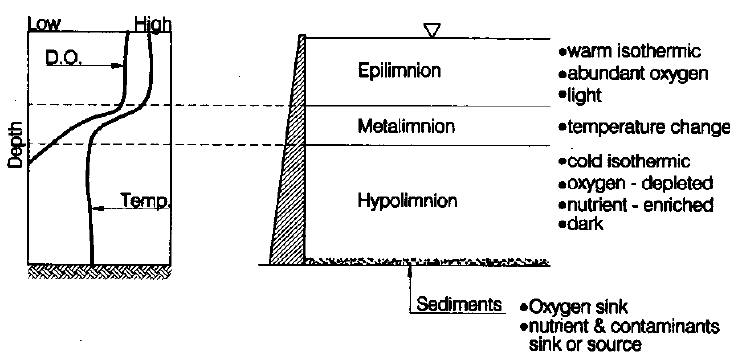
Temperature stratification is a ubiquitous phenomenon, the result of solar heating of surface
water which produces a three-layer system consisting of: (1) a vertically mixed layer of
warmer and well-oxygenated surface water termed the epilimnion, (2) a zone of rapid
temperature and density change called the metalimnion, and (3) the colder, darker, and
oxygen-depleted profundal zone or hypolimnion (Fig. 4.2). The thermocline is defined
as the relatively narrow zone where the temperature gradient equals at least 1 °C per
CONCEPTS OF RESERVOIR LIMNOLOGY 4.5
FIGURE 4.2 Vertical structure of reservoirs and lakes
meter of depth, whereas the meta
limnion is generally understood to encompass the
thermocline and the adjacent water column characterized as transitional between the
surface and profundal waters. In more productive lakes, the hypolimnic water which is
trapped beneath the thermocline will become anaerobic because of the oxygen demand
imposed by decomposers and organic sediments.
The density difference per degree centigrade of temperature change increases as a
function of temperature. For example, the density difference caused by a 1° change in
temperature at 24°C (75°F) is 3 times greater than the density change at 9°C
(48°F). Thus, tropical reservoirs may be strongly stratified despite temperature
gradients much smaller than those in temperate zone reservoirs. The potential density
differences due to suspended solids are an order of magnitude larger than those due to
temperature differences and can cause warm turbid inflow to plunge beneath colder
water and travel along the length of a reservoir as a turbid density current. In some
reservoirs, turbidity currents can transport a significant amount of sediment to the dam,
as discussed in Chap. 14.
4.2.2 Seasonality of Stratification
Lake stratification is driven by seasonally variable forces: solar energy, inflowing water
temperature, and variable suspended solids concentrations. If temperature profiles are
measured year round, temperate zone lakes and reservoirs will demonstrate strong sum-
mer stratification due to solar heating of surface waters, but isothermal conditions occur
during the winter, eliminating the density gradient and allowing the entire water column
to mix vertically, a process called turnover. During turnover, nutrients which have accu-
mulated in the deeper water are returned to the surface where they can promote algal
growth in the spring as temperatures rise, ice cover disappears, and daylight hours
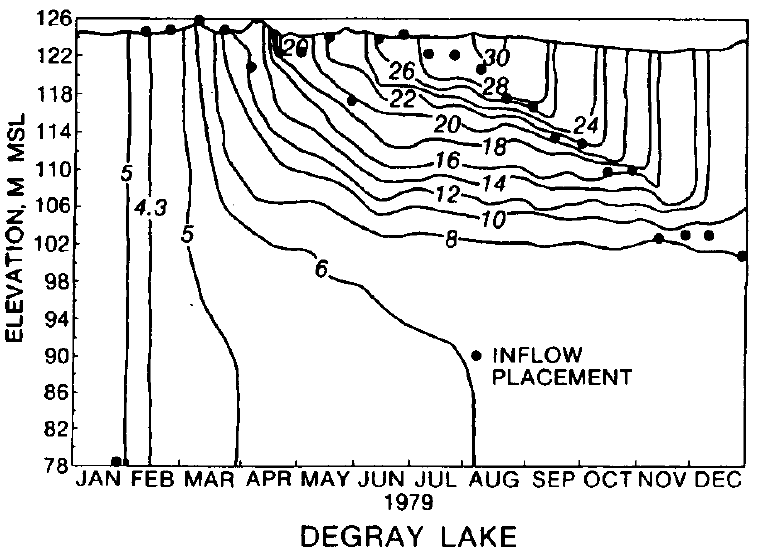
lengthen. The seasonal variation in temperatures throughout the water column in Lake
DeGray, Arkansas, is shown in Fig. 4.3. Lakes which have a single period of annual
mixing and do not freeze, such as Lake DeGray, are termed monomictic. Lakes that mix
twice, once in the fall and once in the spring, with ice cover in the winter, are classified
as dimictic. Shallow lakes that are frequently or even continuously mixed are termed
polymictic
CONCEPTS OF RESERVOIR LIMNOLOGY 4.6
FIGURE 4.3 Seasonal variation in temperature stratification (
°
C), Lake DeGray, Arkansas
(Kennedy and Nix, 1987).
Wind is the primary factor causing vertical circulation in lakes, and higher
winds will cause deeper circulation and increase the depth of the epilimnion. The thermal
structure of a lake can also be subject to significant temporal and spatial differences as
a result of varying wind direction and velocity. Winds of sufficient strength,
duration, and fetch will overcome temperature-induced stratification and completely mix
the water column. Reservoirs are subject to the same wind-induced forces as natural
lakes. However, hydrologically small reservoirs will additionally be subject to large
inflows that can flush out the impoundment, replacing the entire body of water
with flood inflow. After the flood the newly impounded water will again stratify as
sunlight heats the surface water.
4.2.3 Density of Water
The following water density equations, based on Ford and Johnson (1983) and Chen and
Millero (1977), will determine density to within 0.02 kg/m
3
of the true value over the
range of 0 to 30°C, 0 to 600 ppm TDS, and 0 to 180 bars pressure. The density of
water may be expressed as the temperature-dependent density of the fluid plus the
additional density imparted by suspended and dissolved solids:
T
TDS
SS
(4.1)
where ρ = density (kg/m
3
) with subscripts T = temperature, TDS = total dissolved
solids, and SS = suspended solids. The maximum density of water is 1000 kg/m
3
at
,
3.98°C. The density of pure water as a function of temperature in °C may be
computed by the following equation: