Messerschmidt U. Dislocation Dynamics During Plastic Deformation
Подождите немного. Документ загружается.

180 5 Dislocation Kinetics, Work-Hardening, and Recovery
the dislocations passing by on parallel planes and, for multiple slip, by cutting
the debris. As the stress field of finite dipoles decreases rapidly with increasing
distance, it is suggested that the debris acts similarly to precipitates. Accord-
ing to [311], the force between a dislocation and a nonparallel dipole is small
as long as the dislocation is not located between the dipole arms. The passing
of terminated dipoles by dislocations moving in an oscillating stress field is
simulated in [312]. The dipoles may be annihilated or moved resulting in the
formation of dipole clusters. In general, the mechanism of debris hardening is
not well understood. The contribution to the flow stress is probably mostly
small.
5.2.2 Thermal and Athermal Components of the Flow Stress
As described in the foregoing section, the grown-in dislocations and the dis-
locations stored in different structures during plastic deformation cause a
field of spatially varying long-range internal stresses. These stresses promote
the dislocation motion in some regions but impede it in others. Thus, these
stresses represent also obstacles to dislocation glide. According to Albenga’s
law, the spatial average of the internal stresses is zero. It has been discussed in
Sect. 4.1 that at a finite temperature the dislocation motion can be supported
by thermal activation. However, thermal activation is confined to processes
where the energy necessary to surmount the obstacle at the actual stress is
less than about 40 kT, corresponding to about 1 eV at room temperature, and
where the volume involved contains less than a few hundred atoms. To move
a dislocation segment of length Δy in the long-range stress field over a dis-
tance Δx against an internal stress τ
i
requires an energy of ΔxΔyτ
i
b.With
Δx =Δy =0.5 μm, τ
i
=10
−3
μ, b =3×10
−10
m, and μb
3
= 5 eV, the energy
becomes several thousand electron volt in contrast to 40 kT ≈ 1eV at room
temperature. Thus, this energy is far too high to be overcome by thermal
activation. Likewise, also the number of involved atoms is far too high. As a
consequence, long-range internal stress fields cannot be overcome by the action
of thermal activation. It is therefore useful to distinguish between components
of the flow stress that can be surmounted by the aid of thermal activation
and those which cannot. The first ones, the thermal components, result from
most mechanisms with short-range stress fields discussed in Chap. 4. Their
temperature dependence is of Arrhenius type and depends on the particular
interaction potential. The second ones, the athermal components, originate
from the long-range internal stress fields and some other processes requir-
ing high energies and being not restricted to small volumes like the Orowan
process. In this case, the temperature dependence is weak. It equals that of
the shear modulus as the interaction stresses are proportional to it (or per-
haps some other elastic constant). Accordingly, the thermal contributions to
the flow stress are also denoted temperature-dependent components and the
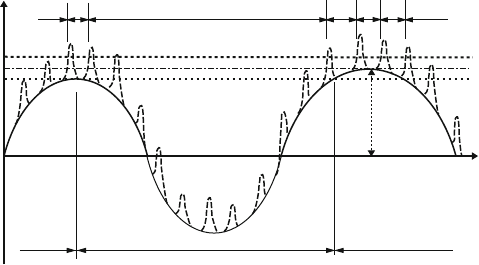
athermal components temperature-independent ones. Figure 5.20 presents a
schematic plot of the superposition of long-range internal stresses (the sine-like
5.2 Work-Hardening and Recovery 181
x
A
B
τ
τ
3
τ
2
τ
1
–τ
i,loc
τ
A
Δx
HT
Δx
LT
Fig. 5.20. Schematic drawing of the superposition of long-range internal stresses
and short-range interaction profiles
function) and the short-range fields of localized obstacles. These stresses are
plotted with negative sign. The internal stresses may be characterized by their
amplitude τ
A
and wavelength L. Three levels of the applied stress are char-
acterized by the horizontal lines τ
1
, τ
2
,andτ
3
. The local stress τ
loc
acting on
the short-range obstacles is given by the sum of the applied stress τ and the
local internal stress τ
i,loc
τ
loc
= τ + τ
i,loc
. (5.14)
At first, the situation may be considered without the presence of the short-
range obstacles. At zero external stress, the dislocation may be positioned at
the beginning of the τ
i,loc
vs. x curve. With increasing stress, the disloca-
tion moves forward along this curve. When the maximum τ
1
of the negative
(impeding) internal stress is reached at A, the dislocation can jump at a high
velocity to position B near the next maximum. As this maximum is higher
than that at A, the dislocation cannot surmount it. The only way to resume
the dislocation motion is to increase the stress again to the level of the maxi-
mum τ
2
. If the stress is high enough, the dislocation can pass all internal stress
maxima. This is a pure athermal motion of the dislocation. The situation is
similar for high temperatures, even if short-range obstacles are present. At a
sufficiently high temperature, the waiting times at the obstacles will be very
short so that these obstacles do not impede the dislocation motion. In this
athermal situation, the jump distances of the dislocation Δx
HT
will be given
by the wavelength of the internal stress fields.
At low temperatures, the waiting times at the short-range obstacles cannot
be neglected. At a stress level τ
3
, the dislocation coming from the left will
stop at the first obstacle that exceeds the applied stress, marked by a thin
vertical line. After thermal activation, it moves to the next obstacle. When
this is overcome, the dislocation reaches a region of very high local stress,
where it flies to the next maximum of the impeding internal stress. There, the
182 5 Dislocation Kinetics, Work-Hardening, and Recovery
obstacles again have to be surmounted individually by thermal activation. The
jump distances Δx
LT
are now the distances between the short-range obstacles,
except in regions where the dislocation does not feel the short-range obstacles.
These regions become unimportant if the amplitude of the internal stresses is
small.
In summary, the kinematic behavior of the moving dislocations can be
characterized as follows. At intermediate temperatures, the dislocation motion
is governed by thermal activation and may be jerky on the small scale of local-
ized obstacles. If the Peierls stress is rate-controlling, the dislocation motion
may even be very smooth. The transition between the latter two mechanisms
was described in Sect. 4.6. At high temperatures, the localized obstacles are
overcome very quickly so that they do not control the dislocation motion. The
latter is governed by the long-range internal stress fields. It becomes athermal
and is jerky on the large scale of the wavelength of the stress fields. The tran-
sition between thermal and athermal behavior is not sharp. In more general
terms, the character of the dislocation movement is athermal if a great part of
the energy necessary to overcome the glide obstacles is supplied by the exter-
nal stress. In view of the force–distance curve of Fig. 4.1, a process is mainly
athermal if the work term ΔW comprises most of the total activation energy
ΔF , or if the Gibbs free energy of activation ΔG is small. This is expressed
also in Fig. 4.18, where the area swept after a single thermal activation event
increases strongly when the applied stress approaches the athermal flow stress
of the obstacle array. In this sense, also dislocation motion at low tempera-
tures becomes athermal, because at the high stress level many obstacles are
overcome spontaneously. All these considerations are valid for temperatures
where diffusion can be neglected. At very high temperatures the dislocation
motion will become smooth again owing to the diffusion processes described
in Sect. 4.11.
As discussed in detail in Chap. 4, the actual dislocation velocity is a func-
tion of the local shear stress. The question arises as to the influence of the
internal stress fields on the average velocity of a dislocation moving under the
action of the macroscopic external stress τ and supported by thermal activa-
tion. A very simple argumentation goes back to Seeger [313]. The dislocation
spends most of its time in the regions of low local forward stress given by the
difference between the applied stress and the amplitude of the internal stress
fields, τ − τ
A
. Consequently, its average velocity will mainly be determined
by these jumps. In this model, the spatially varying local stresses and the
internal stresses are replaced by a constant so-called effective stress τ
∗
and a
constant internal back-stress τ
i
. In contrast to (5.14) where the applied stress
and the varying internal stress add up to the local stress, now the effective
stress is the difference between the applied stress and the internal stress
τ
∗
= τ − τ
i
. (5.15)
This procedure had been adopted in most sections before. It is of highly
qualitative nature. It has to be expected that τ
i
is not equal to the amplitude
5.2 Work-Hardening and Recovery 183
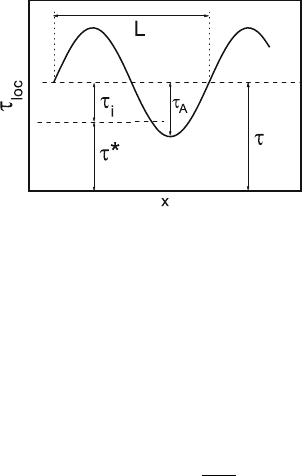
Fig. 5.21. Model of a spatially periodic internal stress field according to [315]
of the internal stresses τ
A
. A more sophisticated approach to the effect of
internal stresses on the movement of dislocations is the calculation of the
average velocity of a dislocation moving in a spatially periodic internal stress
field, as suggested by Chen et al. [314] and Li [315]. The latter is outlined here
as it has the advantage of an analytical solution. The locally acting stress τ
loc
is described by a sine function of the position x of the dislocation as illustrated
in Fig. 5.21, that is,
τ
loc
= τ − τ
A
sin
2πx
L
.
Here, τ is the applied stress, τ
A
the amplitude, and L the wavelength of
the internal stress field. It was shown in [316] that the internal stress fields
of periodic square arrays of screw dislocations of both the same sign and
of opposite sign can well be approximated by the sinusoidal function of the
position of the moving dislocation. In the calculations by Li, the instantaneous
velocity of the dislocation is given by the power law (4.10) or (4.103), in
abbreviated form
v
d
= Bτ
m
loc
.
The average velocity ¯v
d
is calculated by integrating 1/v
d
over one period L
and dividing the result by L. The analytical solution contains the Legendre
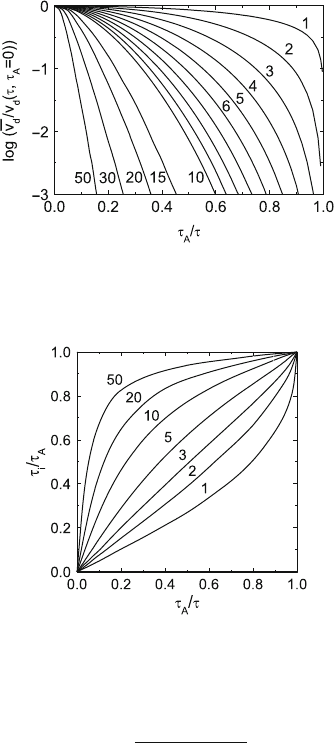
function. Figure 5.22 presents the dependence of the average velocity ¯v
d
nor-
malized by the velocity v
d
(τ,τ
A
= 0) at the same stress but without internal
stresses on the amplitude of the internal stress normalized by the applied
stress (τ
A
/τ). The average velocity is always lower than the velocity with-
out the internal stress field. The deviations increase with increasing stress
exponent m.
The results can be compared with the simple model of a constant back
stress τ
i
= τ −τ
∗
discussed above by setting the average velocity equal to the
velocity at τ
∗
= τ − τ
i
:
¯v
d
= Bτ
∗
m
= B (τ − τ
i
)
m
.
τ
i
may be called an apparent internal stress. It follows that
184 5 Dislocation Kinetics, Work-Hardening, and Recovery
Fig. 5.22. Dependence of the normalized average dislocation velocity in a peri-
odic internal stress field on the amplitude of the internal stresses. Parameter: stress
exponent m. Data from [315]
Fig. 5.23. Dependence of the apparent internal stress on the amplitude of the
internal stresses. Parameter: stress exponent m. Data from [315]
τ
i
= τ
1 −
¯v
d
v
d
(τ,τ
A
=0)
1/m
.
This relation is plotted in normalized form in Fig. 5.23. The apparent inter-
nal stress is lower than the amplitude of the internal stress fields τ
A
but
approaches it for τ
A
→ τ. The deviations are significant only if both τ
A
and
m are small.
In general, the amplitudes of the internal stress fields are not known, nei-
ther are they constant as assumed here. For studies of the dislocation dynamics
by measuring the activation parameters during plastic deformation, the prob-
lem of the internal stresses is important as the formalism of the thermally
activated dislocation motion is based on the locally acting effective stress, but
not on the applied stress. Using the differential techniques like strain rate
cycling or stress relaxation tests (4.9) and (4.11), one usually assumes that in
addition to the pre-exponential factor (e.g., ˙γ
o
in (4.8)) also the internal stress
5.2 Work-Hardening and Recovery 185
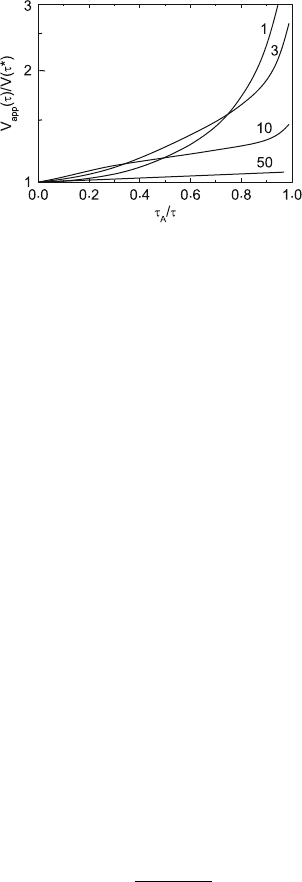
Fig. 5.24. Dependence of the normalized apparent activation volume on the
amplitude of the internal stresses. Parameter: stress exponent m. Data from [315]
remains constant so that ∂τ
∗
= ∂τ. However, that what remains constant dur-
ing an instantaneous change of the deformation conditions is not the apparent
internal stress τ
i
but the amplitude of the internal stress fields τ
A
. Accordingly,
the measured or apparent activation parameters like the activation volume
and the activation enthalpy have their well defined thermodynamic meanings
but they do not represent the quantities occurring in the respective models.
Based on the calculation of the average dislocation velocity plotted in Fig. 5.22,
the plot in Fig. 5.24 shows the ratio between the apparent activation volume
V
app
(τ) measured at the stress τ and the activation volume V (τ
∗
) defined
by the microscopic models measured at the stress τ
∗
. The apparent activa-
tion volume is always larger than the true one. The deviations increase with
increasing amplitude of the internal stress fields. However, they are mostly
less than a factor of two. They are small for high stress exponents m and for
low temperatures where τ
A
/τ is small. The relation between the true and the
apparent activation volumes was treated in a more general way in [317].
Similarly, also measurements of the stress exponent m = ∂ ln v
d
/∂ ln τ
∗
are influenced by the presence of internal stresses. The calculations show that
the apparent stress exponent m
= ∂ ln v
d
/∂ ln τ is always greater than m.
For high values of m, the effect of the varying internal stress of amplitude τ
A
is almost equal to that of the presence of a constant back stress τ
i
= τ
A
.It
follows then for the apparent stress exponent
m
=
m
1 − τ
A
/τ
. (5.16)
In conclusion, the influence of the presence of spatially varying internal
stress fields on the experimental determination of the dynamic dislocation
properties cannot exactly be described by a constant internal back stress τ
i
.
However, as the properties of the internal stress fields are not well known, the
assumption of a locally constant back stress is sufficient for rough estimates
from experimental data. Nevertheless, it should be kept in mind that the
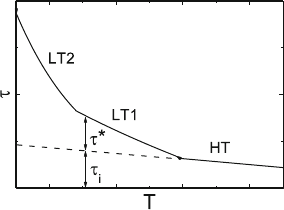
186 5 Dislocation Kinetics, Work-Hardening, and Recovery
Fig. 5.25. Schematic plot of the temperature dependence of the flow stress in the
ranges where diffusion is not important
activation volume and the stress exponent related to the dislocation mobility
models are smaller than the apparent values obtained from experiments.
In a schematic way and if diffusion processes are neglected, the temper-
ature dependence of the flow stress may look like that in Fig. 5.25. At high
temperatures (HT), the deformation is athermal. The flow stress depends only
weakly on the temperature owing to the temperature dependence of the shear
modulus. Changing to lower temperatures may result in one or more ther-
mal ranges with stronger temperature dependencies, for example, LT1 with
localized obstacles and LT2 with the Peierls mechanism. It is very common
to extrapolate the athermal high-temperature range to low temperatures to
obtain the internal back stress τ
i
also for lower temperatures, as indicated
in the figure. However, this treatment is based on the supposition that the
internal structure remains constant at all temperatures. This may approxi-
mately be true if a specimen is deformed at a high temperature, then cooled
down to a low temperature and deformed again. In the general case where
individual specimens are deformed at different temperatures, the dislocation
microstructure, in general, and the dislocation density, in particular, are dif-
ferent at each temperature. In the first stage of deformation, the dislocation
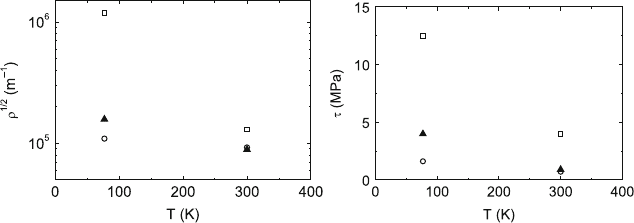
density increases very rapidly. As the multiplication rate depends on the effec-
tive stress (5.2), and this in turn on the temperature, the dislocation densities
at the yield point are expected to drastically increase with decreasing tem-
perature. This is shown in Fig. 5.26 using the data of NaCl single crystals
deformed at room and liquid nitrogen temperatures. The dislocation densities
are considerably higher in the crystals deformed at liquid nitrogen temper-
ature. Thus, the assumption that the athermal part of the flow stress does
not, or only weakly, depend on temperature is generally not fulfilled. A better
approximation is certainly the validity of the Cottrell–Stokes law [318], that
is, the proportionality between the thermal and athermal flow stress parts.
This law was originally formulated for the stress variation by work-hardening
but may apply also to other cases.
Most mechanisms described in Chap. 4 controlling the dislocation mobility
and causing a thermal contribution to the flow stress do not depend on the
5.2 Work-Hardening and Recovery 187
Fig. 5.26. Dependence of the square root of the dislocation density and the (shear)
flow stress on the temperature in deformed NaCl single crystals of different divalent
impurity concentrations: 1.7 ppm residual impurities (open circles), 32 ppm Ca
++
(full triangles), 136 ppm Ca
++
(open squares). Data from [177]
plastic strain. However, in many materials also the thermal part of the flow
stress increases during work-hardening, for example, being manifest by an
increasing strain rate sensitivity with increasing strain. There are only few
mechanisms explaining such a behavior. One of them is dislocation cutting
where part of the energy may be supplied by thermal activation. Frequently,
the obstacle distance obtained from the strain rate sensitivity is in the range
of the distance between forest dislocations and scales with the reciprocal stress
(e.g., [319]). The other possible mechanism is the interaction between moving
dislocations and debris. No detailed data as to this possibility are available yet.
In the literature, there are several attempts to link the dynamics of the
motion of individual dislocations with the continuum theory of plastic defor-
mation by the motion of many dislocations as it was founded by Kr¨oner [320].
Recently, Hartley [321] extended these theories by introducing a dislocation
density vector for a particular slip system, which describes the net length of
the dislocation lines with the same Burgers vector in the respective volume
element. The orientation of the vector is given by the ratio of the total length
of screw and edge components. Besides, a dislocation mobility tensor relates
the velocity of a dislocation configuration in the volume element to the net
Peach-Koehler force on the configuration. As an example, the cutting of a
forest dislocation is treated yielding a plastic potential to establish a flow law.
5.2.3 Experimental Determination of the Stress Components
Several special sequences of changing the macroscopic deformation parameters
had been designed to determine the effective stress. They will not be discussed
here in detail because of their restrictive assumptions involved. Looking at
Fig. 5.20, one may conclude that dislocation motion is possible only as long as
the applied stress is higher than the amplitude of the internal stresses, τ>τ
A
,
or, alternatively the applied stress is higher than the internal back stress,
τ>τ
i
. Thus, in a stress relaxation experiment, the relaxation rate should tend

188 5 Dislocation Kinetics, Work-Hardening, and Recovery
Fig. 5.27. Stress dip test on a cubic zirconia single crystal deformed at 1,180
◦
C,
consisting of short stress relaxations R
n
and partial unloadings U. Data from the
work in [324]
to zero when the stress reaches the athermal level. These long-time relaxation
tests require a very stable testing machine to record strain rates of the order of
10
−8
s
−1
. Because of (2.7), the relaxation time is short if the stiffness S of the
testing machine (plus specimen) is high. A high machine stiffness is reached by
electronic strain control. Nevertheless, even if the relaxation rate is low, there
may still be an appreciable effective stress. The time of the experiment can be
reduced by so-called stress dip tests [322]. A recent application is described
in [323]. In these tests, the machine is stopped for a relaxation test. After
sufficiently long recording to observe the actual relaxation rate, the stress is
reduced by partial unloading followed by another period of relaxation, and so
on. With decreasing load, the relaxation rate decreases but at a stress below
the athermal flow stress, the relaxation rate changes its sign as the dislocations
rearrange and move backwards in the internal stress field. In this way, it is
possible to approach the athermal stress level from both sides. An example
is shown in Fig. 5.27. Of course, one prerequisite to these methods is that
recovery does not take place during the time of the experiment.
In heterogeneous dislocation structures, the internal stresses can be studied
by X-ray diffraction. Changes in the lattice parameter as a consequence of
internal stresses cause an asymmetrical broadening of the diffraction profiles
because of the different volume fractions of the hard and soft regions with their
different internal stresses. This method has been applied to cell structures and
subgrain structures [325,326].
One way of estimating the athermal stress component also in homogeneous
dislocation structures consists in the determination of the dislocation density
and the application of (5.11) with a suitable interaction constant α. The dislo-
cation density is defined as the dislocation length per unit volume. Frequently,
it is measured as the number of points of dislocations emerging through the
unit area of an external surface or a cross-sectional plane of a deformed spec-
imen. The relation between both definitions depends on the slip geometry.
In most cases, setting the dislocation density equal to twice the density of
emergence points is a good approximation [327]. The points of dislocations
5.2 Work-Hardening and Recovery 189
emerging through surfaces can be marked by etching a cleavage or polished
surface as mentioned in Sect. 2.2. The etch pits can be observed by optical
microscopy up to a density of about 10
11
m
−2
. Replicas of smaller etch pits
produced by the heavy metal carbon shadowing technique can be observed
in the transmission electron microscope. This method allows one to count
representative values of intermediate dislocation densities up to 10
13
m
−2
.
Higher densities of dislocations are determined from diffraction contrast
TEM images of thin films of the deformed samples. From the total projected
length Λ imaged within the area A, the dislocation density is calculated by
=4Λ/(πAt) [328]. Here, t is the foil thickness, which can be determined from
the emergence points through both surfaces of a dislocation lying on a known
plane, or by other methods of diffraction contrast TEM. A simpler method
consists in superimposing a rectangular net of two sets of parallel straight lines
of nonconstant spacing onto the micrograph. The dislocation density is deter-
mined by counting the numbers of intersections N
1
and N
2
of the dislocations
along the two respective sets of grid lines. With the total lengths L
1
and L
2
of the grid lines, the dislocation density becomes =(N
1
/L
1
+ N
2
/L
2
) /t
[329]. If randomly oriented lines are used, the dislocation density is esti-
mated by =2N/(Lt) [330]. TEM extends the range of dislocation density
measurements up to about 10
16
m
−2
. It has to be considered, however, that
part of the dislocations may be invisible because of contrast extinction at the
particular imaging vector. Depending on the latter, in the f.c.c. lattice, the
fraction of the extinguished dislocations may amount up to 50%.
High dislocation densities can also be determined from the broadening
of X-ray diffraction profiles. A high sensitivity is necessary, which can be
achieved in the so-called self-focusing arrangement where the contribution
of the wavelength dispersion to the instrumental line-broadening disappears
[331]. The full width at half-maximum of the X-ray lines can be represented
by the modified Williamson–Hall plot [332] according to
ΔK ≈ 0.9/D +(π/2)
1/2
Mb
1/2
KC
1/2
+ higher terms in K
2
C,
where θ is the diffraction angle, λ the wavelength of the X-rays, K =2sinθ/λ,
and ΔK =2cosθ(Δθ)/λ. D is the particle or subgrain size, b is the magnitude
of the Burgers vector, and is the dislocation density. Furthermore, M is a
constant depending on the outer cut-off radius of the dislocations, and C is
the dislocation contrast factor, which depends on the relative orientations
between the Burgers and line vectors of the dislocations and the diffraction
vector as well as on the elastic constants. For cubic crystals, C values have been
calculated in [333]. The contributions to the line broadening from the particle
size and from the strains due to dislocations can be separated by plotting
ΔK vs. KC
1/2
. The method has been applied, for example, to determine the
gradients in the dislocation density between the bulk and surface regions of
deformed crystals.
The most sensitive and spatially resolving technique is the measurement
of the effective stress by using the dislocationsthemselvesasaprobe,thatis,
