Litton C.W., . Reynolds D.C., Collins T.C. Zinc Oxide Materials for Electronic and Optoelectronic Device Applications
Подождите немного. Документ загружается.

25
C and 1 atm and were determined for Zn
2þ
, Zn(OH
þ
), ZnðOH Þ
0
2
, and ZnðOHÞ
3
by
employing a hydrogen electrode concentration cell and periodic sampling of cell
potentials. Solubility data at temperatures up to 200
C for Zn(OH
þ
), ZnðOHÞ
0
2
, and
ZnðOHÞ
3
, and at temper atures up to 290
C for Zn
2þ
, were also obtained. The authors
concluded that ZnðOHÞ
2
4
was the predominant species in OH
solutions above 0.1 M
NaOH. Khodakovsky and Yelkin also concluded that ZnðOHÞ
2
4
was the dominant species
in alkaline solution at the high temperatures and high pH values at which bulk crystals are
grown.
[59]
Wang
[27,28]
and Li et al.
[29]
performed systematic studies of the morphology and growth
rates of ZnO powder in alkaline solutions. Starting with Zn(OH)
2
colloids as nutrient, they
investigated morphological changes as a function of pH (see Figure 8.11).
[27]
The study assumed that ZnðOHÞ
2
4
growth units were the predominant species in
solution when hydroxide colloids were dissolved. These growth units have a tetrahedral
form and charge distribution similar to those of ZnO, which itself is a series of tetrahedra
(Figure 8.12).
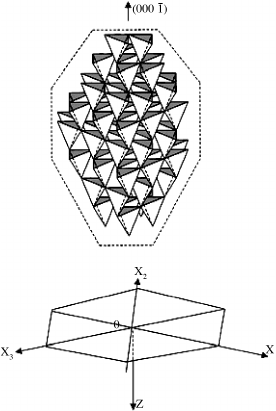
[29]
The corner (point) of a ZnO tetrahedron can bind with three hydroxide
growth units, the edge with two growth units, and the face of the tetrahedron with only one
growth unit. The viscosity of the hydrothermal growth solution is low, so the crystal
interface structure plays a large role in kinetics. Thus analysis of Figure 8.12 would predict
the following relative growth rates under ideal conditions:
vh0001iHvh01
1
1iHvh0
110iHvh01
11iHvh000
1i
The hydrox ide growth units cluster together by dehydration. In strong alkali solution
these clusters are shielded by ions such as NaO
, shielding the growth units and slowing
down growth. Wang contends that these mechanisms account for the growth rates and
shape of bulk ZnO crystals in strong alkali solutions.
Basicit
y
(N)
(000 1)
72
Reactive time (h)
Reactive temperature (ºC)
200 250 300 350
48 24
(0001)
(10 11)
(000 1)
(000 1)
(10 10)
1N 3N 5N
Figure 8.11 Morphological changes of ZnO crystallites with increasing pH of the growth
solution. Reprinted from B.G. Wang, E. W. Shi and A. Z. Zhong, Understanding and Controlling
the Morphology of ZnO Crystallites under Hydrothermal Conditions, Cryst. Res. Technol. 32,5
659–667. Copyright (1997) WILEY-VCH Verlag GmbH & Co. KGaA
Growth Kinetics of Hydrothermal ZnO 203
Demianets and Kostomarov proposed the same mechanism, but argued that ZnðOHÞ
2
4
dissociates into ZnO
2
2
þ2H
þ
, and that the ZnO
2
2
concentration increases with increasing
pH.
[33]
Reaction of one ZnO
2
2
with the zinc surface of the crystal allows two ZnO units to
form, whereas reaction on the oxygen surface allows only one ZnO unit because of charge
compensation.
Impurities and dopants further complicate growth kinetics. Addition of lithium to the
solution, as hydroxide or carbonate, improves the quality of the bulk ZnO crystals but also
reduces the growth rate in the (0001) facet while increas ing the rate on the (10
10)
facets.
[60,61]
This may be due to the shielding mechanism mentioned above.
Sakagami found that hydrothermal ZnO crystals have tens of ppm excess zinc.
[32]
He
therefore added H
2
O
2
as an oxidizer; excess zinc was reduced to 1–2 ppm. The addition of an
oxidizer like H
2
O
2
slows the growth rate on all faces, especially the C
facet.
[34]
Manganese
and nickel had no effect on the kinetics but did color the crystals red and green, respectively.
No effect of these dopants on the electrical resistance could be discerned.
[34]
Addition of
NH
4
þ
increased the growth rate on the (10
10) facets, but crystal quality was degraded.
[34]
Demianets et al. published a more detailed paper on the effect of Li
þ
and several of the
divalent and trivalent metals (Co
2þ
,Fe
2þ
,Mn
2þ
,Fe
3þ
,Mn
3þ
,Sc
3þ
,In
3þ
) on the growth
kinetics and morphology of hydrothermal ZnO.
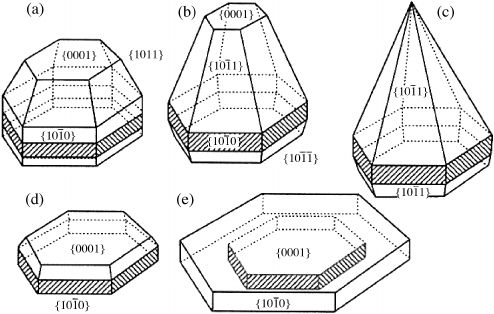
[54]
Figure 8.13 shows as metallic impurities
are increased in the ZnO growth medium, P-plane facets are formed and C-axis growth rates
decrease.Thedecrease ingrowthratescan beexplainedbytheshielding effectsimpurities can
have on the matrix compound (i.e. ZnO) as discussed above by Wang.
Figure 8.12 ZnO crystal structure image represented in the form of the coordination tetrahe-
dron along the x-direction (C
surface made up of flat faces at the top). Reprinted from W. J. Li,
et al., Growth mechanism and growth habit of oxide crystals, J. Crystal Growth 203, 186.
Copyright (1999) with permission from Elsevier
204 Growth Mechanisms and Properties of Hydrothermal ZnO
8.6 Properties of Bulk Hydrothermal ZnO
8.6.1 Extended Imperfections (Dislocations, Voids, etc.) and Surface Studies
Because hydrothermal ZnO and quartz are both amphoteric single-component oxides,
many insights into hydrothermal ZnO can be obtained from studies of hydrothermal quartz
growth, which has been intensely investigated during the last 50 years. Laudise and
Barnes
[35]
and Armington
[36]
have published excellent reviews on the growth of high
perfection quartz and on dislocation mechanisms. Extended imperfections that can be
formed in both ZnO and quartz include:
.
Seed veils and etch channels. Small holes or channels filled with voids, water vapor, or
liquid, caused by etch tracks that form on seeds during initial growth.
.
Voids. Small holes filled with air, water vapor, or liquid; can occur whenever growth
conditions change abruptly at the growth surface (impurity clusters, cracks, or crys tal-
line particles from nutrient brought to growth interface by fluid flow).
.
Crevice flaws. Equivalent to dendritic growth in metals. Uneven or rough growth
caused by surface kinetics of growth faces. In extreme cases can cause gaps, cracks, and
large numbers of dislocations.
.
Dislocations. Equivalent to those in melt-grown bulk crystals. Strain-induced, because
of impurity incorporation or intersection of growth planes, dislocations often propagate
from seed into crystal.
.
Vertical etch channels. Equivalent to micropipes that form in vapor-grown crystals.
Dislocations decorated with impurities causing cylindrical voids that can reach from the
seed to the surface of the crystal.
All these imperfections have been observed in hydrothermal ZnO bulk crystals. Addit ion
of lithium, u se of low dislocation-density seeds, and use of high purity nutrient reduce the
Figure 8.13 Impurity effects on the morphology of hydrothermal ZnO crystals: (a) Li
þ
; (b, c)
Fe
þ
; (d) Mn
2þ
; and (e) In
3þ
Properties of Bulk Hydrothermal ZnO 205
concentrations of most imperfections. Lithium may reduce imperfections by decreasing
the surface free energy when lithium ions incorporate at the growth interface. Lithium may
also limit the incorporation of H
2
O and OH
into the crystal lattice at the growth
interface.
[14,15,62]
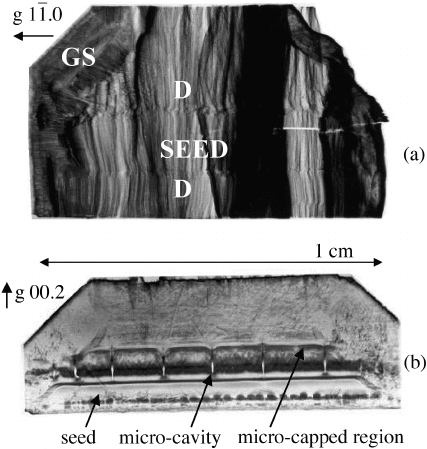
Synchrotron white-beam X-ray topography (SWBXT) in Laue configuration was
performed on a series of crystals grown at AFRL-Hanscom AFB.
[63]
To trace the growth
history of the crystal, (10
10) crystal plates containing both the seed crystal and the bulk
region were imaged. One set of topographs showed the usual propagation of edge
dislocations from the seeds [Figure 8.14(a)]. The growth sector boundary can also clearly
be seen, marking a change of growth morphology.
On several other crystals the topographs revealed a capping phenomenon similar to that
observed in KH
2
PO
4
.
[64]
Figure 8.14(b) shows that the dislocation density is very high near
the seed/crystal interface, revealing strain associated with growth initiation rather than
dislocations propagating from the seed into the bulk. A growth band, possibly because of a
fluctuation in the growth conditions, stops many of these dislocations. In some cases
micro-cavities originating at the seed/crystal interface were observed; the cavities heal
during subsequent growth, nucleating dislocations.
The cause of micro-capping has not been established. One possible mechanism is seed
etch-back during initial growth, due to fluctuations in the temperature gradient coupled
with seed misalignment from C-plane orientation.
Figure 8.14 Synchrotron white-beam X-ray topographs of ZnO seed-crystal interfaces: (a)
normal seed interface (D, dislocations; GS, growth sector boundary); (b) ZnO micro-capped
region, exhibiting micro-cavities and low dislocation generation above micro-capped region in
the C
þ
-direction. Adapted from G. Dhanaraj, et al., Growth and process induced dislocations
in Zinc Oxide crystals. Journal of Crystal Growth vol. 297, 74. Copyright (2006) with
permission from Elsevier
206 Growth Mechanisms and Properties of Hydrothermal ZnO
Surface studies on hydrothermal crystals showed the C
þ
surface to be smooth and
specular, with spiral hexagonal growth pyramids.
[34]
The C
surface is more three-
dimensional, with layer-like growth. The M-planes also have layered growth; the P-
planes have a series of terraces. No in-depth study has addressed the mechani sms
responsible for these various morphologies on the growth surfaces.
X-ray data from polished ZnO wafers cut from industrial hydrothermal ZnO have
recently been published. The quality of (0001) substrates was investigated by X-ray
rocking curve (XRC) measurements (Rigaku RINT-2000 diffractometer, CuK
a
, four
crystal Ge (220) channel monochromator, beam divergence 12 arc-sec, scan speed
0.01
min
1
, step width 10
4
) using the (0002) reflection. The full width at half-
maximum (FWHM) ranges between 19 arc-sec and 30 arc-sec after chemical–mechanical
polishing (CMP) compare d with values reported for ZnO wafers prepared from pressure-
melt grown ZnO, 49 arc-sec,
[65]
and rocking curves measured on ZnO fabricated by vapor
growth with FWHM (30 arc-sec).
[66]
X-ray reciprocal space mapping using the (0002)
symmetric reflection reveled a highly symmetric single peak with the FWHM from the v
scan of 15 arc-sec measured on hydrothermal ZnO substrates.
[67]
X-ray topography (CuK
a
, 40 kV, 10 mA, detected by a film IX80; Berg–Barrett
geometry) was measured on an epi-ready (0001) ZnO wafer 50 mm in diameter and
500 mm in thickness, supplied by Tokyo Denpa. The XRC FWHM from the (0002)
reflection of the sample was 19 arc-sec. Approximately 2500 scans have been assembled to
yield the cont rast-enhanced image of Figure 8.15(a). The (114) reflection at 2u ¼98.6
and
v ¼49.3
was used to obtain the image. The wafer appears very homogeneous over the
entire area. Slight contrast effects are seen, presumably due to slightly different lattice
parameters caused by fluctuations in the impurity concentration or stoichiometry.
The observation of an epi-ready (0001) 50 mm ZnO wafer under crossed polarizer is
shown in Figure 8.15(b). Only a small fraction of random strain was obser ved, which
Figure 8.15 (a) Transmission X-ray topograph of a 50 mm epi-ready (0001) ZnO wafer
produced by Tokyo Denpa. (b) Observation under crossed polarizer reveals little random strain
in a 50 mm (0001) ZnO wafer. Reprinted from D. Ehrentraut et al., Solvothermal growth of
ZnO, Prog. Cryst. Growth Charact. Mater. vol. 52. Copyright (2006) with permission from
Elsevier
Properties of Bulk Hydrothermal ZnO 207
supports the result from the X-ray topography that the homogeneity of the wafer is
very high.
Measurements employing contact-mode atomi c force microscopy (AFM) under ambi-
ent air conditions have revealed a root mean square (rms) roughness of 0.285 nm and
0.155 nm for the (0001) and (000
1) face, respectively, for ZnO wafers which are treated by
CMP. Thermal annealing further reduces surface roughness to about 0.12 nm if proper
conditions are applied.
[67]
The etch pit densi ty (EPD) was determined for the (0001) and (000
1) polar face of
several wafers. An aqueous solution of concentrated H
3
PO
4
was applied for 5 min at 25
C.
The EPD was about 300 cm
2
after CMP and is further lowered to less than 80 cm
2
by
annealing.
[68]
To our knowledge these wafers are the best hydrothermal ZnO wafers in
terms of structural perfection that are currently commercially available.
8.6.2 Impurities
We introduce the occurrence and distribution of impurities in hydrothermal ZnO by
referring to crystal ZnO34A, grown at AFRL-Hanscom AFB, and samples cut from the
crystal.
[12]
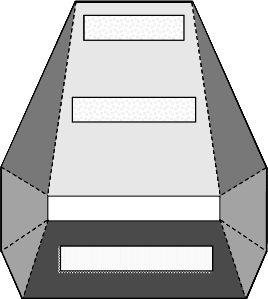
Figure 8.16 illustrates the faceted crystal morphology of ZnO34A and labels
the three slices that were analyzed. Slice ZnO34A3, from the C
sector, was a darker green
than slices ZnO34A1 and ZnO34A2, which were taken from the C
þ
sector. In the C
þ
sector, coloration became less intense as distance from the seed increased.
The differences in coloration, together with the discussion of Section 8.5 and the fact
that the crystal growth rate in the C
þ
direction was 3 times the growth rate in the C
direction, may mean that impurity incorporation differs between the C
þ
and C
sectors.
Slice 34A1
Slice 34A2
Seed
1011
1010
1011
1010
Slice 34A3
Slice 34A1
Slice 34A2
Seed
0001
Slice 34A1
Slice 34A2
Seed
1011
1011
1011
Slice 34A3
Slice 34A1
Slice 34A2
Seed
0001
Slice 34A3
–
–
––
–
––
–
–
Figure 8.16 Schematic of AFRL-Hanscom AFB crystal ZnO34A. Reprinted from M. Suscavage,
et al., MRS Internet J. Nitride Semiconductor Res. (USA) vol. 4, p.294. Copyright (1999) with
permission from MRS
208 Growth Mechanisms and Properties of Hydrothermal ZnO
Chemical and electrical analyses support such an inference, but also point to a more
complex story. Glow discharge mass spectrometry (GDMS ) showed the dark sector
contains 3–5 ppm of iron, about twice as much as in the lightest colored sector, in general
agreement with Croxall et al.
[31]
This is qualitatively consistent with electrical
measurements, which showed that ZnO34A3 had a free electron concentration of 3 10
18
cm
3
at room temperature, whereas ZnO34A1 had donor and acceptor concentrations of
only N
D
¼7 10
15
and N
A
¼1 10
15
cm
3
. However, slice ZnO34A1 contained about
twice as much Al (known to be a shallow donor)
[69]
and Si (5–6 ppm) as ZnO34A3. (All
other impurities occurred at G1 ppm in this crystal.) The anisotropic incorporation of
impurities was also conferred by Sekiguchi et al., who reported impurity concentration
variations among crystals that were grown under various conditions of temperature and
pressure but that otherwise were nominally identical.
[53]
ZnO seems to have a high affinity for iron in hydrothermal growth. The ZnO nutrie nt
Croxall et al. employed contained G1ppm Fe, but green sections of their crystal contained
50 ppm. In our laboratory, ZnO crystals contained parts per thousand of iron if platinum
liners leaked, thereby allowing the diluted growth solution to leach iron from the autoclave
wall.
Secondary ion mass spectrometry (SIMS) was employed to study the impurity
distribution in the depth of a commercial 50 mm diameter hydrothermally grown ZnO
wafer from Tokyo Denpa Corporation which had been CMP treated and afterwards
annealed. The primary beam species was Cs
þ
(5 kV, 350 nA) and the sputter speed was
around 120–150 nm min
1
. The impurity levels remain constant with increasing scan depth
and concentrations have been revealed for Li (2 10
16
cm
3
), Na (8 10
15
cm
3
), K
(3 10
15
cm
3
), Mg (10
16
cm
3
), Al (4 10
15
cm
3
), Si (7 10
17
cm
3
), Fe (8 10
15
cm
3
)
and Cd (10
17
cm
3
).
Impurity concentrations of Fe, Al, Li and K using inductively coupled plasma mass
spectrometry (ICP-MS) from 50 mm diameter ZnO wafers cut from the same h ydrother-
mal crystalline boule have also been investigated.
[48,68]
Specimens grown and cut from the
(000
1) face and from the (0001) face of the seed crystal show different impurity levels.
Lower impurity levels are generated in the grown crystal at increasing distance from the
(000
1) face of the seed. This was particularly obvious for the case of Li whereas the
concentration of K remains nearly unchanged for both faces. Both Fe and Al show higher
concentrations in wafers grown on the (000
1) face of the seed crystal: 11 and 1 ppm for Fe
and 8 and 0.5 ppm for Al for the (000
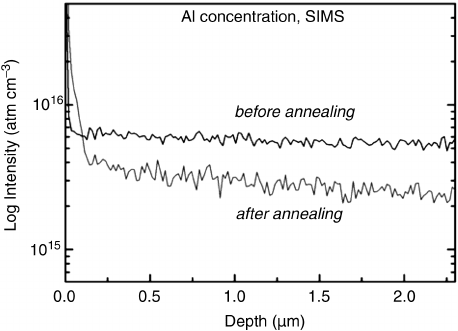
1) and (0001) face, respectively. Figure 8.17 shows
that the concentration of Al can be reduced by a factor of up to three upon proper
annealing.
[47]
There is a similar result for Li, which can be reduced by about one order of
magnitude to currently 10
16
cm
3
.
To summarize, impurity concentrations in hydrothermal ZnO depend not only upon the
purity of the starting materials but also upon growth conditions (solution chemistries,
growth temperature, etc.) in ways that have yet to be fully characterized. Fe, Ag, Si, Na, Li,
K and Al have been found in hydrothermal ZnO crystals; the concentrations vary from run
to run. Nonetheless, sub-ppm impurity and sub-10
16
cm
3
donor/acceptor concentrations
have been achieved, demonstrating that hydrothermal ZnO crystals can have purities that
rival or exceed the purities of bulk ZnO grown by other methods – purities, in fact, that
rival or exceed those of III–V semiconductors such as InP and GaN.
Properties of Bulk Hydrothermal ZnO 209
8.6.3 Electrical Properties
Studies of the electroni c and optical properties of hydrothermal ZnO are similar to studies
of ZnO grown by other techniques. Differences in emphasis relate primarily to issues
associated with solution growth, with incorporation of Li, and with opportunities created
by the production of highly faceted crystals.
Li is often added to hydrothermal solutions as hydroxide or carbonate because it
improves crystallinity and morphology.
[70]
Li can therefore occur in concentrations
of H10 ppm in hydrothermal ZnO;
[32,53,71]
it has been employed to achieve resistivities
as high as 10
10
ohm cm by compensating native donors.
[71]
Li is anathema, however, to
most electronic and optical device fabricators, who fear that Li – typically a fast diffuser –
will incorporate into devices and thereby “poison” them. This may not be an insurmount-
able obstacle to device applications, for Li apparently can be removed from ZnO by
annealing in a zinc atmosphere.
[15]
Also, using appropriate mineralizer solutions, it is
possible to obtain high quality as-grown hydrothermal ZnO crystals that have sub-ppm
Li concentrations.
[12]
In, Ga and Al are shallow donors in ZnO.
[69,72]
As mentioned above, Li occupying the
Zn site is believed to be an acceptor (interstitial Li is believed to be a donor);
[15]
addition of
Li or Cu increases the resistivity of ZnO after annealing in air or Zn,
[13–15,31]
probably by
compensating donors. The donor/acceptor properties of Fe
2þ
and Fe
3þ
in ZnO are not
known. The role of hydrogen in ZnO is controversial: recent theoretical calculations
predict it should be a shallow donor,
[73]
in overall agreement with experimental measure-
ments performed in the 1950s that associated increases in electrical conductivity with
hydrogen incorporation (reviewed in Van de Walle);
[73]
however, in recent work on ZnO
films grown by metal organic chemical vapor deposition, the conductivity increase was
attributed to passivation of acceptors.
[74]
Hydrothermal growth of ZnO in an effective
overpressure of H
2
was achieved by adding Zn powder to the growth solution; unfortunately
Figure 8.17 SIMS depth scans in the surface-near region demonstrating the effect of annealing
on the Al concentration
210 Growth Mechanisms and Properties of Hydrothermal ZnO
only the carrier concentrations after annealing in vacuum or air (2–5 10
15
cm
3
), not carrier
concentrations in as-grown ZnO, were reported.
[15]
Native defects such as oxygen vacancies or zinc interstitials have long been regarded as
donor centers in ZnO (see, e. g., Littbarski
[70]
and Look et al.
[75]
and references therein). In
many cases, they may constitute the most numerous donor sites. In sample ZnO34A3
(discussed in Section. 8.6.2), for example, impurity concentrations are in the ppm range,
but the free electron concentration at room temperature is about two orders of magnitude
higher, 3 10
18
cm
3
. This does not by itself exclude hydrogen as a possible donor, but
Sakagami’s observation that the ZnO electrical resistance increased when an oxidizing
agent was added to the hydrothermal growth solution (equivalent to growth in an oxygen
overpressure)
[32]
is indirect evidence that many donor defects result from imperfect
zinc–oxygen stoichiometry. Positron annihilation spectroscopy on hydrothermal ZnO
from Tokyo Denpa has revealed about 10
16
cm
3
zinc vacancies (V
Zn
) as neutral defect
complexes and about 10
17
cm
3
oxygen vacancies (V
O
) as neutral oxygen.
[76]
Clear effects
of V
Zn
and V
O
and Li-related defects can be seen in the low temperature photolumines-
cence (PL) spectrum obtained from excitation with a 325 nm laser (P
out
¼1.6 mW).
[77]
Clearly the role of native defects and their relationship to extrinsic point defects is a
complicated issue that needs to be elucidated further.
Semi-insulating behavior in hydrothermal ZnO has, as already noted, been achieved
through Li doping
[72]
and growth in an effective oxygen overpressure.
[32]
Semi-insulating
behavior, with a net room temperature free electron concentration of 2 10
12
cm
3
, and
electron mobi lity of 175 cm
2
V
1
s
1
, was observed. The cause of this behavior was found
to be a donor center located 340 meV below the conduction band;
[12]
the microscopic
nature of this donor is not understood.
The temperature-dependent Hall-effect technique with Van der Pauw geometry was
used to examine the carrier concentration N, carrier mobility m
H
, and electrical resistivity
R from a 10 10 mm
2
specimen cut from a high-quality Tokyo Denpa ZnO crystal. The
surface was polished to an rms roughness of about 0.2 nm
[47]
and Ti/Au contacts were
produced by thermal evaporation. A melt-grown sample was measured for comparison.
The carrier concentration is substantially lower in the hydrothermal sample than in the
melt-grown sample and decreased with increasing 1/T from N ¼2 10
16
cm
3
at 500 K
(10
3
/T ¼20) to N ¼4 10
13
at 100 K. Polyakov et al.
[78]
have obtained similar results of
N ¼1.3–4.6 10
13
and N ¼6.4 10
11
at 300 K and 77 K, respectively, for measurements
on four samples of ZnO as purchased from Tokyo Denpa. The value of N is clearly the
effect of low impurity, point defect, and disloca tion concentrations, which substantiates
the results previously discussed from X-ray diffraction and impurity analysis. The slight
hysteresis slope at 10
3
/T G 4 was obtained from the measurement during heating up and
cooling down and is likely the effect related to surface conductivity.
[79,80]
It has been noted
in Graubner et al.
[81]
that annealing at 1150
C would convert a ZnO substrate from highly
resistive to n-type conductive. The higher numbers of shallow donors reduce the
concentration of acceptors by com pensation and are clearly the dominate cause of the
high conductivity.
The Hall mobility peaks at 100 K, m
H
¼530 cm
2
V
1
s
1
and drops down to about
40 cm
2
V
1
s
1
at 580 K. The higher mobility in comparison with the melt-grown
sample, that peaks at 480 cm
2
V
1
s
1
at 80 K and 430 cm
2
V
1
s
1
at 100 K, is due to
the lower impurity concentration as indicated by the lower carrier concentration. An
Properties of Bulk Hydrothermal ZnO 211
earlier hydrothermal grown sample
[2]
had already showed very similar results for m
H
for
the measured temperature range of 200–400 K, where the m
H
decreased from about 300
to 100 cm
2
V
1
s
1
. The vapor grown ZnO shows a higher m
H
up to almost 2000 cm
2
V
1
s
1
at 40 K. These results are expected, for ZnO compared with GaN has a lower
mobility because of a higher effective mass and larger optical phonon scattering
parameter.
[2]
The electrical resistivity of the hydrothermal ZnO sample is about two orders of
magnitude higher than the sample grown from the melt, with a minimum of 20 W cm at
60 K and 0.1 W cm at 200 K, respectively. Hydrothermal ZnO from the Russian producer
SPC GoodWill
[82]
shows a higher electrical resistivity of 500–1000 W cm than the TEW
material. Other results on TEW ZnO
[78]
reported a large variation of R between 96 W cm
and 5 10
5
W cm, which was speculated to come from the Li content in the samples
investigated. It is possible that different growth sectors were present in the specimens and
therefore Li was incorporated in quite different concentrations there.
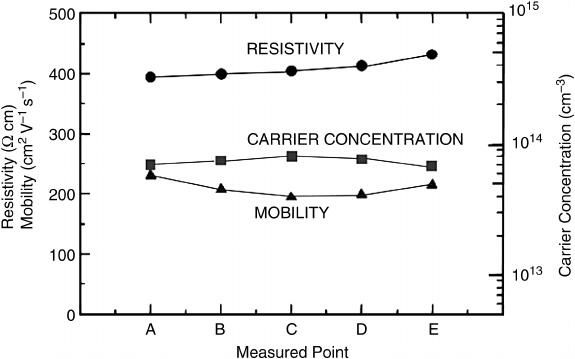
The uniformity of resistivity R, carrier concentration N and mobility m
H
over a 50 mm
wafer from Tokyo Denpa was measured (Figure 8.18) and the following values obtained:
R ¼380 W cm 15%, N ¼8 10
13
cm
3
20% and m
H
¼200 cm
2
V
1
s
1
10%.
[68]
Hydrothermal conducting indium-doped ZnO was grown using sintered ZnO powder
that was mixed with a sma ll percentage of indium oxide.
[83]
As previously stated, growth
rates were dramatically reduced in the C-axis (see Figure 8.13). The resistivity measure-
ment for a 5 5mm
2
In:ZnO sample was 2.1 10
2
ohm cm. The conductivity achieved
is adequate for most semiconductor device applications that would benefit from conduct-
ing substrates.
The presence of large growth facets on hydrothermal Zn O crystals (Figures 8.9, 8.10
and 8.15) facilitates the study of electronic properties as a function of crystallographic
orientation and surface polarity. Urbieta et al. employed scanning tunneling microscopy
and found clear differences in surface electronic structure that distinguished the C
þ
Figure 8.18 Resistivity, carrier concentration, and mobility across a hydrothermal 50 mm epi-
ready ZnO wafer
212 Growth Mechanisms and Properties of Hydrothermal ZnO