Lima J.J.Pedroso, de (ed.). Nuclear Medicine Physics
Подождите немного. Документ загружается.

408 Nuclear Medicine Physics
dV
1
dV
2
D
1
(a) (b) (c)
Recorder
D
2
t
2
t
2
t
1
t
1tt
cpm
cpm
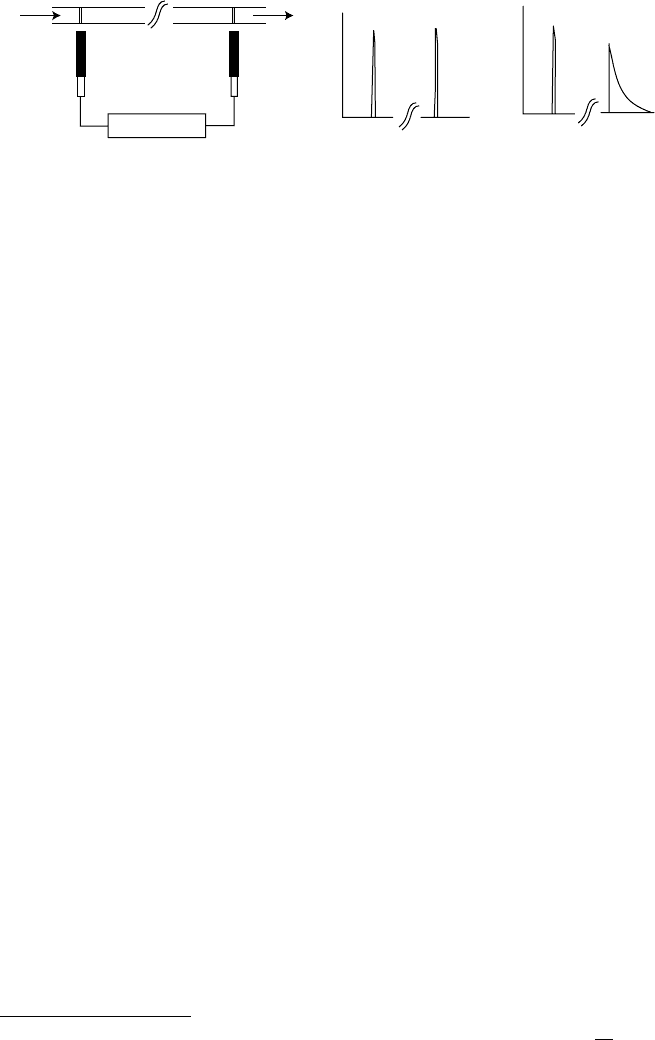
FIGURE 7.37
(a) Tube with a liquid flow and two radiation detectors applied to small volumes dV
1
and dV
2
.
(b) Responses of the two detectors D
1
and D
2
as a function of time are obtained in the same
record. (c) Responses of the detectors if a bolus of a radioactive tracer is injected at the entrance
of the tube and assuming the flow in the tube is laminar.
Supposing that a single, small radioactive particle is injected at the entrance
of the tube, and the particle follows its path without incident, the responses of
the two detectors as a function of time in the same plot are as in Figure 7.37b.
The small particle has passed through the tiny volumes seen by the detec-
tors at times t
1
and t
2
, respectively. This experiment with just one particle is
probably the only situation in tracer dynamics in which the output curve is
not only predictable but also equal to the input curve.
If we inject not a particle but a bolus of radioactive tracer miscible in the liq-
uid stream and assume the flow regime in tube is laminar, the output response
is different from the input one, as shown in Figure 7.37c. It was assumed in this
example that the input is a very fast injection which we call impulse function
(or impulse injection), or delta function.
The input and output curves are different but the output is predictable,
∗
that is, if the input is an impulse function and the flow is laminar we can
predict what the output curve will be like.
In most of the situations of interest to biology and medicine, the systems are
much more complex than single tubes. The injected particles can not only have
a range of different paths but they can also be drawn by a range of different
velocities of flow within the system. So these will have to be considered to be
chaoticsystems in whichthe processesarerandom in nature. We areinterested
in the overall statistical properties of the population of particles, and we are
dealing with density functions and statistical distributions. Contrary to the
preceding cases, one cannot deterministically predict the output curve.
Mean transit time is the average time necessary for tracer molecules to move
between two points, which may or may not include a compartment.
Mean residence time is the average time tracer molecules stay in a space
where they have been deposited or dragged to.
Both these times depend on the flow that drags the tracer and on the volume
of the dispersing system.
∗
The response function for a catheter of length L and minimum transit T is h(t) =
T
2t
2
.
Systems in Nuclear Medicine 409
dV
1
dV
2
D
1
Recorder
D
2
t
1
t
a
t
b
12
t
cpm
(a)
(b)
cpm
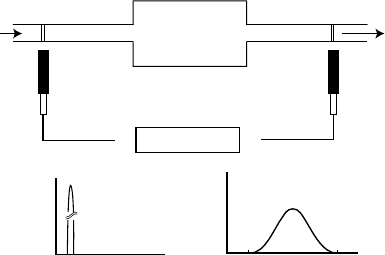
FIGURE 7.38
(a) Residue detection. (b) Responses of detectors D
1
and D
2
, in a real system. The output curve
is a widened curve showing the transit times of the particles distributed between times t
a
and t
b
.
Transit times are generally obtained by measuring at input and output, by
detection or direct sampling (Figure 7.38b). Since the tracer molecules can
have very different paths in a dilution system, their output concentration
varies with time to give a transit time curve (or a histogram in the case of
sampling). In other words, a time or activity or time or concentration curve
is obtained, with a profile that depends on the input function profile and on
the characteristics of the dilution system and that can be used to calculate the
mean transit time and volume.
Residence times are obtained by residue detection, with which the total
tracer activity that remains in the system is measured, generally by external
detection (Figure 7.38a). This type of detection is convenient and often the
only possibility available, but it has the disadvantage in that an accurate
definition and exclusive detection of the regions of interest are sometimes
hard to achieve, frequently leading to the need to make further corrections.
Suppose that for a spike of radioactive tracer in a real system curve 2 is
obtained at the output (Figure 7.38b).
The particles injected at time t
1
in an impulse injection came out as a
widened curve showing the transit times of the particles distributed between
times t
a
and t
b
. There is a statistical distribution of transit times.
We can see from the shape of the curve that the transit times which occurred
most often were those located about half way between t
a
and t
b
. The output
curve is an indication of how probable (frequent) a given value of transit time
has been.
If we call dV
2
the element of volume seen by the output detector 2, F the
flow through the system C
2
(t) the tracer concentration at the output then the
amount of tracer present in dV
2
between t and t +dt is
dq
2
(t) = dV
2
C
2
(t) (7.181)
410 Nuclear Medicine Physics
f
(t)
f
(t)
ttt + dt
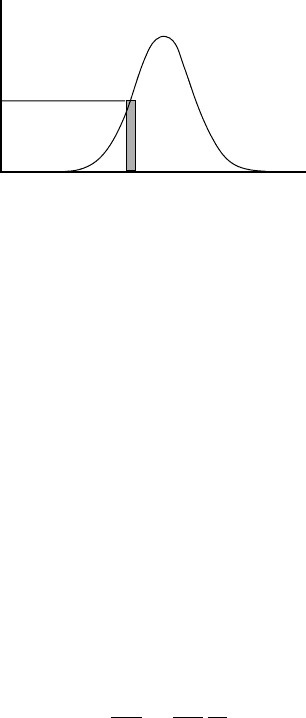
FIGURE 7.39
The area of the shaded rectangle is f (t) dt = dq
2
and it represents the elementary amount of the
label that has crossed the system between instants t and t + dt.
Defining a function f (t) = f(t) = (dq
2
/dt) which, for every value of t
represents the rate of change of the amount of tracer in volume dV
2
, is also
dq
2
(t) = f (t) dt (7.182)
In Figure 7.39, the area of the shaded rectangle f (t) dt = dq
2
represents the
elementary amount of tracer that has passed the system between times t and
t +dt.
The area under f(t) gives the total amount Q of injected label
∞
o
f (t) dt =
dq
2
= Q (7.183)
Instead of f (t), it is more convenient to use another function (normalized)
given by
h(t) =
f (t)
Q
=
dq
2
Q
1
dt
(7.184)
The product h(t) dt is not the absolute amount of tracer that has crossed
the system between times t and t +dt but the fraction of the total amount of
injected tracer that has crossed the system between t and t +dt. Of course,
if we carry out an injection such that Q = 1, the area under the curve equals
unity, the curve is then normalized and f (t) = h(t). The function h(t) is called
the frequency function of transit times or unit responsefunction of the system.
The dimensions of h(t) are [T]
−1
.
After an instantaneous injection, the fraction of the total amount of label
that has left the system through 2 until time t, as a function of time, can be
obtained by
H(t) =
t
o
h(t) dt (7.185)
Systems in Nuclear Medicine 411
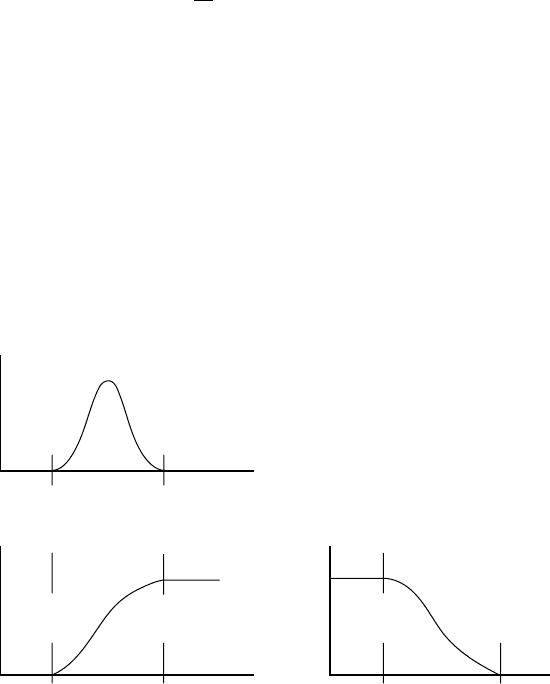
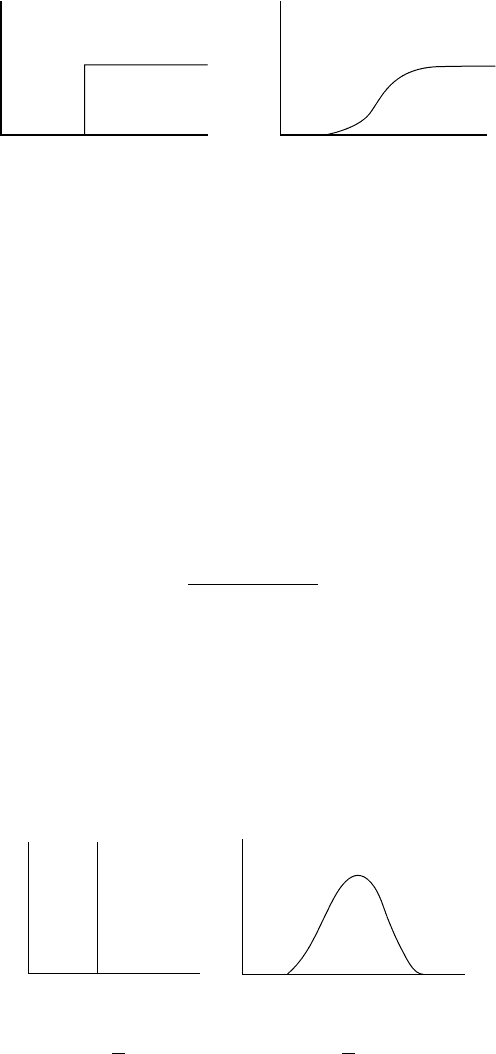
We call H(t) the cumulative frequency function (Figure 7.40b). The fraction
of the total amount of labeled tracer that has left the system by time t is the
area under h(t), between time zero and t, because the total area under h(t) is
the unit
H(∞) =
∞
o
h(t) dt = 1 (7.185a)
An obvious relationship is
d
dt
(H(t)) = h(t) (7.186)
Transit times and residence times are closely related to each other. For an
impulse input, the activity or time curve obtained by external detection at
the output that represents the transit times distribution can be converted
into the corresponding retention function r(t), that is, the activity or time
curve distribution of residence times (Figure 7.40c). In every time instant, the
fraction of the total tracer injected that remains inside the system is 1 minus
the fraction already eliminated H(t), leading to
r(t) = 1 −
t
o
h(t) dt =
∞
o
h(t) dt −
t
o
h(t) dt =
∞
o
h(t) dt (7.187)
h(t)
(a)
(b) (c)
H
(t) r(t)
t
m
t
t
M
t
m t
t
M
t
m t
t
M
FIGURE 7.40
(a) Frequencyfunction of transit times. (b) H(t) is the cumulative frequency function. It represents
the fraction of the total amount of tracer that leaves the system up to time t. (c) r(t) is the retention
function, or the fraction of the total amount of tracer within the system as a function of time, that
is 1–H(t).

412 Nuclear Medicine Physics
Then for every time instant t, the integration of curve h(t) between t and
infinity is a value of r(t), the retention function. Also true is
d
dt
(r(t)) =−h(t) and h(t) dt =−dr(t). (7.188)
The retention function is the residue curve for a unitary impulse input, and
it can be converted to the transit time distribution through differentiation and
multiplication by −1.
Let us return to the definition of mean transit time for the case of an impulse
injection of an activity Q in a dilution system and enter with Equation 7.187
for residue detection. Then
¯
t =
∞
0
tQh(t) dt
∞
0
Qh(t) dt
=
0
r(0)
−t dr
0
r(0)
−dr
=
∞
0
r(t)dt
r(0)
(7.189)
The mean transit time of a tracer,or the corresponding mean residence time,
respectively through or in an organ, space, or compartment is the quotient
of the total area under the residue curve and its initial height (t = 0 abscissa)
(Figure 7.41).
There is another way of obtaining the cumulative frequency function of
transit times, apart from the integration of h(t).
If the tracer is introduced into the system at a constant rate, after a sharp
rise (step function i(t)), the output will be the cumulative frequency function
(Figure 7.42).
If the input is a δ function, by definition the output is h(t). Then, since
δ(t) =
d
dt
[i(t)] and h(t) =
d
dt
[H(t)], (7.190)
r(t)
r(0)
Equal
area
t
M
tt
FIGURE 7.41
The mean transit time of a tracer equals its mean residence time, and it is the quotient of the total
area under the residue curve and its initial high (t = 0 abscissa).
Systems in Nuclear Medicine 413
Input
i(t) H(t)
t
o
tt
Output
FIGURE 7.42
If the tracer is introduced into the system at a constant rate, after a sharp rise (step function i(t)),
the output will be the cumulative frequency function.
we conclude that, by differentiationof the functions in Figure 7.42, at the input
and output, the same functions are obtained as in the case of an instantaneous
injection (Figure 7.43).
For a dilution system in which there is an impulse function of a tracer that
is exponentially cleared, the detected residue function of the system is of the
type Q exp(−αt). The mean residence time is
¯
t = 1/α.
If the residue curve is a double exponential with equation
Q(t) = Q
1
exp(−α
1
t) +Q
2
exp(−α
2
t),
the mean residence time will be
¯
t =
Q
1
/α
2
1
+Q
2
/α
2
2
Q
1
/α
1
+Q
2
/α
2
(7.191)
7.2.5.1 The Stewart–Hamilton Principle
Let us consider a dilution system perfused by a constant flow F and that at
t = 0 an instantaneous injection of an amount Q of tracer is administered.
The output function is Qh(t), and the amount of label leaving the system
between times t and t + dt is dq = Qh(t)dt. However, dq can also be given by
Input
i(t) H(t)
t
o
tt
Output
FIGURE 7.43
If input is a δ function, δ(t) =
d
dt
[i(t)] then the output is h(t) =
d
dt
[H(t)].

414 Nuclear Medicine Physics
the product of the elementary volume of liquid that leaves the system in the
same time interval, dV = F dt, multiplied by the tracer output concentration
C
0
(t):
dq = F dtC
0
(t) dt
Then
FC
0
(t) dt = Qh(t) dt. (7.192)
Integrating this equation between 0 and ∞, and considering the initial
conditions and that
∞
0
h(t)dt = 1
F =
Q
∞
0
C
0
(t)dt
(7.193)
which expresses the Stewart–Hamilton principle that used to be a familiar
equation for blood flow determination.
7.2.5.2 Volume Calculation
Let us suppose that in a labyrinth system, at instant t = 0, a liquid flow was
initiated and simultaneously there was a step function U(t) of a tracer, accom-
panying the liquid displacement. It is assumed that there is no transition
regime in the flow, that is, a stationary situation prevails from the beginning.
With these constrains, a function H(t) will be detected at the output.
For each value of t d[H(t)] is the fraction of the injected tracer with transit
times between t and t +dt. The value of d[H(t)] is also the fraction of the total
number of possible paths in the labyrinth with lengths whose crossing times
have to be between t and t +dt. Then the flow at the output that corresponds
to the paths with these particular lengths is F d[H(t)], and the volume of this
set of channels is
dV = Ftd[H(t)]. (7.194)
The total volume of the system corresponds to all groups of paths with
length corresponding to transit times between 0 and ∞being, using Equations
7.189 and 7.193,
V = F
∞
0
th(t)dt (7.195)
Considering the integral on the right-hand side of Equation 7.184 and the
definition of the mean value of a function is
∞
0
th(t)dt
∞
0
h(t)dt
=
¯
t (7.196)
Systems in Nuclear Medicine 415
that is, the mean transit time. Then Equation 7.197
V = F
¯
t. (7.197)
The volume of the system is equal to the product of the flow and the mean
transit time of the tracer through the system. Equality has been proved for a
stationary situation.
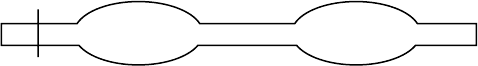
7.2.6 Distribution Systems and the Convolution Integral
Assume a series of two distribution systems in steady state (Figure 7.44) and
that there is an impulse injection of a tracer, δ(t), at the entrance of the first
member, at t = 0. Let the frequency functions of transit times for the members
of the series be h
1
(t) and h
2
(t), respectively.
Each liquid particle that leaves the series between time t and t +dt needs a
time between τ and δτ + dτ to cross the first element of the series and a time
between (t −τ) and (t −τ) +d(t −τ) to cross the second one.
The fraction of the total number of particles that crosses the first element
between times τ and τ +dτ is h
1
(τ)dτ.
If at time τ,aδ function is introduced at the input of the second element a
shifted frequency function of transit times would be obtained at the output
h
2
(t −τ).
All the element volume h
1
(τ)dτ leaving the first element can be considered a
δ function ofsmall amplitudethat is introducedat time t in thesecond element,
that is, h
1
(τ)dτd(t −τ), meaning a δ function with amplitude h
1
(τ)dτ applied
at instant t = τ.
The output for this function, which is the output of the series, is
h
1
(τ)h
2
(t −τ) dτ (7.198)
If all plausible τ values are considered for all t values, that is, if we consider
all the transit time values through element 1 which, added to possible transit
times through 2, make t, and if we calculate all the products h
1
(t) dτ assumed
as δ functions for the second element, with outputs h
1
(τ)h
2
(t −τ)dτ, the sum
of these output functions is the frequency function of the transit times through
δ(t)
12
FIGURE 7.44
Series of two distribution systems.
416 Nuclear Medicine Physics
the series, then
h(t) =
t
0
h
1
(τ)h
2
(t −τ) dτ (7.199)
If, for the same conditions, instead of considering the particles that leave
the first element at time τ, we consider those that need the same time τ to
cross the second element, then these particles need time (t −τ) to cross the
first element:
h(t) =
t
0
h
2
(τ)h
1
(t −τ)dτ (7.199a)
The right-hand sides of both Equations 7.198 and 7.199 describe the same h(t).
The physical meaning of this is that if we rearrange the system in such a way
that the second element is now the first one, and if we inject a unit impulse
at the entrance of the new system the output will have the same frequency
function as in the former situation. Equations 7.199 and 7.199a are called con-
volution integrals, and we have just proved that the sequence of the functions
under convolution is immaterial. The simplified notation for convolution of
two functions was introduced on the last member of Equation 7.199b.
h(t) =
t
0
h
1
(τ)h
2
(t −τ)dτδ = h
1
(τ) ∗h
2
(t) (7.199b)
We can then write,
h(t) = h
1
(τ) ∗h
2
(t) = h
2
(τ) ∗h
1
(t). (7.200)
One property which could be anticipated from the equations just described is
that the convolution of one frequency function on another is itself a frequency
function.
Three time characteristics of frequency functions are additive:
1. The shortest transit time through the series must be the sum of the
shortest transit times through every member of the series.
2. The longest transit time through the series must be the sum of the
longest transit times through every member of the series.
3. The mean transit time through the series must be the sum of the mean
transit times through every member of the series.
This last property is not obvious, but it can be proved using some
mathematics.

Systems in Nuclear Medicine 417
Another important property derives from characteristic number 3 that, if in
a series of two elements, we know the flow and the mean transit time through
either member then we can find the volumes of the members.
The flow through the series can be written:
F =
V1
¯
t1
=
V2
¯
t2
=
V
¯
t
(7.201)
where V
1
, V
2
, and V = V
1
+V
2
are the volumes of the elements and the
total volume, and
¯
t
1
,
¯
t
2
and
¯
t =
¯
t
1
+
¯
t
2
are the mean transit times through the
elements and the total mean transit time.
Since
¯
t
1
=
¯
t −
¯
t
2
and F is known, then
V
1
= F(
¯
t −
¯
t
2
)
and similarly
V
2
= F(
¯
t −
¯
t
1
). (7.201a)
Among the distribution systems in series found in the body are the
pulmonary and systemic circulations.
When samples are collected by means of a catheter, a new distribution
system is introduced into the series, the catheter itself.
7.2.6.1 Determination of Flow
We do not need to know the shape of the input function to find the flow and
probably the transit time, if the injection starts and ends during the course of
the experiment. It is
FC
0
(t) = i(t)
∗
h(t). (7.202)
We can write i(t) = qf(t), where q is the total quantity of tracer injected
during the experiment and f (t) is the frequency function of the transit times
of injection, then
F = q
f (t) ∗ h(t)
C0(t)
(7.203)
If f (t)
∗
h(t) is the convolution of two frequency functions, then it is a
frequency function and its integral from zero to infinity is unity.
Integrating the above equation for all times
F
∞
0
C0(t) dt = q
∞
o
f (t) ∗ h(t)dt (7.204)