Lima J.J.Pedroso, de (ed.). Nuclear Medicine Physics
Подождите немного. Документ загружается.

398 Nuclear Medicine Physics
q
(
t
)
Act.
t
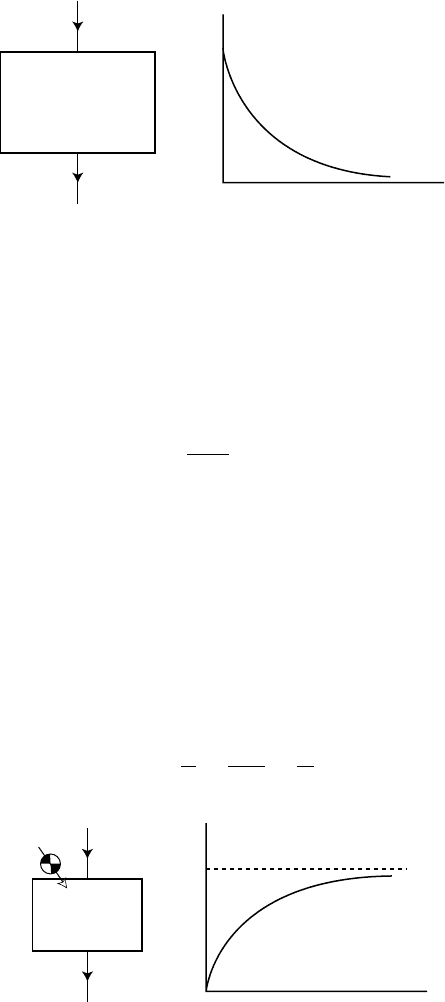
FIGURE 7.28
Activity/time curve after injection of activity q
o
at t = 0 in an open single-compartment system.
Instantaneous mixing is assumed.
that is, the convolution of the input function with the response of the system
to an instantaneous injection of unitary activity.
If i(t) has a constant value, i(t) = k, then the integration of Equation 7.149
gives
c(t) =
k
λ
ef
V
(1 −e
−λ
ef
t
). (7.150)
The plot of this function is given in Figure 7.29.
An example of this situation is the continuous perfusion of
99m
Tc-DTPA for
the determination of renal clearance.
In a compartment where instantaneous, homogeneous mixing occurs and
sampling is allowed, if at t = 0 an instantaneous tracer injection of activity q
o
is
performed and λ
ef
= 0, the volume of distribution can be easily determined
if the sample activity and volume injected are known. If q
o
is the activity
administered in volume v and if, after homogenization, a sample of volume
v
and activity a
is collected, then the concentration in the compartment is
c =
a
v
=
q
o
V+v
≈
q
o
V
C
(
t
)
Act.
C
∞
t
FIGURE 7.29
Activity/time curve during continuous perfusion in a single-compartment open system.

Systems in Nuclear Medicine 399
and
V =
q
o
−cv
c
≈
q
o
c
(7.151)
q
o
and c are known. The approximation holds for the case of V v.
This situation is known as the dilution principle.
It assumes that no significant activity decline occurs, and it seems to be
a theoretical conservation principle for the activity in biological systems. In
practice,even the samplescollected veryshortly after theinjection (essentialto
ensure mixing in the blood) are affected by error due to radioactive decay and
biological elimination. After collecting blood samples at different times and
performing linear curve fitting on the plot of activity concentration versus
time, the activity at zero time can be determined by extrapolation and the
corrected value can be introduced into Equation 7.150. For an exponential
decrease, as in Figure 7.28, extrapolation is easy, because fitting in a semilog
scale is linear.
We can easily relate clearance (Cl), volume (V), and half-time (T
1/2
)ina
single-compartment model:
Elimination rate (g/mL) = λ
ef
Q = λ
ef
Vc = Clc with Cl = λ
ef
V and
T
1/2
= 0.693/λ
ef
= 0.693 V/Cl (7.152)
Typical examples of compartmental volume determination are plasma and
red cells: the first using labeled human serum albumin and the second using
labeled autologous red cells (Figure 7.28).
7.2.4.1.2 Two-Compartment Models
7.2.4.1.2.1 Open Two-Compartment Series System An instantaneous injection
of tracer is performed in compartment 1 (Figure 7.30) at t = 0, and instanta-
neous mixing will give an even concentration q
o
. The rate constants k
1
and
k
2
are for the irreversible exchanges from compartment 1 to 2 and from 2
to the outside, respectively. The equations for the variations of the tracer
concentrations in 1 and 2 are
dq
1
dt
=−k
1
q
1
(7.153)
and
dq
2
dt
= k
1
q
1
−k
2
q
2
. (7.154)
Integration of Equation 7.153 is immediate:
q
1
(t) = q
o
e
−k
1
t
(7.155)
400 Nuclear Medicine Physics
1
I
2
II
q
1
(
t
)
q
1
(
t
)
q
1
(
t
)
q
(
t
)
q
(
t
)
k
1
k
2
q
2
(
t
)
q
2
(
t
)
tt
q
2
(
t
)
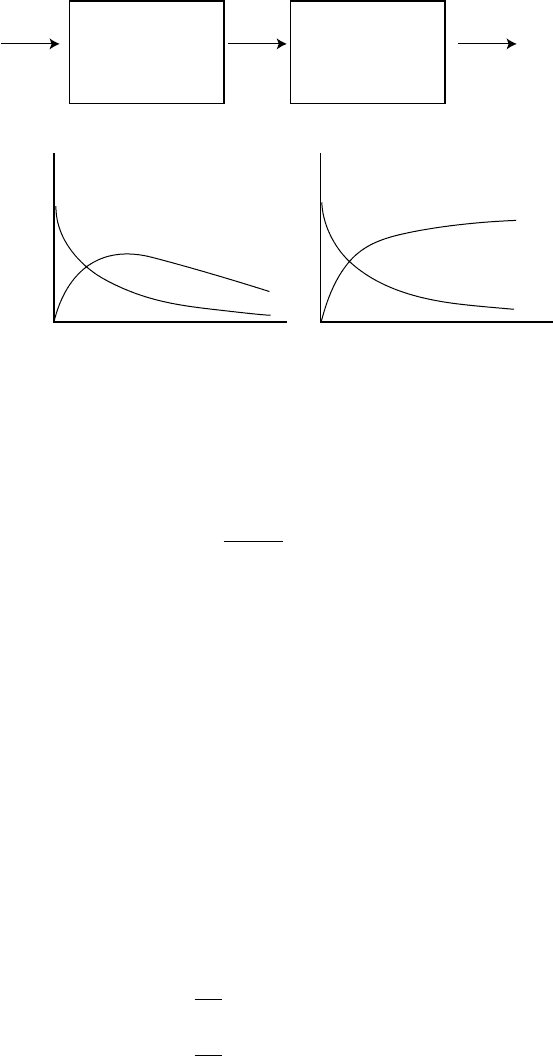
FIGURE 7.30
Activity variations in compartments 1 and 2 after instantaneous injection of radiotracer in the
first. Case I → k
2
= 0; case II→k
2
= 0.
Integration of Equation 7.154 gives
q
2
(t) = q
o
k
1
k
2
−k
1
e
−k
1
t
−e
−k
2
t
(7.156)
Graphs of Equations 7.155 and 7.156 can be seen in Figure 7.30, for the
general case of k
2
= 0 (plot I) and for k
2
= 0 (plot II).
An example of case I is, in a first approximation,
99m
Tc-Deshida is a radio-
pharmaceutical for liver studies.After injection, it is taken up from the plasma
by liver parenchymal cells and eliminated with bile to the intestine. For case
II, and liver studies again, but now with radiocolloids such as
99m
Tc-S, and
assuming no fixation by the spleen and bone marrow.
7.2.4.1.2.2 Closed Two-Compartment System (One-Tissue Compartment Model)
This simple model describes the bidirectional exchange of tracer between
two compartments, assuming no loss of tracer. A radioactive bolus of activity
Q is instantaneously injected into compartment 1 at time t = 0. Activity in
compartments 1 and 2 is q
1
(t) and q
2
(t), respectively.
The Equations that characterize transfer rates in the system (Figure 7.31)
are
dq
1
dt
=−k
1
q
1
+k
2
q
2
(7.157)
dq
2
dt
=−k
1
q
1
+k
2
q
2
(7.158)

Systems in Nuclear Medicine 401
12
q
1
(
t
)
q
1
(
t
)
q
2
(
t
)
q
(
t
)
Q
Q
Q/2
t
k
1
k
2
q
2
(
t
)
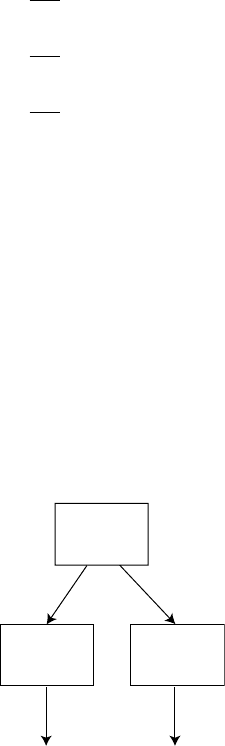
FIGURE 7.31
Closed two-compartment system in equilibrium. The plots relate to k
1
= k
2
, and volumes are
equal in both compartments.
There is no output of tracer from the two-compartment system. Then q
1
+
q
2
= Q and deriving, we get,
dq
1
dt
=−
dq
2
dt
Showing that with q
1
(t) being a decreasing function, then, as expected,
function q
2
(t) must be growing, which means an increasing amount of tracer
in 2. Initial conditions are
q
1
+q
2
= Q and q
2
= 0
and also
dq
1
dt
=−k
1
Q and
dq
2
dt
= k
1
Q.
The solutions for these Equations for the stated conditions are
q
1
(t) = q
o
0
1 −
k
1
k
2
+k
1
1 −e
−(k
1
+k
2
)t
1
(7.159)
and
q
2
(t) = q
o
0
k
1
k
2
+k
1
1 −e
−(k
1
+k
2
)t
1
(7.160)
402 Nuclear Medicine Physics
Activity will exponentially decrease in 1 and exponentially increase in 2
until steady state is attained. In both cases, the rate of variation is determined
by the sum of the two constants k
1
and k
2
.
Where k
1
= k
2
and the volumes of the two compartments are equal,
functions q
1
(t) and q
2
(t) tend toward the value of Q/2, as is seen in Figure 7.31.
7.2.4.1.3 Three-Compartment Models
7.2.4.1.3.1 Three-Compartment Models in Equilibrium The activity variations
in the three compartments of the system in Figure 7.32 are
dq
1
dt
= k
21
q
1
−k
13
q
1
(7.161)
dq
2
dt
= k
12
q
1
−k
24
q
2
(7.162)
dq
3
dt
= k
13
q
1
−k
34
q
3
(7.163)
Time or activity functions for the compartments under study are obtained
by integration,
q
1
= q
o
exp[−(k
12
+k
13
)t]
q
2
={exp[−(k
24
)t]−exp[−(k
12
+k
13
)t)} (7.164)
q
3
={exp[−(k
34
)t]−exp[−(k
12
+k
13
)t)} (7.165)
The measured values of count rates on kidneys are, in fact,
z
1
= q
1
+h
1
q (7.166)
z
2
= q
2
+h
2
q (7.167)
q
1
q
o
q
2
q
3
k
12
k
24
k
34
k
13
FIGURE 7.32
Three-compartment system, with no equilibria and two parallel compartments.
Systems in Nuclear Medicine 403
where h
1
and h
2
indicate the amount of blood measured in the ROIs of each
kidney
q
2
=
q
o
k
12
+k
13
−k
24
+
k
12
exp[−(k
24
)t]+[h
1
(k
12
+k
13
−k
24
) −k
12
]
×exp[−(k
12
+k
13
)t])
,
(7.168)
q
3
=
q
o
k
12
+k
13
−k
34
+
k
13
exp[−(k
34
)t]+[h
2
(k
12
+k
13
−k
34
) −k
13
]
×exp[−(k
12
+k
13
)t]
,
(7.169)
This is a simplified nonexact model to describe
123
I-Hippuran clearance
from plasma by the kidneys. It does not give results that accurately fit the
real situation. It is generally accepted that after intravenous injection of
123
I-Hippuran its plasma concentration is described by a summation of two
exponentials as a result of diffusion to a peripheral compartment. The pos-
sibility of a third, very fast exponential term immediately after injection was
also considered.
7.2.4.1.3.2 Open Mammillary Systems In mammillary models, of which the
system shown in Figure 7.33 is the simplest, compartments are linked to a
central open compartment. Concentrations in compartments 1 and 2 are q
1
(t)
and q
2
(t), respectively, and a radioactive bolus is added to compartment 1.
The constant k
10
is the fractional excretion rate from compartment 1 to a third
compartment.
The rates of change of activity are
dq
1
dt
=−k
10
q
1
−k
12
q
1
+k
21
q
2
(7.170)
dq
2
dt
= k
12
q
1
−k
21
q
2
(7.171)
12
q
1
(
t
)
k
1
k
2
q
2
(
t
)
q
2
q
1
Act.
q
1
+
q
2
t
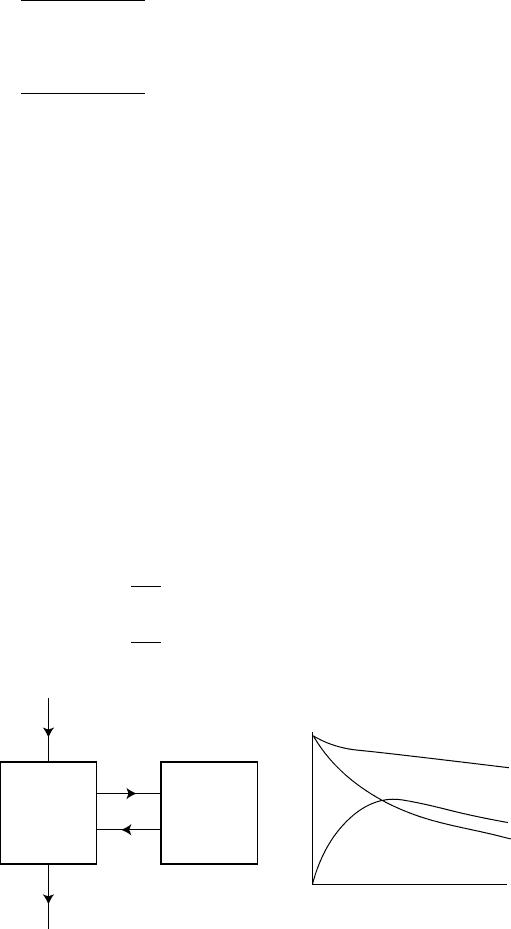
FIGURE 7.33
Open mammillary system with two compartments.
404 Nuclear Medicine Physics
At t = 0:
q
1
= q
0
; q
2
= 0;
dq
1
dt
=−k
10
q
1
−k
12
q
1
and
dq
2
dt
= k
12
q
1
Then by integration we get
q
1
(t) = q
o
k
21
−s
1
s
2
−s
1
e
−s
1
t
+
k
21
−s
2
s
1
−s
2
e
−s
2
t
(7.172)
q
2
(t) = q
o
k
21
s
2
−s
1
(e
−s
1
t
+e
−s
2
t
) (7.173)
with
s
1
s
2
= K
10
K
12
and s
1
+s
2
= K
10
+K
12
+K
21
(7.174)
The metabolism of plasma proteins and the uptake of
99m
T
c
O
−
4
by the
thyroid have been studied using this model.
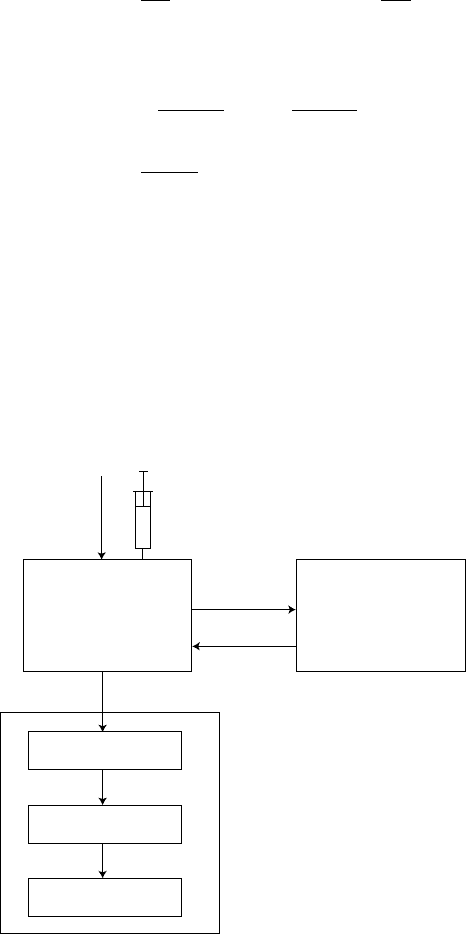
The open mammillary model can be used to evaluate renal clearance; it
consists of an intravascular compartment that reversibly exchanges with
an extravascular compartment and irreversibly exchanges with the urinary
compartment (Figure 7.34).
q
0
k
12
k
13
k
45
k
56
Parenchyma
k
21
Intravascular
compartment
1
4
Renal pelvis
5
Bladder
6
3
Extravascular
compartment
2
FIGURE 7.34
Renal clearance model. An intravascular compartment reversibly exchanges with an extravas-
cular compartment and nonreversibly exchanges with the urinary compartment.
Systems in Nuclear Medicine 405
Intravascular compartment (1) represents the amount of tracer that is
exchangeable with renal parenchyma and extravascular space. Urinary com-
partment (3) represents the tracer that is cleared by the kidneys, and it is
related to the renal pelvis and bladder. Extravascular compartment (2) con-
tains the tracer that has not been cleared, that is, the tracer in the extra-renal
tissue and the tracer that is bound to other molecules.
Equations for compartments (1) and (2) have been already obtained.
Theurinary compartment (3)includes allthe traceractivity inurine, without
distinguishing whether it is in the renal pelvis, ureters, or bladder (3). The
consideration of these three spaces in the mammillary model considerably
complicates the equations.
When the tracer is injected into the intravascular compartment through a
peripheral vein, the initial distribution of the tracer is not uniform in the body;
but this situation is rapidly attenuated over time, (3) as the blood circulates.
In a densely vascularized region, a time or activity curve shows a fast initial
rise that quickly decreases. The peak amplitude of this curve varies with the
anatomic region, injection site, and injection speed.
Strictly compartmental analysis cannot be applied to the initial phase of a
renogram, because the basic assumption of uniform distribution of the tracer,
implicit in compartmental analysis, is not confirmed.
After this phase, the amount of tracer in the intravascular compartment
begins to fall (Figure 7.33) as a consequence of uptake by the kidneys (repre-
sented by k
13
) and diffusion to the extravascular space (represented by k
12
).
With increasing amounts of tracer in the extravascular compartment and
the continued elimination of tracer from the blood, after a time the direction
of exchange is reversed (represented by k
21
), with a maximum being attained
in extravascular concentration before it begins to fall (Figure 7.33).
Constant k
56
is related to the urine production rate.
In a real situation, the crossing of the tracer through the renal parenchyma
is characterized by a transit time, t
0
, whose introduction complicates the
system’s equations.
The solutions of the differential equations for the amounts of tracer in the
renal parenchyma, in the renal pelvis, and in the bladder need to take into
account a time delay t
0
such that t < t
0
q
4
= 1 −A
3
exp(−s
1
t) −A
4
exp(−s
2
t)] (7.175)
q
5
= 0 (7.176)
and
q
6
= 0 (7.177)
and when t > t
0
:
q
4
= A
3
[1 −exp(−s
1
t
o
)]exp[−s
1
(t −t
o
)]−A
4
[1 exp(−s
2
t
o
)]exp[−s
2
(t−t
o
)]
(7.178)
q
5
= A
7
exp[−s
1
(t−t
o
)]+A
8
exp[−s
2
(t−t
o
)]−A
9
exp[−s
3
(t−t
o
)] (7.179)
406 Nuclear Medicine Physics
and
q
6
= 1 −A
10
exp[−s
1
(t −t
o
)]−A
11
exp[−s
2
(t −t
o
)]+A
12
exp[−s
3
(t −t
o
)]
(7.180)
where s
3
is related to k
56
.
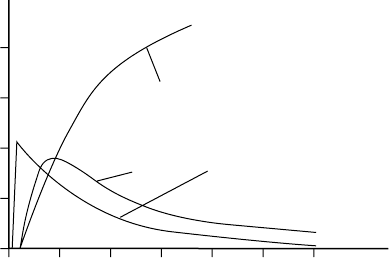
The curves showing the amount of tracer versus time in the compartments
considered above are shown in Figure 7.35.
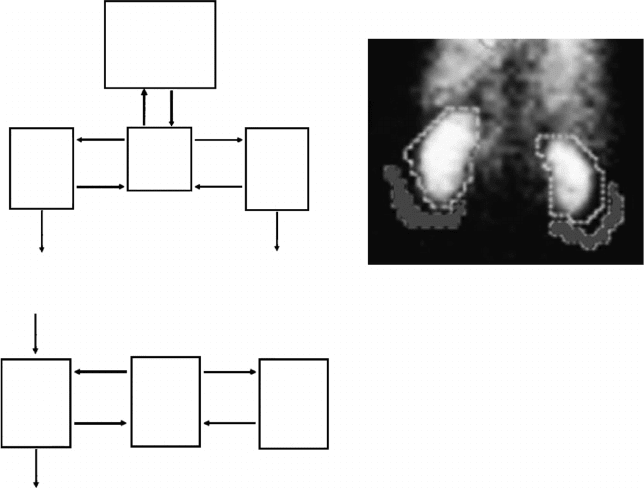
7.2.4.1.3.3 Mammillary System with Multiple Equilibria The model in Fig-
ure 7.36a was proposed to explain
99m
Tc-MAG3 kinetics in human kid-
neys, targeting the acquisition and processing capacities of modern gamma
cameras.
The four compartments of the model are plasma with fast distribution;
extrarenal extravascular space; and the left and right kidneys, which can
reversibly exchange with plasma. The only irreversible movement of the
tracer is from kidneys to bladder.
This model combines the advantages of plasma clearance methods with the
processing potential of the new gamma cameras, making the quantification of
differential renal function of the two kidneys possible. Figure 7.36b represents
a gamma camera image, with the areas marked for kidneys and background.
Figure 7.36c shows a model with tracer exchange to the interstitial fluid that
can also reversibly exchange with a third compartment. This compartment
can represent bone tissue in a study with
18
F.
These models can be clinically useful but need a mathematical analysis that
is complex and extensive, which is of little interest in the present context.
Parenchyma
Time (min)
Activity
Pelvis
0 5 10 15 20 25 30
Bladder
FIGURE 7.35
Parenchymal curves (q4) of the renal pelvis (q5) and bladder (q6), obtained for t
0
= 2 min and
k
56
= 1 min
−1
.
Systems in Nuclear Medicine 407
1
1
2
2
Extravasc.
tissues
Left
kidney
Right
kidney
Plasma
Plasma
Bladder Bladder
3
3
K
21
K
12
K
12
K
13
K
23
K
32
K
21
K
14
K
31
K
30
K
41
K
40
4
FIGURE 7.36
(a) Four-compartment model for kinetic studies after
99m
Tc-MAG3 injection. (b) Gamma camera
image showing areas marked for kidneys and background. (c) Model with exchange of tracer to
interstitial fluid, with a reversible exchange with a third space.
7.2.5 Tracers, Volumes, and Flows in Dilution Systems
The variables generally used in kinetic studies in biological systems are the
volume V, (probably the tracer distribution volume), time t (frequently the
mean transit time of a tracer in a system), the mass of tracer M in mg or
the activity in MBq, the tracer concentration, C in mg/mL or mBq/mL, and
the flow of tracer in mg/min. These variables are related to each other by
the definitions themselves or through simple equations resulting from known
principles such as mass conservation.
Asystem in which a tracer is distributed and is intended to give information
about volumes, flows, transit times, and the general dynamics of the liquid
in the system is called a dilution or distribution system.
The biological processes involving the behavior of a particular tracer in a
particular space depend on the mean time the tracer takes to go through it
(mean transit time) or the mean time the tracer stays in that space (mean
residence time). It is useful to analyze these quantities.
Let us suppose we have a tube with a liquid passing along it and two very
well-collimated radiation detectors D
1
and D
2
seeing small volumes dV
1
and
dV
2
at the input and output of the tube (Figure 7.37a).