Lima J.J.Pedroso, de (ed.). Nuclear Medicine Physics
Подождите немного. Документ загружается.

168 Nuclear Medicine Physics
The energy of an incident photon in the scintillator is partially converted
into visible or near UV light (scintillation) and then transformed into an
amplified electrical signal by a PMT. The intrinsic energy resolution expresses
the ability of the detector (without collimator) to differentiate between two
photons of different energies. Of particular importance is the differentiation
between photopeak and scattered photons. The value is given by the energy
range that corresponds to the photopeak width at half height expressed as a
percentage of the energy of the photopeak.
Impulses of the total absorption peak correspond to the total energy absorp-
tion of the incident photon and can result from (a) interaction in the crystal by
photoelectric effect, with both the photoelectron energy and the X-radiation
energy due to electron transition or Auger electrons being dissipated in the
crystal and (b) interaction by Compton effect followed by absorption of the
Compton electron and the scattered photon by the crystal.
The PMT collects the light generated in the crystal by γ rays, by ionization
and excitation, giving rise to electrical signals that contain information about
the energy and position of the interactions taking place in the crystal. The
interactions that occur in the crystal are processed individually, which require
the use of fast electronics and low dead time in the detector to allow high
counting rates [36].
The proportionality between the energy transferred and the electrical
impulse produced allows the scintillation detector to be used for gamma
radiation spectrometry.
The gamma spectrum, that is, the distribution of the number of pulses for
each amplitude value, from zero to a maximum value (for each energy value
dissipated in the crystal), can be obtained with a pulse height analyzer.
These signals are sent to charge amplifiers wherethey areamplified to be the
input of position circuits, which then computes the individual coordinates, x
and y, of the detections. These steps should be performed by digital circuits.
The performance of the scintillation camera is compromised by an intrinsic
spatial resolution close to 3 mm, aggravated by the response of the collimator
and by deterioration with the distance to the detector. These factors lead to
poor spatial resolution compared with the morphological techniques. Reso-
lution distances expected for the scintillation camera are of the order of 5 mm
for most exams of deep organs.
Poor spatial resolution leads to the partial volume effect that prevents the
collection of quantitative information about the intensity of objects whose
size is less than twice the system resolution distance.
Planar scintigraphy produces 2D images of 3D objects. The planar images
are impaired by the overlap of active and nonactive regions that limit the
contrast and the functional accuracy of the information.
Radial acquisition around the object followed by reconstruction allows the
acquisition of tomographic maps in NM [37].
Currently, most studies show only stationary distribution of activity, and
the analysis of the resulting images is mainly qualitative.

Radiation Detectors and Image Formation 169
The problem of quantification in SPECT is complex, because it is necessary
to determine the distribution and concentration of an unknown tracer in an
unknown set of absorbent tissues.
Quantification through the use of dynamic and quantitative functional
imaging can, however, improve the quality of diagnosis with SPECT; but
this objective is only approximately achieved in some studies.
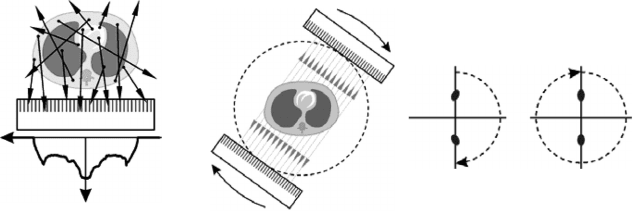
Although conceptually the gamma camera has not undergone major
changes over time, the same does not hold for the design, the detectors, and
the materials used to make it. One of the most easily recognized changes is the
number of heads that the current gamma cameras have. The gamma camera
quickly evolved to increase the number of heads from one to two and then
to three. This development meant an improvement in sensitivity, which, in
turn, led to a reduction of the dose of radioactivity administered and/or the
time taken for the examination (Figure 5.19).
Moreover, in recent years, new devices have emerged:
1. Cameras with multiple small crystals. PMTsare used in a new design.
2. Cameras with photodiodes. Silicon diodes are used instead of
PMTs. CsI scintillators are used, as their emission spectrum fits the
photodiodes better.
3. Compton effect cameras.
4. Cameras with CZT detectors; this is a semiconductor detector capable
of operating at room temperature.
5.3.1.1 Collimators
The collimator is a device that is placed between the crystal and the object
of study and consists of a gamma radiation absorbing material with thou-
sands of holes distributed in a network [38]. This makes it possible to select
certain directions of the incident photons and to filter scattered rays that are
not suitable for the formation of the image. Despite making the technique less
FIGURE 5.19
Gamma cameras.
170 Nuclear Medicine Physics
efficient by reducing the counting rate, collimators are essential for the forma-
tion of the image, as the gamma photons cannot be refracted; and, therefore,
lenses cannot be used, as they can with photons in the visible range.
The walls that confine the holes are called the collimator septa. The thickness
of the collimator, the diameter of holes, and the septa thickness relate directly
to the properties of the image. The dimensions of the collimator are the same
as the crystal and it can be square or circular in shape. The material gener-
ally used for collimators is lead, because it combines a high density with a
high atomic number. Ahigh-density material is required, because it is directly
related to the attenuation coefficient, which must be high to ensure gamma
photon absorption. Further, the atomic number should be high to ensure that
the fraction of interactions by photoelectric effect is greater than the fraction
of interactions by Compton and Rayleigh–Thomson scattering. We recall here
that in the NM energy range (80–511 keV), the fraction of the photoelectric
effect increases with atomic number. This condition is essential to image qual-
ity since the secondary photons, produced by the Compton effect or by elastic
scattering, will degrade the image.
Other materials such as tungsten, gold, or tantalum exhibit the required
characteristics for their use in collimators; however, the high unit and/or
manufacturing cost of the collimator make the use of these materials
impracticable.
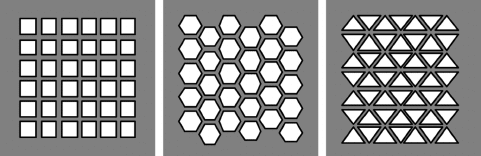
Collimators differ mainly in their geometry. The usual distinctions are
between parallel-hole, convergent, divergent, and pinhole collimators. The
holes in the collimators may also differ in shape with the three basic ones
being square, triangular, or hexagonal (Figure 5.20).
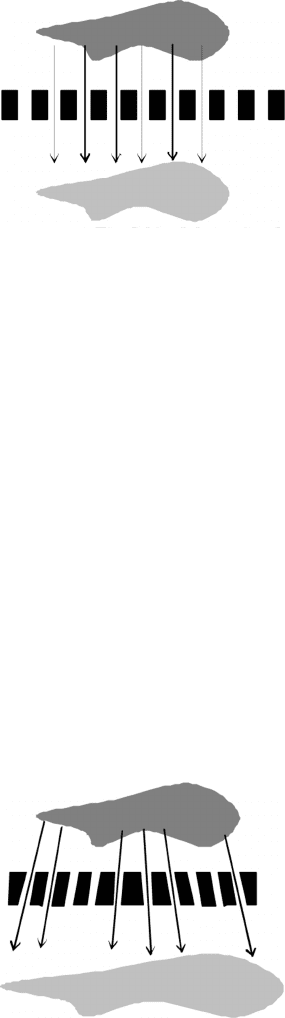
Theparallel-hole collimator isthe most widelyused, in whichis the arrange-
ment of holes is perpendicular to the surface of the crystal. In this case, the
image has the same size as the object, regardless of distance from the collima-
tor to the subject. This characteristic is intrinsic to the orthogonal projection
that is provided (Figure 5.21).
When the organ under study is smaller than the crystal of the gamma cam-
era, a converging collimator can be used, which can use all the surface of
the crystal to build the image. In this case, the geometry is not orthogonal,
FIGURE 5.20
Various types of hole arrays in collimators.
Radiation Detectors and Image Formation 171
FIGURE 5.21
Schematic of a parallel-hole collimator. The size of the object is preserved.
causing a magnification that depends on the distance of the collimator to the
object (Figure 5.22).
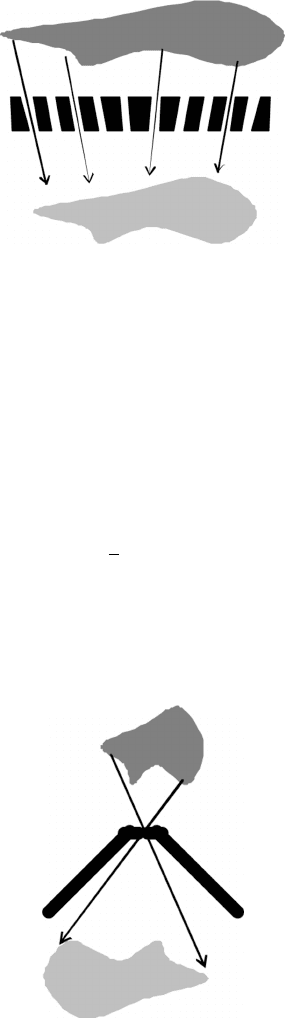
The diverging collimator is the inverted version of the converging collima-
tor and is used when attempting to increase the camera field of view. The
image obtained is smaller than the real object (Figure 5.23).
The pinhole collimator is based on the camera obscura in which light rays
pass through a small opening and are projected to form an inverted image.
Since the rays have to pass through a small hole, only a small percentage of
the emitted photons can reach the crystal; and, consequently, one of the major
disadvantages of the pinhole is its reduced sensitivity. Another drawback is
the distortion that occurs as a result of the finite size of the hole. However, the
possibility of magnifying and improving spatial resolution makes the pinhole
the preferred choice for studies of small organs (Figure 5.24).
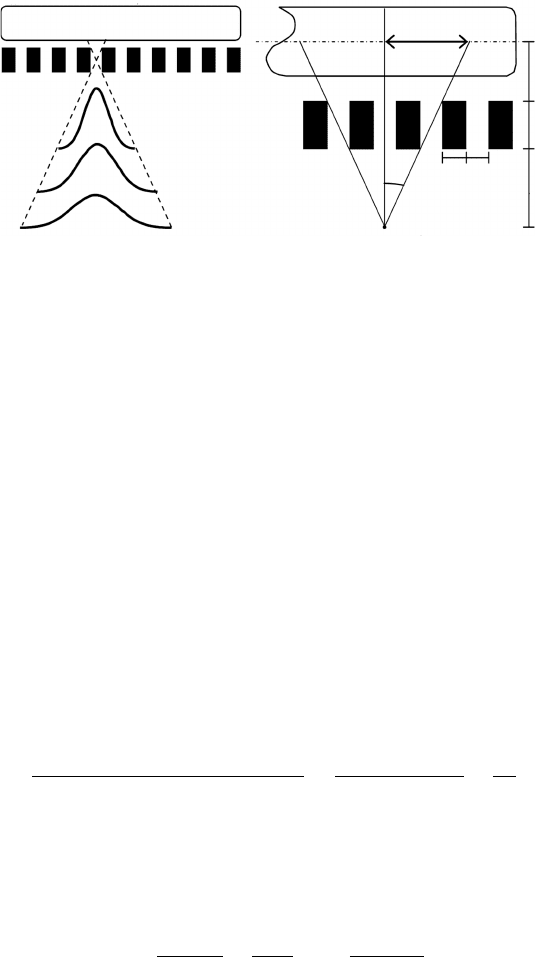
The use of collimators has direct implications for both the resolution and
sensitivity of the system. These factors can be analyzed based on geometric
arguments. Resolution is defined as the ability to discriminate two points close
together and is given by the FWHM of the response PSF (Figure 5.25).
FIGURE 5.22
Schematic of a converging collimator.
172 Nuclear Medicine Physics
FIGURE 5.23
Schematic of a diverging collimator.
Consider a point source at a distance, f , from a gamma camera with a
parallel-hole collimator with septa thickness s and hole diameter h. Let
represent the height of the septa and c the distance of the collimator to the
scintillator crystal. The angle α is defined as the angle between a ray perpen-
dicular to the crystal and the oblique ray of maximum inclination that still
reaches the crystal. Taking into account the geometrical aspects considered
and using the properties of similar triangles, it is deduced that
d =
h
(c + + f ). (5.37)
The expression shows that the characteristics of the collimator influence
the spatial resolution. Given that, generally, the distance from the source to
the collimator f is greater than the height of the septa, , and the distance
FIGURE 5.24
Schematic of a pinhole collimator.
Radiation Detectors and Image Formation 173
Crystal
d
c
l
f
hs
α
FIGURE 5.25
Variation of spatial resolution with depth. Geometric relations associated with the resolution of a
collimator.
from the collimator to the crystal c the factors that determine resolution are
the distance from the source to the collimator and the relation between the
septa thickness and the hole diameter (d ≈ hf /). Thus, the smaller the holes
(h) relative to the height of the septa (), the lower the resolution distance d.
That is, the greater will be the power to discriminate two point sources that
are very close. Another conclusion to be drawn from Equation 5.36, which
is also shown in Figure 5.25, is that the spatial resolution varies with the
distance from the source to the collimator. The further the collimator is from
the sources, the worse the resolution will be.
Another aspect that must be taken into account is the geometric efficiency
of the collimator, which is defined as the fraction of the number of photons
isotropically emitted and the number of photons effectively collimated [39].
Assuming an infinite plane of activity in the air,the detector response is invari-
ant with regard to the distance to the plane; so the geometric efficiency, Ω
ef
,is
generally defined, assuming that the plane is adjacent to the collimator. Given
the definition of geometric efficiency, we have
Ω
ef
=
Number of collimated photons
Number of emitted photons
=
Total hole area
Total area
×
Ω
4π
, (5.38)
where Ω is the solid angle in which a hole is seen from the center of the section
in a plane in contact with the collimator. Thus, the geometric efficiency, Ω
ef
is best described by
Ω
ef
=
¯
k
h
2
(d +s)
2
×
h
2
4π
e
= k
h
2
e
(h +s)
2
, (5.39)
where k is a factor that reflects the properties associated with the type of
hole (hexagonal, triangular, or quadrangular), h is the size of the hole, s is the
septum thickness, and
e
is the effective thickness of the collimator.
174 Nuclear Medicine Physics
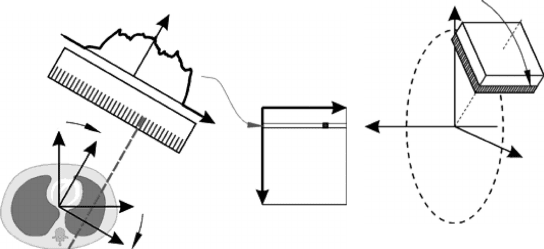
5.3.1.2 Data Acquisition
In gamma scintigraphy, a simple 2D projection is formed perpendicular to
a given direction, keeping both the gamma camera and the patient at rest
during data acquisition (Figure 5.26a). The result is an image similar to a
radiographic projection.
In SPECT, one or more gamma cameras are rotated around the patient to
acquire a large number of projections along different directions (Figure 5.26b).
These projections are combined using standard tomographic reconstruction
algorithms to build a 3D volume representing the radiotracer’s activity. This
volume may then be digitally manipulated to produce 2D images of the
activity distribution along any chosen direction. Current SPECT scanner tech-
nology uses two or three gamma cameras, known as detector heads, which
rotate around the patient in circular or elliptical trajectories, known as orbits
[40]. Decay events are accumulated at fixed points of the orbit, usually 3
◦
or 6
◦
apart.As a rule, the heads complete a full 360
◦
rotation to minimize geometric
distortions in the reconstructed images; such distortions may arise from the
dependence of the spatial resolution of each head on the distance from the
radioactive source to the head’s collimator (Figure 5.26c).
5.3.1.3 Data Storage
5.3.1.3.1 Data Formats: List-Mode and Histograms
The mapping of each gamma photon detected in the active volume of the
scanner allows the raw data in these nuclear techniques to be compiled in
a sequential list of detection events, where each entry stores a certain set of
Number of
photon counts
(a) (b) (c)
FIGURE 5.26
(a) Production of a 2D projection in gamma scintigraphy along a given direction. The gamma
camera and the patient remain still during data acquisition. (b) Production of multiple 2D pro-
jections in a SPECT scan with a dual-head scanner. The projections are taken at fixed positions
along the orbit of the heads as these rotate around the patient. (c) Typical geometric distor-
tions generated in the reconstructed images of two point-like sources placed symmetrically
relative to the detector axis, for a 180
◦
orbit (left) and a 360
◦
orbit (right) in a single-head SPECT
scanner.
Radiation Detectors and Image Formation 175
relevant information about the event. This information includes the position
at which the photon interacted with the scintillation detector or the energy
deposited by the photon. This data format, known as list mode [41], is, how-
ever, generally inappropriate for image reconstruction; and the histogram
data format is usually preferred.The histogram, a 2D array of integers, groups
the recorded events according to the location where the photon was detected
[42]. The active volume of the scanner is therefore, discretized into channels
or bins, and the total number of photons detected in each bin is counted dur-
ing the exam. For gamma scintigraphy scans, the correspondence between
array entries and scanner bins is chosen so that a unique histogram coincides
with the 2D projection of the activity distribution along the direction of the
collimator channels [40].
In SPECT imaging, the detection events are stored in several histograms,
known as sinograms. Contrary to what one would assume, sinograms are not
the 2D projections of the activity distribution along the acquisition positions
of the orbit. Instead, they are assembled in a way that turns out to be more
suitable for the image reconstruction algorithms [43].
Most SPECT scanners record the raw event data in list-mode format, con-
verting it later to histogram format. This conversion is easily performed once
the discretization of the scanner’s active volume is known relative to the
location of the heads. Although the histogram is better suited to image recon-
struction, list-mode data have a larger information content which is often
important for the correction of physical effects that decrease image quality,
suchas scatteredradiation [44]. Further,itis themost flexibleformat, as,unlike
histogram data, list-mode data do not depend on the particular discretization
resulting from dividing up the scanner’s active area into channels.
5.3.1.3.2 SPECT Sinograms
The histogram data structure used in SPECT is the sinogram, which consists
of a 2D array with the photon counts along all possible directions in a plane
perpendicular to the rotation axis of the scanner [43]. The two indexes of
each sinogram entry identify the spatial orientation of the detected photons
stored in that entry, according to the radial coordinate x
r
and the azimuthal
angle, φ, shown in Figure 5.27. These two coordinates are defined using a
reference frame OX
r
Y
r
linked to one of the scanner’s heads, obtained from
the negative rotation of the stationary frame OXY fixed to the scanner by
an angle φ ∈[0; 2π]. In the stationary reference frame OXY, the origin O is
located in the scanner’s axis, and OX and OY are, respectively, the horizontal
and vertical directions (Figure 5.27a and b). An additional axis OZ allows
an axial coordinate, z, to be defined for each sinogram, locating it along the
scanner’s axis (Figure 5.27b). The set of sinograms acquired for a given object
in all the planes is compiled in a 3D array s(x
r
, φ, z). It should be noted that
the number of elements in each dimension of the sinogram depends on the
discretization of the scanner’s heads (dimension corresponding to x
r
) as well
as on the number of acquisition angles used (dimension corresponding to φ).
176 Nuclear Medicine Physics
ϕ
ϕ
ϕ
x
r
x
z
y
x
r
x
r
y
r
x
y
Sinogram
Number of photon
counts
(a) (b)
FIGURE 5.27
(a) Definition of the x
r
and φ coordinates for a photon emission direction (dashed line) in the
OX
r
Y
r
reference frame linked to one of the heads, and corresponding location in the sinogram.
(b) Orientation of the stationary reference frame XYZ. The XY, YZ, and XZ planes are usually
referred to as the transaxial, sagittal, and coronal planes.
If the scanner has more than one head, the number of counts along a direction
labeled by a set of x
r
, φ, and z values is the sum of all counts detected in each
head for that direction.
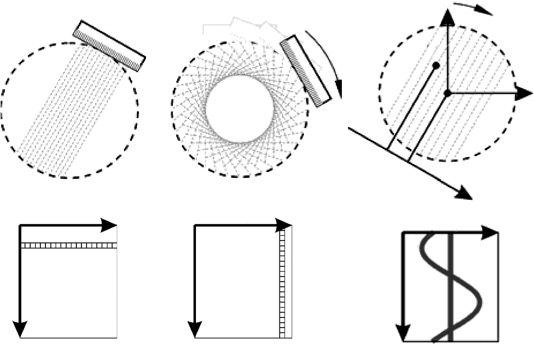
According to its definition, each row of the sinogram groups photon emis-
sion directions that are all parallel and defines an angle φ with the horizontal;
whereas each column groups different directions, but all with the same radial
coordinate x
r
, that is, which are tangent to a circle of radius x
r
centered in
O (Figure 5.28). Mathematically, a sinogram is the 2D radon transform of an
object [45] and is so called, because a point-like source of photons always
gives rise to a sinusoidal pattern in its sinogram [43] (Figure 5.28).
The way photon counts are organized in a sinogram is particularly appro-
priate for image reconstruction algorithms, as each entry stores the number of
photons emitted in a well-defined direction, which, in the absence of effects
such as Compton scattering or self-absorption, is proportional to the total
activity of the radiotracer along that direction. Each row of the sinogram is,
thus, the set of parallel projections of the activity (or, more simply, the projec-
tion of the activity) of the imaged object along the direction φ in the plane z,
p(x
r
, φ, z) [43]:
p(x
r
, φ, z) = s(x
r
, φ, z). (5.40)
The set of activity projections along all possible orientations in a given z
plane is the information used to reconstruct the image in that plane. The
final result of typical image reconstruction algorithms is an image volume
consisting of all reconstructed planes stacked together.
Radiation Detectors and Image Formation 177
ϕ
ϕ
ϕ
ϕ
x
r
x
r
x
r
x
A
x
B
y
x
B
A
A
B
x
r
Sinogram Sinogram Sinogram
FIGURE 5.28
(a) Representation of all photon emission directions involved in the definition of a sinogram row
(left) and column (right). (b) Sinogram originated froma point-like source located in the scanner’s
axis (A) and away from that axis (B). As a function of φ, the sinogram describes a complete sine
wave for a rotation of 360
◦
, with an amplitude equal to the source-axis distance.
5.3.1.4 Preprocessing of Data
The reconstruction of a SPECT image assumes that the number of photon
counts in each emission direction is proportional to the integrated activity
of the object over that direction. There are, however, several factors that dis-
turb the counting and change that proportionality. These are mainly physical
effects, such as the occurrence of Compton scattering in the patient, which
leads to disperse radiation or photon flux attenuation due to interaction
between the emitted photons and the patient’s body. Thereare differentstrate-
gies for the correction of those effects, most of which pre-process the acquired
data before image reconstruction. This preprocessing, known as data correc-
tion, is a key factor in ensuring that the reconstructed image is a reliable
estimate of the activity distribution of the object being studied. The main
effects corrected and methods used are addressed in Chapter 6.
5.3.1.5 Image Reconstruction
The SPECT imaging is a tomographic technique that generates slices of the
object, showing the radiotracer distribution in the patient’s volume. Recon-
structing the image from the number of photon counts along different spatial
directions starts presuming that, in the absence of attenuation and Compton
scattering, the number of photons detected in a given direction is, as pre-
viously mentioned, proportional to the integral of the activity distribution