Kounadis A.N., Gdoutos E.E. (Eds.) Recent Advances in Mechanics
Подождите немного. Документ загружается.

Experimental Mechanics in Nano-engineering 279
where: E(x, τ) is the scalar representation of the propagating electromagnetic
field, x is the direction of propagation of the field, τ is the time, A(k) is the
amplitude of the field, k is the wave number 2π/λ, ω(k ) is the angular frequency.
A(k) provides the linear superposition of the different waves that propagate and
can be expressed as:
A(k) π2= δ(k-k
o
) (6)
where δ(k-k
o
) is the Dirac’s delta function. This amplitude corresponds to a
monochromatic wave, that is: E(x,τ)=
τω )k(i
_
ikx
e . If one considers a spatial pulse
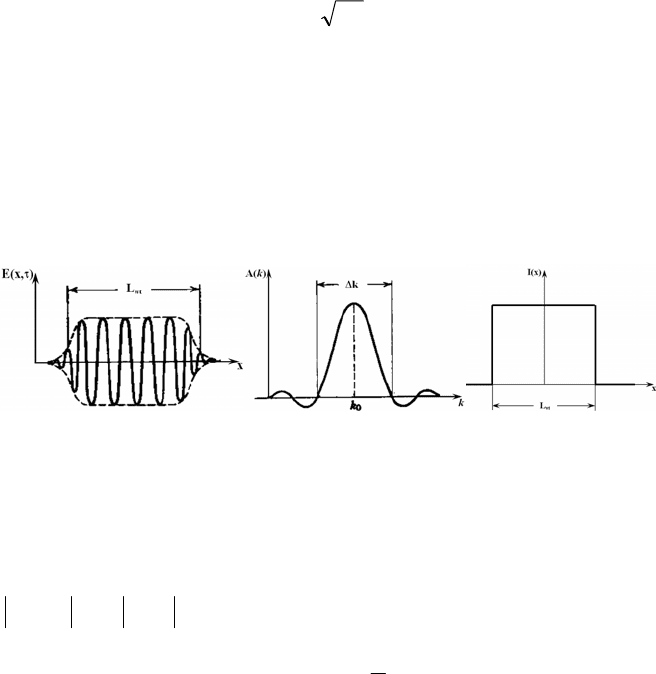
of finite length (see Fig. 2a), at the time τ=0, Ε(x,0) represents (see Fig. 2c) a
finite wave-train of length L
wt
where A(k) is not a delta function but a function
that spreads a certain length Δk (Fig. 2b). The dimension of L
wt
depends on the
analyzed object size. In the present case, objects are smaller than the wavelength
of the light.
a) b) c)
Fig. 2. a) Harmonic wave train of finite extent L
wt
; b) Corresponding Fourier spectrum in
wave numbers k; c) Representation of a spatial pulse of light whose amplitude is described
by the rect(x) function.
In Ref. [9], it is stated that if L
wt
and Δk are defined as the RMS deviations
from the average values of L
wt
and Δk evaluated in terms of the intensities
2
)0,x(E and
2
)k(A , then it follows:
2
1
kL
wt
≥Δ (7)
Since L
wt
is very small, the spread of wave numbers of monochromatic waves
must be large. Hence there is a quite different scenario with respect to the classical
context in which the length L
wt
is large when compared to the wavelength of light.
In order to simplify the notation, one can reason in one dimension without loss
of generality. The spatial pulse of light represented in Fig. 2c is defined as
follows:
)x(rectA)x(A
o
= (8)

280 C.A. Sciammarella, F.M. Sciammarella, and L. Lamberti
where:
⎪
⎪
⎪
⎩
⎪
⎪
⎪
⎨
⎧
=
<
=
elsewhere0
2
1
|x|
2
1
2
1
|x|1
)x(rect
(9)
The Fourier transform of A(x) is equal to sinc(x). The Fourier transform of
the light intensity [A(x)]
2
is hence [sinc(x)]
2
. To the order 0 it is necessary to add
the shifted orders ±1. The function A(x±Δx) can be represented through the
convolution relationship:
'dx)xx()'x(A)xx(A ⋅Δ±δ⋅=Δ±
∫
+∞
∞−
(10)
where x’=x±Δx. The Fourier transform of the function A(x ±Δx) will be:
x)]2/x(f2[i
x
e)f(A)]xx(A[FT
x
'S
'r
#
(11)
where f
x
is the spatial frequency. The real part of Eq. (11) is:
^`^ `
x)]2/x(f2[osc)f(A]xx(A[FTRe
xx
'S 'r #
(12)
By taking the Fourier transform of Eq. (12), one can return back to Eq. (10).
For the sake of simplicity, the above derivations have been done in one
dimension but can be extended to 3-D. Brillouin
[10] has shown that for a cubic
crystal the electromagnetic field can be represented as the summation of plane
wave fronts with constant amplitude as it has been assumed in Eq. (5). In such
circumstances the above derivation can be extended to 3-D and can be applied to
the components of the field in the different coordinates.
2 Applications to Nanometrology
The initial approach to the utilization of evanescent field properties was the
creation of near-field techniques. In the near-field techniques, a probe with
dimensions in the nano-range detects the local evanescent field generated in the
vicinity of the objects that are observed. The following alternative approach to the
classical near-field techniques has been utilized in this paper:
a) Using diffraction through the equivalent of a diffraction grating or to
generate directly an ample spectrum of k vectors by means of a diffraction grating;
b) Creating a Fabry-Perot type cavity;
c) Exciting the objects to be observed with the evanescent fields so that the
objects become self-luminous.
Experimental Mechanics in Nano-engineering 281
The light generated in this way has the particular property of propagating through
space and optical instruments without the common diffraction effects experienced
by ordinary wave fronts [1-3].
The self generation of light by small single crystals of sodium chloride has been
utilized to produce the equivalent of Fourier type holograms [11].
2.1 Observation of Nano-crystals and Nano-spheres
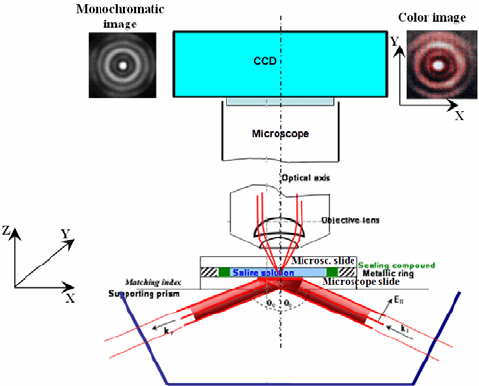
Figure 3 shows the schematic representation of the experimental setup. Following
the classical arrangement of TIR, a helium-neon (He-Ne) laser beam with nominal
wavelength 632.8 nm impinges normally to the face of a prism designed to
produce limit angle illumination on the interface between a microscope slide
(supported by the prism itself) and a saline solution of sodium-chloride contained
in a small cell supported by the slide. Consequently, evanescent light is generated
inside the saline solution.
The objects observed with the optical microscope are supported by the upper
face of the microscope slide. Inside the cell filled with the NaCl solution there is a
polystyrene microsphere of 6 μm diameter. The microsphere is fixed to the face of
the slide through chemical treatment of the contact surface in order to avoid
Brownian motions. The polystyrene sphere acts as a relay lens which collects the
light wave fronts generated by the nano-sized crystals of NaCl resting on the
microscope slide. More details on the polystyrene sphere and the saline solution
properties are given in Table 1.
Fig. 3. Experimental setup to image nano-size objects using evanescent illumination. Two
CCD cameras are attached to a microscope in order to record images: monochromatic,
color.

282 C.A. Sciammarella, F.M. Sciammarella, and L. Lamberti
The observed image is focused by an optical microscope with NA=0.95 and
registered by a monochromatic CCD attached to the microscope. At a second port, a
color camera records color images. The CCD is a square pixel camera with
1600x1152 pixels. The analysis of the image recorded in the experiment has been
performed with the Holo Moiré Strain Analyzer software (HoloStrain™), Ref. [12].
Table 1. Details on polystyrene microsphere and saline solution
Parameter Value Note
Polystyrene microsphere
diameter D
sph
6 ± 0.042 μm
Tolerance specified by the
manufacturer
Polystyrene microsphere
refraction index n
p
1.57 ± 0.01
Value specified by the
manufacturer
Saline solution
refraction index n
s
1.36 Computed from NaCl
concentration for the nominal
wavelength of λ=590 nm
2.2 Generation of Multi-k Vector Fields
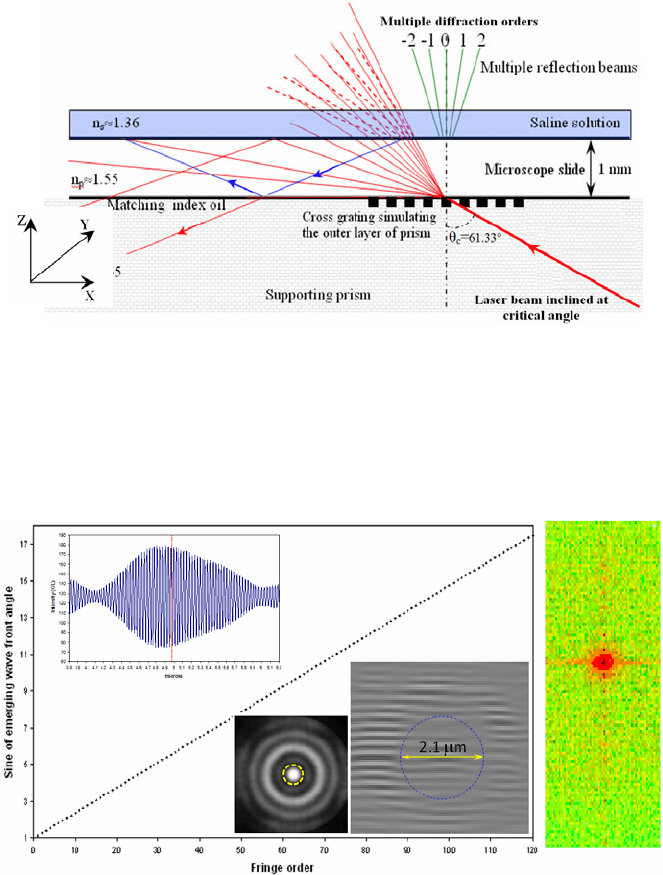
Figure 4 shows the process of generation of the evanescent beams that provide the
energy required for the formation of the images. The optical setup providing the
illumination is similar to the setup originally developed by Toraldo di Francia to
prove the existence of evanescent waves and described in Ref. [6]. A grating is
illuminated by a light beam at the limit angle of incidence θ
c
. A matching index
layer is interposed between the illuminated surface and a prism which is used for
observing the propagating beams originated on the prism face by the evanescent
waves. In the original experiment conducted by Toraldo di Francia, the diffraction
orders of the grating produced multiple beams that by interference generated the
fringes observed with a telescope. In the present case, the interposed layer
corresponds to the microscope slide. Although the microscope slide does not have
exactly the same index of refraction of the prism, it is close enough to fulfill its
role.
The diffraction effect is produced by the residual stresses developed in the
outer layers of the prism. The multiple illumination beams are the result of
residual stresses in the outer layers of the prism. In Ref. [13], there is a detailed
analysis of the formation of interference fringes originated by evanescent
illumination in presence of residual stresses on glass surfaces. The glass in the
neighborhood of the surface can be treated as a layered medium and the fringe
orders depend on the gradients of the index of refraction. In Ref. [14], there is a
more extensive analysis of the role played by birefringence in the present
example.
Figure 4 provides a schematic representation of the process of illumination of
the observed nano-objects. The laser beam, after entering the prism, impinges on
the prism-microscope slide interface, symbolically represented by a grating, where
it experiences diffraction. The different diffraction orders enter the microscope
slide and continue approximately along the same trajectories determined by the
Experimental Mechanics in Nano-engineering 283
diffraction process. The slight change in trajectory is due to the fact that the
indices of refraction of the prism and the microscope slide are slightly different.
As the different orders reach the interface between the microscope slide and the
saline solution, total reflection takes place and evanescent wave fronts emerge into
the solution in a limited depth that is a function of the wavelength of the light as
shown in Eq. (2).
Fig. 4. Model of the interface between the supporting prism and the microscope slide as a
diffraction grating causing the impinging laser beam to split into different diffraction orders.
Since the wave fronts have been originated by artificial birefringence, for each
order of diffraction there are two wave fronts: the p-polarized and the s-polarized
wave fronts. Upon entering the saline solution these wave fronts originate
propagating wave fronts that produce interference fringes.
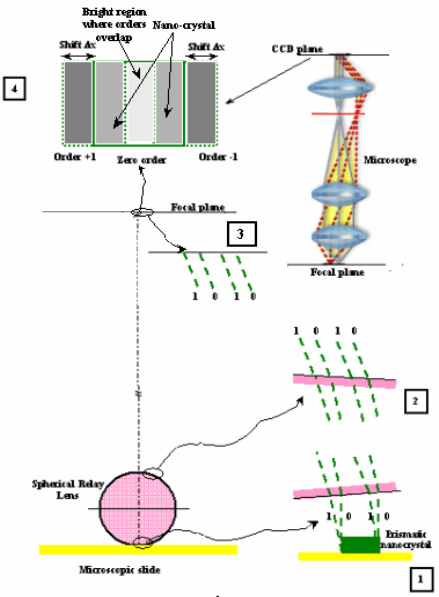
Fig. 5. System of fringes observed in the image of the 6 μm diameter polystyrene sphere.
Dotted circle represents the first dark ring in the particle diffraction pattern
284 C.A. Sciammarella, F.M. Sciammarella, and L. Lamberti
Figure 5 shows the diffraction orders corresponding to one family of fringes
that were extracted from the FT of the image captured by the optical system and
contains the diffraction pattern of the microsphere that acts as a relay lens. Since
these wave fronts come from the evanescent wave fronts, their sine is a complex
number taking values greater than 1. Figure 5 includes also the image extracted
from the FT of the central region of the diffraction pattern of the microsphere (the
first dark fringe of the microsphere diffraction pattern is shown in the figure) and
shows the presence of the families of fringes that were mentioned previously. The
fringes form moiré patterns that are modulated in amplitude in correspondence of
the loci of the interference fringes of the microsphere. A total of 120 orders have
been detected for this particular family [15]. These wave fronts play a role in the
observation of the sodium-chloride nano-crystals contained in the saline solution.
Figure 6 shows the schematic representation of the optical circuit bringing the
images to the CCD detector. The observed patterns are not images in the classical
sense. Therefore, the meaning of the concept of “super-resolution” must be
explained with respect to the present context.
Fig. 6. Schematic representation of the optical system leading to the formation of lens
hologram: 1) Prismatic nano-crystal; 2) Wave fronts entering and emerging from the
polystyrene micro-sphere acting as a relay lens; 3) Wave fronts arriving at the focal plane of
the spherical lens; 4) Wave fronts arriving at the image plane of the CCD. The simulation of
the overlapping of orders 0, +1 and -1 in the image plane of the CCD is also shown.
Experimental Mechanics in Nano-engineering 285
It can be seen that different diffraction orders emerge from the interfaces of the
crystals and the supporting microscope slide. These emerging wave fronts act as
multiplexers creating successive shifted images of the object. Let us assume that
we look at a prism (Fig. 6, Part 1) approximately parallel to the recording CCD
image plane. Successive shifted luminous images of the prism are then recorded.
It is possible to prove that the main energy is concentrated in the zero order and
the first order [11]. These orders overlap in an area that depends on the process of
formation of the image (see Fig. 6). The order 0 produces an image on the image
plane of the optical system, that is centered at a value x of the horizontal
coordinate. Let us call S(x) this image. The order +1 will create a shifted image of
the particle, S(x-Δx). The shift implies a change of the optical path between
corresponding points of the surface. In the present case, the trajectories of the
beams inside the prismatic crystals are straight lines and the resulting phase
changes are proportional to the observed image shifts. Therefore, the phase change
can be written as:
[
]
)xx(S)x(SK)x,x(
__
p
Δ=ΔφΔ (13)
where K
p
is a coefficient of proportionality. Equation (13) corresponds to a shift of
the image of the amount Δx. If the FT of the image is computed numerically, one
can apply the shift theorem of the Fourier transform. For a function f(x) shifted by
the amount Δx, the Fourier spectrum remains the same but the linear term ω
sp
Δx is
added to the phase: ω
sp
is the angular frequency of the FT. It is necessary to
evaluate this phase change. The shift can be measured on the image by
determining the number of pixels representing the displacement between
corresponding points of the image (see Fig. 6, Part 4). Through this analysis and
using the Fourier Transform it is possible to compute the thickness t of the prism
in an alternative way to the procedure that will be described in the following.
These developments are a verification of the mechanism of the formation of the
images as well as of the methods to determine prism thickness [11].
2.3 Formation of Holograms at the Nano-scale
Let us now consider the quasi-monochromatic coherent wave emitted by a nano-
sized prismatic crystal. The actual formation of the image is similar to a typical
lens hologram of a phase object illuminated by a phase grating [16]. The Fourier
Transform of the image of the nano-crystal extended to the complex plane is an
analytical function. If the FT is known in a region, then, by analytic continuation,
F(ω
sp
) can be extended to the entire domain. The resolution obtained in this
process is determined by the frequency ω
sp
captured in the image. The image can
be reconstructed by a combination of phase retrieval and suitable algorithms. The
image can be reconstructed from a F(ω
sp
) such that ω
sp
<ω
sp,max
, where ω
sp,max
is
determined by the wave fronts captured by the sensor.
The fringes generated by the different diffraction orders experience phase
changes that provide depth information. These fringes are carrier fringes that can
be utilized to extract optical path changes. This type of setup to observe phase

286 C.A. Sciammarella, F.M. Sciammarella, and L. Lamberti
objects was used in phase hologram interferometry as a variant of the original
setup proposed by Burch and Gates[17,18]. When the index of refraction in the
medium is constant, the rays going through the object are straight lines. If a
prismatic object is illuminated with a beam normal to its surface, the optical path
s
op
through the object is given by the integral:
∫
= dz)z,y,x(n)y,x(s
iop
(14)
where the direction of propagation of the illuminating beam is the z-coordinate
and the analyzed plane wave front is the plane x-y; n
i
(x,y,z) is the index of
refraction of the object through which light propagates.
The change experienced by the optical path is given by:
[]
∫
=Δ
t
0
o
_
iop
dzn)z,y,x(n)y,x(s (15)
where t is the thickness of the medium. By assuming that:
ci
n)z,y,x(n= (16)
where n
c
is the index of refraction of the observed nano-crystals, Eq. (15) then
becomes:
[]
∫
=Δ
t
0
o
_
iop
dzn)z,y,x(n)y,x(s=(n
c
-n
o
)t (17)
By transforming Eq. (17) into phase differences and making n
o
=n
s
, where n
s
is the
index of refraction of the saline solution containing the nano-crystals, one can
write:
t)nn(
p
2
s
_
c
π
=φΔ
(18)
where p is the pitch of the fringes generated by the thickness t of the specimen. In
general, the change of optical path is small and no fringes can be observed. In
order to solve this problem, carrier fringes can be added. An alternative procedure
is the introduction of a grating in the illumination path [16]. In the case of the
nano-crystals, the carrier fringes can be obtained from the FT of the lens hologram
of the analyzed crystals. In the holography of transparent objects, one can start
with recording an image without the transparent object of interest. In a second
stage, one can add the object and then superimpose both holograms in order to
detect the phase changes introduced by the object of interest. In the present
application, reference fringes can be obtained from the background field away
from the observed objects. This procedure presupposes that the systems of carrier
fringes are present in the field independently of the self-luminous objects. This
assumption is verified in the present case since one can observe fringes that are in
the background and enter the nano-crystals experiencing a shift.
Experimental Mechanics in Nano-engineering 287
a) b)
c) d) e)
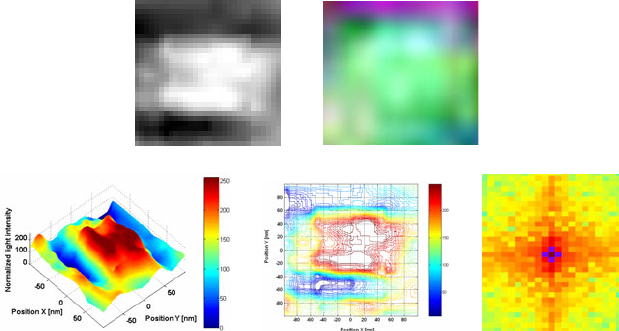
Fig. 7. NaCl prismatic nano-crystal of length 86 nm: a) Gray-level image (1024x1024
pixels); b) Image of the crystal captured by a colour camera; c) 3-D distribution of light
intensity; d) Isophote lines; e) FT pattern.
Figure 7 illustrates the case of a square cross-section crystal of length 86 nm.
Figure 7b is an image of the crystal recorded by a color camera; the crystal has a
light green tone. The monochromatic image and the color image have different
pixel structures. However, by using features of the images clearly identifiable, a
correspondence between the images could be established and the image of the
nano-crystal located. The figure indicates that the image color is the result of an
electromagnetic resonance and not an emission of light at the same wavelength as
the wavelength of the impinging light.
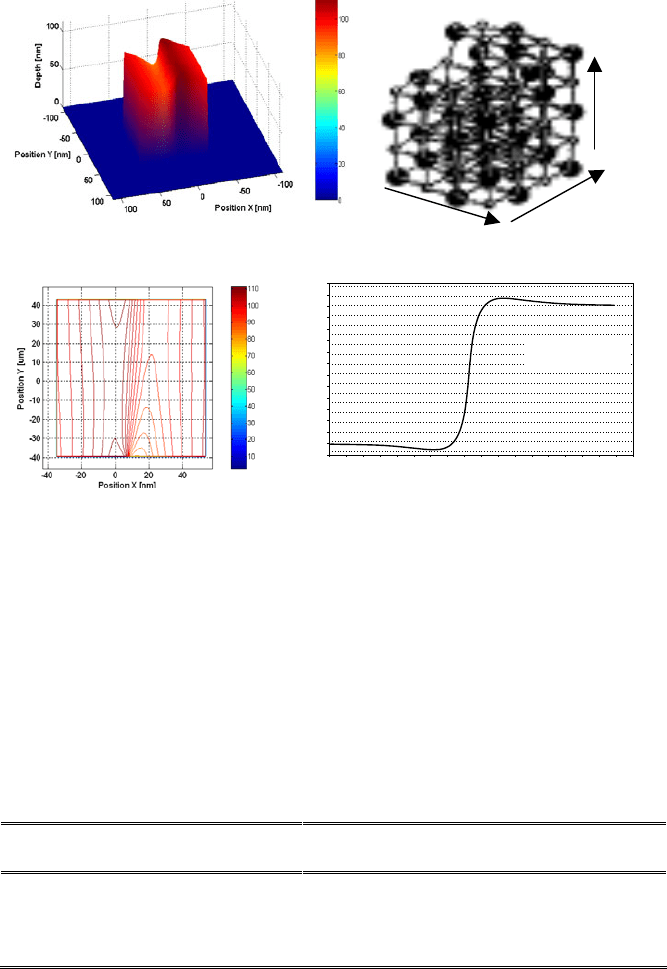
Figure 8a shows the numerical reconstruction of this crystal which is consistent
with the theoretical structure 5×4×4 [19]; Fig. 8c shows the level lines of the top
face of the crystal; Fig. 8d shows a cross section where each horizontal line
corresponds to five elementary cells of NaCl. The theoretical structure has one
step in the depth dimension (Fig. 8b). It is unlikely that the upper face of the nano-
crystal can be exactly parallel to the camera plane. Hence, the crystal shows an
inclination which can be corrected by means of an infinitesimal rotation. This
allows the actual thickness jump in the upper face of the crystal (see the
theoretical structure in Fig. 8b) to be obtained. The jump in thickness is 26 nm out
of a side length of 86 nm: this corresponds to a ratio of 0.313 which is very close
to theory. In fact, the theoretical structure predicts a jump in thickness of one
atomic distance vs. three atomic distances in the transverse direction: that is, a
ratio of 0.333.
Similarly to the case of quantum dots, nano-crystals of different sizes emit light
of different frequencies. The physical reason for this is called quantum
confinement effect. Smaller crystal emit higher energies and therefore their sizes
determine the energy and finally the color. For example, this crystal emits light at
500 nm, in the blue-green range. An explanation of the process of light generation
is given in [11].
288 C.A. Sciammarella, F.M. Sciammarella, and L. Lamberti
a) b)
c)
90
92
94
96
98
100
102
104
106
108
110
112
114
116
118
120
0 5 10 15 20 25 30 35 40 45 50 55 60 65 70 75 80 85 90
Depth X
[nm]
Thickness Z
[nm]
Spacing between dotted
lines corresponds to the
size of 3 elementary cells
d)
Depth (X)
Thickness (Z)
Width (Y)
Fig. 8. a) Numerical reconstruction of a NaCl nano-crystal of length 86 nm, the crystal is
inclined with respect to the image plane; b) Schematic of the theoretical structure 5x4x4; c)
Level lines; d) Rotated cross section of the upper face of the nano-crystal: the spacing
between dotted lines corresponds to the size of three elementary cells.
Table 2 shows the experimental aspect ratios measured for some nano-crystals:
these values are compared with the theoretical aspect ratios. The table also
provides the error analysis of these results. Thicknesses reported in Table 3 are the
average values shown in Table 2.
Table 2. Aspect ratio of the observed nano-crystals: experiments vs. theory
Nano-crystal
length (nm)
Experimental
dimensions (nm)
Experimental
aspect ratio
Theoretical aspect
ratio
54 72 x 54 x 53 5.43 x 4.08 x 4 5 x 4 x 4
55 55 x 45 x 33.5 4.93 x 4.03 x 3 5 x 5 x 3
86 104 x 86 x 86 4.84 x 4 x 4 5 x 4 x 4
120 120 x 46 x 46 7.83 x 3 x 3 8 x 3 x 3
Mean error on aspect ratios = 4.59%; Standard deviation on aspect ratios = ± 6.57%.
