Korb K.B., Nicholson A.E. Bayesian Artificial Intelligence
Подождите немного. Документ загружается.


Adding an arc from BPP Final to OPP Final, to reflect the dependence be-
tween them.
Extending the BN to a decision network, in particular changing the decision
method from one based on probability betting curves to one based on expected
winnings.
Improving the bluffing by taking into account the opponent’s belief in BPP
winning and making bluffing consistent throughout the last round when un-
dertaken.
The network structure for this version, previously shown in Figure 5.5 is shown again
in Figure 11.1(b) for easy comparison.
11.2.3 Ongoing Bayesian poker
Finally, as this text is being written, our poker project continues [29]. Possible direc-
tions of ongoing research include the following.
Ideally, the program should also take advantage of the difference between BPP’s
upcards and its full hand. The point is that when one’s strong cards are showing on
the table, there is no reason to bet coyly; on the contrary, it is advantageous to make
opponents pay for the opportunity of seeing any future cards by betting aggressively.
On the other hand, when one’s strongest card is hidden, aggressive betting can drive
opponents out of the game prematurely. This could be done by using the BN model
from both BPP and the opponent’s side to obtain different user model views of the
strength of BPP. When the opponent’s view is “strong” but BPP’s view is weak, BPP
should bet heavily. When both views are strong, BPP should bet more softly to keep
the opponent playing.
Just as for BPP, the conservativeness or aggressiveness of an opponent’s play,
which is learned and captured by recalibrating the matrices relating OPP Current
and OPP Action, does not fully describe the bluffing behavior of the opponent. A
plausible extension would be to add an opponent bluffing node which is a parent of
OPP Action and a child of OPP Current and BPP Current (since the latter gives rise
to BPP’s upcards and behavior, even though they are not explicitly represented). An-
other structural change important for improved learning and play would be to make
OPP Action a child node of a new BPP Upcards node, so that what the opponent
observes of BPP’s hand would jointly condition his or her behavior. Figure 11.1(c)
shows the proposed new network structure.
We are also modifying BPP to play Texas-Hold’em Poker, to allow us to compete
against other automated opponents online. These online gaming environments will
also require extensions to handle multi-opponent games. In multiple opponent games
it will be more important to incorporate the interrelations between what is known of
different player’s hands and the node representing their final hands.
We also anticipate using a dynamic Bayesian network (DBN) to model more ef-
fectively the interrelation between rounds of play; more details of this modeling
problem are left as a homework problem (see Problem 5.8).
© 2004 by Chapman & Hall/CRC Press LLC

Finally, we are aware that the lack of non-showdown information is likely to intro-
duce some selection bias into the estimates of the conditional probabilities, but we
have not yet attempted to determine the nature of this bias.
11.2.4 KEBN aspects
There are several points to make about this case study, in terms of the overall KEBN
process.
All the network structures have been hand-crafted, while the parameters have been
either generated (by dealing out large numbers of poker hands) or learnt during play-
ing sessions. This combination of elicitation and learning is fairly typical of BN
projects to date, where the amount of expert domain knowledge (and lack of data)
means that hand-crafting the structure is the only option.
Our domain expert on this project was one of the authors (who has had consid-
erable poker playing experience), which meant we didn’t have to deal with the KE
difficulties associated with using an expert who is unfamiliar with the technology.
As we are interested in poker as a challenging application for our BN research
agenda, BPP has never been deployed in a “live” environment where BPP and its
opponents are playing for money. This has undoubtedly limited the validation and
field testing phases of our proposed lifecycle model (see Figure 9.1), and there has
certainly been no industrial use.
On the other hand, there has been an iterative development cycle, with continual
refinement of the versions, following the incremental prototype model. We started
with sufficient assumptions to allow the development of a simple but working initial
model and gradually increased the complexity, adding variables, increasing the num-
ber of values, adding arcs (moving from a polytree to a graph) and extending a BN
into a decision network.
The management of versions has been adequate, allowing subsequent versions of
BPP to be tested against earlier versions. We did not document changes and the
rationale for them as part of a formal KEBN process, but fortunately a series of
research reports and papers served that purpose.
11.3 An intelligent tutoring system for decimal understanding
In this section we present a case study in the construction of a BN in an intelligent
tutoring system (ITS) application
, specifically decimal understanding, for the target
age range of Grades 5 to 10 [204, 267].
To understand the meaning and size of numbers written using a decimal point in-
volves knowing about place value columns, the ordering of numbers by size and the
There have been a number of other successful ITS systems that use Bayesian networks, e.g., [50, 49,
184, 283].
© 2004 by Chapman & Hall/CRC Press LLC
value of digits. Although this is a topic plagued by misconceptions, very often stu-
dents don’t know they harbour them. Our education domain experts had been work-
ing in this area for some time, gathering and analyzing data on students’ thinking
about decimals. An ITS consisting of computer games involving decimals was being
designed and developed as a useful learning tool to supplement classroom teaching.
Our domain experts needed an underlying reasoning engine that would enable the
ITS to diagnose and target an individual’s wrong way of thinking about decimals;
here we describe the development of a BN to do this.
We begin with the background domain information that was available at the start
of the project (
11.3.1), and then we present the overall architecture of the ITS archi-
tecture (
11.3.2). Next we give a detailed description of the both expert elicitation
phase, including evaluations (
11.3.3), and the investigation that was undertaken us-
ing automated methods (
11.3.4). Finally, we describe results from field trials and
draw some conclusions from the case study as a whole.
11.3.1 The ITS domain
Students’ understanding of decimal numeration has been mapped using a short test,
the Decimal Comparison Test (DCT), where the student is asked to choose the larger
number from each of 24 pairs of decimals [269]. The pairs of decimals are carefully
chosen so that from the patterns of responses, students’ (mis)understanding can be
diagnosed as belonging to one of a number of classifications. These classifications
have been identified manually, based on extensive research [269, 234, 241, 268].
The crucial aspects are that misconceptions are prevalent, that students’ behavior is
very often highly consistent and that misconceptions can be identified from patterns
amongst simples clues.
About a dozen misconceptions have been identified [269], labeled vertically in
Table 11.1. This table also shows the rules the domain experts originally used to
classify students based on their response to 6 types of DCT test items (labeled hor-
izontally across the top of the table): H = High number correct (e.g., 4 or 5 out of
5), L = Low number correct (e.g., 0 or 1 out of 5), with ‘.’ indicating that any per-
formance level is observable for that item type by that student class other than the
combinations seen above. Most misconceptions are based on false analogies, which
are sometimes embellished by isolated learned facts. For example, many younger
students think 0.4 is smaller than 0.35 because there are 4 parts (of unspecified size,
for these students) in the first number and 35 parts in the second. However, these
“whole number thinkers” (LWH, Table 11.1) get many questions right (e.g., 5.736
compared with 5.62) with the same erroneous thinking. So-called ‘reciprocal think-
ing’ students (SRN, Table 11.1) choose 0.4 as greater than 0.35 but for the wrong
reason, as they draw an analogy between fractions and decimals and use knowledge
that 1/4 is greater than 1/35.
The key to designing the DCT was the identification of “item types.” An item
type is a set of items which a student with any misconception should answer consis-
tently (either all right or all wrong). The definition of item types depends on both the
mathematical properties of the item and the psychology of the learners. In practice,
© 2004 by Chapman & Hall/CRC Press LLC

TABLE 11.1
Response patterns expected from students with different misconceptions
Coarse Fine Description Item type (with sample item)
Class Class 1 2 3 4 5 6
0.4 5.736 4.7 0.452 0.4 0.42
0.35 5.62 4.08 0.45 0.3 0.35
A ATE apparent expert H H H H H H
AMO money thinker H H H L H H
AU unclassified A H H . . . .
L LWH whole number thinking L H L H H H
LZE zero makes small L H H H H H
LRV reverse thinking L H L H H L
LU unclassified L L H . . . .
S SDF denominator focused H L H L H H
SRN reciprocal negative H L H L L L
SU unclassified S H L . . . .
U MIS misrule L L L L L L
UN unclassified . . . . . .
the definition is also pragmatic — the number of theoretically different item types
can be very large, but the extent to which diagnostic information should be squeezed
from them is a matter of judgement. The fine misconception classifications had been
“grouped” by the experts into a coarse classification — L (think longer decimals are
larger numbers), S (shorter is larger), A (correct on straightforward items (Types 1 &
2)) and U (other). The LU, SU and AU “catch-all” classifications for students who on
their answers on Type 1 and 2 items behave like others in their coarse classification,
but differ on other item types. These and the UNs may be students behaving con-
sistently according to an unknown misconception, or students who are not following
any consistent interpretation.
The computer game genre was chosen to provide children with an experience
different from, but complementary to, normal classroom instruction and to appeal
across the target age range (Grades 5 to 10). The system offers several games, each
focused on one aspect of decimal numeration, thinly disguised by a story line.
In the “Hidden Numbers” game students are confronted with two decimal num-
bers with digits hidden behind closed doors; the task is to find which number is the
larger by opening as few doors as possible. Requiring similar knowledge to that
required for success on the DCT, the game also highlights the place value property
that the most significant digits are those to the left. The game “Flying Photographer”
requires students to “photograph” an animal by clicking when an “aeroplane” passes
a specified number on a numberline. The “Number Between” game is also played
on a number line, but particularly focuses on the density of the decimal numbers;
students have to type in a number between a given pair. Finally, “Decimaliens” is a
classic shooting game, designed to link various representations of the value of digits
in a decimal number. These games address several of the different tasks required
of an integrated knowledge of decimal numeration based on the principles of place
value. It is possible for a student to be good at one game or the diagnostic test, but
© 2004 by Chapman & Hall/CRC Press LLC
Adaptive BN
− diagnosis
− prediction
− sensitivity
analysis
System controller
module
− item type?
− help?
− new game?
− Hidden Number
− Flying Photographer
− Decimaliens
− Number Between
generic BN
student info
class test
results
sequencing
tactics
Teacher
DCT test
Student
Classroom
teaching
activities
Computer Games
Item
Help
Report
Answer
Answers
Help
Answer
New game
Item type
Item
Answer
Feedback
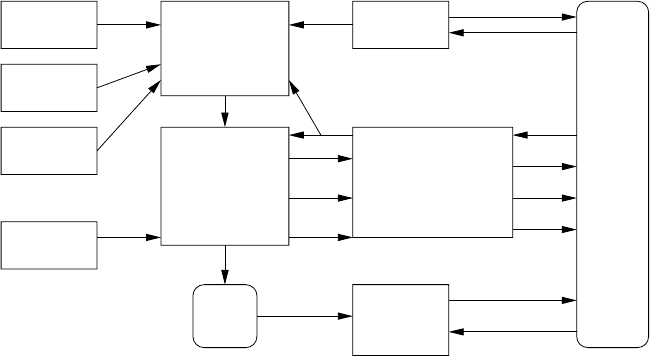
FIGURE 11.2
Intelligent tutoring system architecture.
not good at another; emerging knowledge is often compartmentalized.
11.3.2 ITS system architecture
The high-level architecture of our system is shown in Figure 11.2. The BN is used
to model the interactions between a student’s misconceptions, their game playing
abilities and their performance on a range of test items. The BN is initialized with a
generic model of student understanding of decimal numeration constructed using the
DCT results from a large sample of students [270]. The network can also be tailored
to an individual student using their age or results from a short online DCT. During a
student’s use of the system, the BN is given information about the correctness of the
student’s answers to different item types encountered in the computer games.
Given the model, and given evidence about answers to one or more item types, the
Bayesian belief updating algorithm then performs diagnosis; calculating the proba-
bilities that a student with these behaviors has a particular misconception. Changes
in the beliefs in the various misconceptions are in turn propagated within the net-
work to perform prediction; the updating algorithm calculates the new probabilities
of a student getting other item types right or wrong. After each set of evidence is
added and belief updating performed, the student model stored within the network is
updated, by changing the misconception node priors. Updating the network in this
way as the student plays the game (or games) allows changes in students’ thinking
and skills to be tracked. The identification of the misconception with the highest
probability provides the best estimate of the students’ current understanding.
The information provided by the BN is, in turn, used by a controller module,
together with the specified sequencing tactics (see below), to do the following: se-
© 2004 by Chapman & Hall/CRC Press LLC
lect items to present to the student; or decide whether additional help presentation
is required; or decide when the user has reached expertise and should move to an-
other game. The controller module also makes a current assessment of the student
available to the teacher and reports on the overall effectiveness of the adaptive sys-
tem. The algorithm for item type selection incorporates several aspects, based on the
teaching model. Students are presented with examples of all item types at some stage
during each session. Students meeting a new game are presented with items that the
BN predicts they are likely to get correct to ensure they have understood the rules
and purposes of the game. If the probabilities of competing hypotheses about the
student’s misconception classification are close, the system gives priority to diagno-
sis and proposes a further item to be given to the user. By employing the Netica BN
software’s “sensitivity to findings” function (see
10.3.1), the user is presented with
an item that is most likely to distinguish between competing hypotheses. Finally, the
network selects items of varying difficulty in an appropriate sequence for the learner.
The current implementation of the system allows comparison of different sequencing
tactics: presenting the hard items first, presenting the easy items first and presenting
easy and hard items alternately. Note that the terms easy and hard are relative to the
individual student and based on the BN’s prediction as to whether they will get the
item correct.
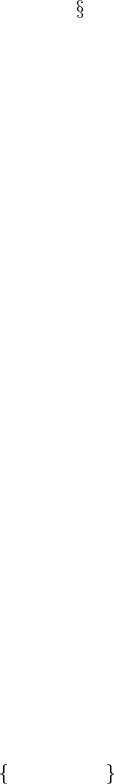
The ITS also incorporates two forms of teaching into the games: clear feedback
and visual scaffolding. For example, in the Flying Photographer, where students
have to place numbers on number lines, feedback is given after each placement (see
Figure 11.3): if the position is incorrect a sad red face appears at the point, whereas
the correct position is (finally) marked by a happy green face. In this game, the visual
scaffolding marks intermediate numbers on the interval; for example, when a student
has twice failed to place a number correctly on the interval [0,1], the intermediate
values 0.1, 0.2, 0.3, ..., 0.9 appear for this and the next item.
11.3.3 Expert elicitation
In this section we describe the elicitation of a fragment of the decimal misconcep-
tion BN from the education domain experts. This fragment was the first prototype
structure built, involving only the diagnosis of misconceptions through the DCT; the
game fragments were constructed in later stages of the project. This exposition is
given sequentially: the identification of the important variables and their values; the
identification and representation of the relationships between variables; the parame-
terization of the network; and finally the evaluation. In practice, of course, there was
considerable iteration over these stages.
11.3.3.1 Nodes
We began the modeling with the main “output” focus for the network, the represen-
tation of student misconceptions. The experts already had two levels of classifica-
tions for the misconceptions, which we mapped directly onto two variables. The
coarseClass node can take the values
L, S, A, UN , whereas the fineClass node,
incorporating all the misconception types identified by the experts, can take the 12
© 2004 by Chapman & Hall/CRC Press LLC
FIGURE 11.3
A screen from the ITS “Flying Photographer” game showing visual feedback (trian-
gle) and scaffolding (marked intervals).
values shown in column 1 of Table 11.1. Note that the experts considered the classi-
fications to be mutually exclusive; at any one time, the student could only hold one
misconception. While the experts knew that the same student could hold different
misconceptions at different times, they did not feel it was necessary, at least initially,
to model this explicitly with a DBN model.
Each different DCT item type was made an observation variable in the BN, rep-
resenting student performance on test items of those types; student test answers are
entered as evidence for these nodes. The following alternatives were considered for
the possible values of the item type nodes.
Suppose the test contains N items of a given type. One possible set of values
for the BN item type node is
0,1, ..., N , representing the number of the items
the student answered correctly. The number of items may vary for the different
types and for the particular test set given to the students, but it is not difficult to
adjust the BN. Note that the more values for each node, the more complex the
overall model; if N were large (e.g.,
20), this model may lead to complexity
problems.
The item type node may be given the values High, Medium, Low , reflecting
an aggregated assessment of the student’s answers. For example, if 5 such
items were presented, 0 or 1 correct would be considered low, 2 or 3 would be
medium, while 4 or 5 would be high. This reflects the expert rules classification
described above.
Both alternatives were evaluated empirically (see
11.3.3.5 below); however the
H/M/L option was used in the final implementation.
© 2004 by Chapman & Hall/CRC Press LLC

11.3.3.2 Structure
The experts considered the coarse classification to be a strictly deterministic com-
bination of the fine classification; hence, the coarseClass node was made a child of
the fineClass node. For example, a student was considered an L if and only if it
was one of an LWH, LZE, LRV or LU. For the DCT test item types, the coarseClass
node was not necessary; however, having it explicitly in the network helped both
the expert’s understanding of the network’s reasoning and the quantitative evalua-
tion. In addition, including this node allowed modeling situations where all students
with the same coarse misconception exhibit the same behavior (e.g., in the Flying
Photographer game).
The type nodes are observation nodes, where entering evidence for a type node
should update the posterior probability of a student having a particular misconcep-
tion. As discussed in
2.3.1, such diagnostic reasoning is typically reflected in a
BN structure where the class, or “cause,” is the parent of the “effect” (i.e., evidence)
node. Therefore an arc was added from the fineClass node to each of the type nodes.
No connections were added between any of the type nodes, reflecting the experts’
intuition that a student’s answers for different item types are independent, given the
subclassification.
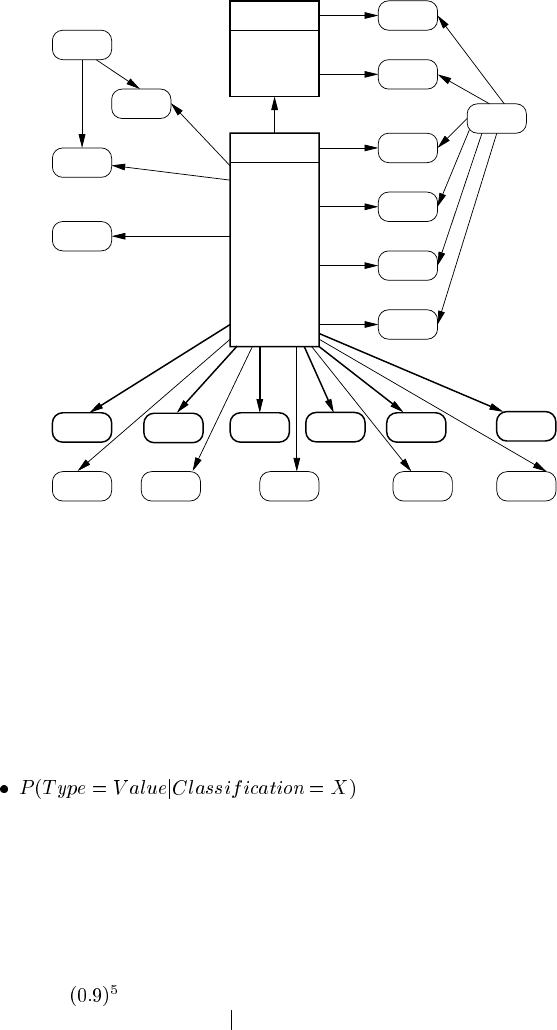
A part of the expert elicited BN structure implemented in the ITS is shown in Fig-
ure 11.4. This network fragment shows the coarseClass node (values
L,S,A,UN ),
the detailed misconception fineClass node (12 values), the item type nodes used for
the DCT, plus additional nodes for the Hidden Number and Flying Photographer
games. The bold item type nodes are those corresponding to the DCT test data set
and hence used subsequently for evaluation and experimentation.
The “HN” nodes relate to the Hidden Numbers game, with evidence entered for
the number of doors opened before an answer was given (HN
nod) and a measure of
the “goodness of order” in opening doors (HN
gos). The root node for the Hidden
Number game subnet reflects a player’s game ability, specifically their door opening
“efficiency” (HN
eff). The “FPH” node relate to the Flying Photographer game. The
node FPH
ls records evidence when students have to place a long number, which is
small in size, such as 0.23456. As noted above, LWH students are likely to make
an error on this task. The other nodes perform similar functions, with the root node
FPH
pa reflecting a player’s overall game ability.
The BNs for the other two games are separate BNs as student performance on these
provides information about abilities other than the 12 misconceptions; however their
construction was undertaken using similar principles.
11.3.3.3 Parameters
The education experts had collected data that consisted of the test results and the
expert rule classification on a 24 item DCT for over 2,500 test papers from students
in Grades 5 and 6. These were then pre-processed to give each student’s results in
terms of the 6 test item types; 5,5,4,4,3,3 were the number of items of these type 1
to 6 respectively. The particular form of the pre-processing depends on the item type
values used: with the 0-N type node values, a student’s results might be 541233,
© 2004 by Chapman & Hall/CRC Press LLC
Type2
Type5
.159LWH
LZE
LRV
LU
SDF
SRN
SU
ATE
AMO
MIS
AU
U
.040
.004
.031
.036
.065
.028
.431
.033
.003
.033
.138
HN_Eff
HN_gos
HN_nod
FineClass
Type3
Type4
Type6
Type9
Type10
FPH_ss
FPH_iz
FPH_ls
FPH_o
FPH_ll
FPH_pa
CoarseClass
L 23.4
12.9S
A 49.9
U 13.8
FPH_sl
Type1
Type7
Type8a Type8b
ND_id
FIGURE 11.4
Fragment of the expert elicited BN currently implemented. Bold nodes are those
discussed here.
whereas with the H/M/L values, the same student’s results would be represented as
HHLMHH.
The expert rule classifications were used to generate the priors for the sub-classifi-
cations. The priors are found to vary slightly between different classes and teaching
methods, and quite markedly between age groups; however these variations are ig-
nored for current purposes. All the CPTs of the item types take the form of
As we have seen from the domain description, the experts expect particular classes
of students to get certain item types correct and others wrong. However we do need
to model the natural deviations from such “rules,” where students make a careless
error. We model this uncertainty by allowing a small probability of a careless mis-
take on any one item. For example, students who are thinking according to the LWH
misconception are predicted to get all 5 items of Type 2 correct. If, however, there
is a probability of 0.1 of a careless mistake on any one item, the probability of a
score of 5 is
, and the probability of other scores follows the binomial distribu-
tion; the full vector for P(Type2
Subclass=LWH) is (0.59,0.33,0.07,0.01,0.00,0.00)
(to two decimal places). When the item type values H/M/L are used, the numbers
are accumulated to give the vector (0.92,0.08,0.00) for H, M and L.
© 2004 by Chapman & Hall/CRC Press LLC

The experts considered that this mistake probability was considerably less than
0.1, of the order of 1-2%. We ran experiments with different probabilities for a
single careless mistake (
=0.03, 0.11 and 0.22), with the CPTs calculated in this
manner, to investigate the effect of this parameter on the behavior of the system.
These numbers were chosen to give a combined probability for HIGH (for 5 items)
of 0.99, 0.9 and 0.7 respectively, numbers that our experts thought were reasonable.
Much more difficult than handling the careless errors in the well understood be-
havior of the specific known misconceptions is to model situations where the experts
do not know how a student will behave. This was the case where the experts specified
‘.’ for the classifications LU, SU, AU and UN in Table 11.1. We modeled the expert
not knowing what such a student would do on the particular item type in the BN
by using 0.5 (i.e., 50/50 that a student will get each item correct) with the binomial
distribution to produce the CPTs.
11.3.3.4 The evaluation process
During the expert elicitation process we performed the following three basic types
of evaluation. First was case-based evaluation (see
10.4) , where the experts “play”
with the net, imitating the response of a student with certain misconceptions and re-
view the posterior distributions on the net. Depending on the BN parameters, it was
often the case that while the incorporation of the evidence for the 6 item types from
the DCT test data greatly increased the BN’s belief for a particular misconception,
the expert classification was not the BN classification with the highest posterior, be-
cause it started with a low prior. We found that it was useful to the experts if we
also provided the ratio by which each classification belief had changed (although the
highest posterior is used in all empirical evaluations). The case-based evaluation also
included sequencing, where the experts imitate repeated responses of a student, up-
date the priors after every test and enter another expected test result. The detection of
the more uncommon classifications through repetitive testing built up the confidence
of the experts in the adaptive use of the BN.
Next, we undertook comparative evaluation between the classifications of the BN
compared to the expert rules on the DCT data. It is important to note here that the
by-hand classification is only a best-guess of what a student is thinking — it is not
possible to be certain of the “truth” in a short time frame. As well as a comparison
grid (see next subsection), we provided the experts with details of the records where
the BN classification differed from that of the expert rules. This output proved to be
very useful for the expert in order to understand the way the net is working and to
build confidence in the net.
Finally, we performed predictive evaluation (see
10.5.1) which considers the pre-
diction of student performance on individual item type nodes rather than direct mis-
conception diagnosis. We enter a student’s answers for 5 of the 6 item type nodes,
then predict their answer for the remaining one; this is repeated for each item type.
The number of correct predictions gives a measure of the predictive accuracy of each
model, using a score of 1 for a correct prediction (using the highest posterior) and 0
for an incorrect prediction. We also look at the predicted probability for the actual
© 2004 by Chapman & Hall/CRC Press LLC