Korb K.B., Nicholson A.E. Bayesian Artificial Intelligence
Подождите немного. Документ загружается.


TABLE 11.2
Comparison grid: expert rule (vertical) vs expert elicited
BN (horizontal) classification; type node states 0-N,
=0.11. Desirable re-classifications are italicized,
while undesirable ones are in bold.
lwh lze lrv lu sdf srn su ate amo mis au un
lwh 386 0 0 0 0 0 0 0 0 0 0 0
lze 0 98 0 0 0 0 0 0 0 0 0 0
lrv 10 0000 00 0 0 000
lu 69054 0 0 0 0 0 0 0 6
sdf 0 0 0 0 83 0 4 00000
srn 0 0 0 0 0 159 0 0 0 0 0 0
su 0 0 0 0 22240 3 0002
ate 0 0 0 0 0 0 0 1050 0 0 0 0
amo 0 000 0 00 0 79 000
mis 0 0 0 0 0 0 0 0 0 6 0 0
au 9 0000 00 63 8 001
un 43 6 0 15 35 14 11 119 26 2 066
student answer. Both measures are averaged over all students.
We performed these types of evaluation repeatedly throughout the development of
the network, which showed the effect changes in structure or parameters may have
had on the overall behavior. The iterative process halted when the experts felt the
behavior of the BN was satisfactory.
11.3.3.5 Empirical evaluation
Table 11.2 is an example of the comparison grids for the classifications that were
produced during the comparison evaluation phase. The vertical list down the first
column corresponds to the expert rules classification, while the horizontal list across
the top corresponds to the BN classification, using the highest posterior; each entry
in the grid shows how many students had a particular combination of classifications
from the two methods. The grid diagonals show those students for whom the two
classifications are in agreement, while the “desirable” changes are shown in italics
and undesirable changes are shown in bold. Notethatweusetheterm“match,”
rather than saying that the BN classification was “correct,” because the expert rule
classification is not necessarily ideal.
Further assessment of these results by the experts revealed that when the BN clas-
sification does not match the expert rules classification, the misconception with the
second highest posterior often did match. The experts then assessed whether differ-
ences in the BN’s classification from the expert rules classification were in some way
desirable or undesirable, depending on how the BN classification would be used.
They came up with the following general principles which provided some general
comparison measures.
1. It is desirable for expert rule classified LUs to be re-classified as another of
the specific Ls, similarly for AUs and SUs, and it was desirable for Us to be
© 2004 by Chapman & Hall/CRC Press LLC

TABLE 11.3
Results showing fine classification summary comparison of various models compared to
the expert rules (match, desirable and undesirable changes), together with accuracy of
various models predicting student item type answers (using two different measures)
Method Type Match Des. Undes. Avg Pred. Avg Pred.
values change change Accuracy Prob.
Expert 0-N 0.22 77.88 20.39 1.72 0.34 0.34
BN 0.11 82.93 15.63 1.44 0.83 0.53
0.03 84.37 11.86 3.78 0.82 0.70
H/M/L 0.22 80.47 18.71 0.82 0.89 0.69
0.11 83.91 13.66 2.42 0.89 0.80
0.03 90.40 6.48 3.12 0.88 0.83
SNOB 24 DCT 79.81 17.60 2.49
0-N 72.06 16.00 11.94
H/M/L 72.51 17.03 10.46
learned 0-N Avg 95.97 2.36 1.66 0.83 0.74
parameters H/M/L Avg 97.63 1.61 0.75 0.89 0.83
CaMML 0-N Avg 86.51 5.08 8.41 0.83 0.72
constr. H/M/L Avg 83.48 8.12 8.34 0.88 0.79
CaMML 0-N Avg 86.15 5.87 7.92 0.83 0.74
uncons. H/M/L Avg 92.63 4.61 2.76 0.89 0.83
re-classified as anything else (because this is dealing with borderline cases that
the expert rule really can’t say much about).
2. It is undesirable for (a) specific classifications (i.e., not those involving any
kind of “U”) to change, because the experts are confident about these classifi-
cations, and (b) for any classification to change to UN, because this is in some
sense throwing away information (e.g., LU to UN loses information about the
“L-like” behavior of the students).
Many classification comparison grids were obtained through varying the proba-
bility of a careless mistake (
=0.22, 0.11 and 0.03) and the item type values (0-N
vs H/M/L). The percentages for match, desirable and undesirable change were cal-
culated for each grid.
Considerable time was spent determining the following factors that might be caus-
ing the differences between the BN and the expert rule classifications. First, the ex-
pert rules give priority to the type 1 and type 2 results, whereas the BN model gives
equal weighting to all 6 item types. Second, the expert elicited BN structure and
parameters reflects both the experts’ good understanding for the known fine clas-
sifications, and their poor understanding of the behavior of “U” students (LU, SU,
AU and UN). Finally, as discussed earlier, some classes are broken down into fine
classifications more than others, resulting in lower priors, so the more common clas-
sifications (such as ATE and UN) tend to draw in others.
Table 11.3 (Set 1) shows a summary of the expert BN fine classification, varying
the type values and probability of careless mistake, in terms of percentage of matches
(i.e., on the grid diagonal), desirable changes and undesirable changes and the two
prediction measures (see
10.5.1), averaged over all predicted item types, for all
students. The experts considered the undesirable change percentages to be quite low,
especially considering that they felt some of these can be considered quite justified.
© 2004 by Chapman & Hall/CRC Press LLC
Overall the experts were satisfied that the elicited network performs a good classi-
fication of students’ misconceptions and captures well the different uncertainties in
the experts’ domain knowledge. In addition, they were reassured by the fact that its
performance appeared quite robust to changes in parameters such as the probability
of careless mistakes or the granularity of the evidence nodes.
11.3.4 Automated methods
The next stage of the project involved the application of certain automated methods
for knowledge discovery to the domain data, for each main task in the construction
process.
1. We applied a classification method to student test data.
2. We performed simple parameter learning based on frequency counts to the
expert BN structures; and
3. We applied an existing BN learning program, CaMML [294].
In each case we compared the performance of the resultant network with the expert
elicited networks, providing an insight into how elicitation and knowledge discovery
might be combined in the BN knowledge engineering process.
11.3.4.1 Classification
The first aspect investigated was the classification of decimal misconceptions. We
applied the SNOB probabilistic classification program [289], based on the infor-
mation theoretic Minimum Message Length (MML) [290] to the data from 2437
testpapers in different forms:
1. The raw data from the 24 DCT items
2. The data pre-processed from 24 items into the 6 item types
(a) Using the values 0-N
(b) Using the values H/M/L
Using the SNOB’s most probable class for each student, we constructed comparison
grids comparing the SNOB classification with the expert rule classification.
Given the raw data of 24 DCT items, SNOB produced 12 classes, 8 of which
corresponded closely to the expert classifications (i.e., had most members on the
grid diagonal). Two classes were not found (LRV and SU). Of the other 4 classes, 2
were mainly combinations of the AU and UN classifications, while the other 2 were
mainly UNs. SNOB was unable to classify 15 students (0.6%). The percentages of
match, desirable and undesirable change are shown in Table 11.3 (set 2, row 1). They
are comparable with the expert BN 0-N and only slightly worse than the expert BN
H/M/L results.
The comparison results using the data pre-processed into 6 item types (values 0-N
and H/M/L) were not particularly good.
© 2004 by Chapman & Hall/CRC Press LLC

For O-N type values, SNOB found only 5 classes (32 students = 1.3% not
classified), corresponding roughly to some of the most populous expert classes
(LWH, SDF, SRN, ATE and UN), subsuming the other expert classes.
For H/M/L type values, SNOB found 6 classes (33 students = 1.4% not classi-
fied), corresponding roughly to 5 of the most populous expert classes (LWH,
SDF, SRN, ATE, UN), plus a class that combined MIS with UN. The match
results are shown in Table 11.3 (set 2, rows 2 and 3).
Clearly, summarizing the results of 24 DCT into 6 item types gives a worse classifi-
cation; one explanation of this was that many pairs of the classes are distinguished by
student behavior on just one item type, and SNOB might consider these differences
to be noise within one class.
The overall good performance of the classification method shows that automated
knowledge discovery methods may be useful in assisting experts to identify suitable
values for classification type variables, particularly when extensive analysis of the
domain is not available.
11.3.4.2 Parameters
Our next investigation was to learn the parameters from the data, while keeping the
expert elicited network structure. The data was randomly divided into five 80%-20%
splits for training and testing; the training data was used to parameterize the expert
BN structures (using the the Spiegelhalter-Lauritzen Algorithm 7.1 in Netica), while
the test data was given to the resultant BN for classification. The match results
(averaged over the 5 splits) for the fine classification comparison of the expert BN
structures (with the different type values, 0-N and H/M/L) with learned parameters
are shown in Table 11.3 (set 3), together with corresponding prediction results (also
averaged over the 5 splits).
Clearly, learning the parameters from data, if it is available, gives results that
are much closer to the expert rule classification than using the parameters elicited
from the experts. The trade-off is that the network no longer makes changes to the
various “U” classifications, i.e., it doesn’t shift LUs, SUs, AUs and UNs into other
classifications that may be more useful in a teaching context. However it does mean
that expert input into the knowledge engineering process can be reduced, by doing
the parameter learning on an elicited structure.
11.3.4.3 Structure
Our third investigation involved the application of CaMML [294] (see
8.5) to learn
network structure. In order to compare the learned structure with that of the expert
elicited BN, we decided to use the pre-processed 6 type data; each program was
given the student data for 7 variables (the fine classification variable and the 6 item
types), with both the 0-N values and the H/M/L values. The same 5 random 80%-
20% splits of the data were used for training and testing. The training data was given
as input to the structural learning algorithm and then used to parameterize the result
networks using Netica’s parameter learning method.
© 2004 by Chapman & Hall/CRC Press LLC

We ran CaMML once for each split (a) without any constraints and (b) with the
ordering constraint that the classification should be an ancestor of each of the type
nodes. This constraint reflects the general known causal structure. Each run pro-
duced a slightly different network structure, with some having the fineClass node
as a root, some not. Two measures of network complexity were used: (i) ratio of
arcs/nodes, which varied from 1.4 to 2.2 and (ii) the total number of probabilities in
the CPTs, which varied from about 700 to 144,000. The junction-tree cost was not
used as a measure, although it probably should have been!
The percentage match results comparing the CaMML BN classifications (con-
strained and unconstrained, O-N and H/M/L) are also shown in Table 11.3 (sets 4
and 5), together with the prediction results. The undesirable changes include quite a
few shifts from one specific classification to another, which is particularly bad as far
as our experts are concerned. The variation between the results for each data set 1-5
was much higher than for the variation when learning parameters for the expert BN
structure, no doubt reflecting the difference between the network structure learned
for the different splits. However we did not find a clear correlation between the
complexity of the learned network structures and their classification performance.
Our experts also looked at the learnt structures during this phase of the project,
but they did not have an intuitive feel for how these structures were modeling the do-
main. In particular, the change in the direction of the arc between the classification
node and (one or more of) the item type nodes did not reflect the causal model we had
introduced them to during the elicitation phase. Also, there were many arcs between
item type nodes, and they could not explain these dependencies with their domain
knowledge. Some time later, one of the experts investigated one of these learnt struc-
tures using Matilda (see
9.3.2.2), as part of Matilda’s evaluation process. By using
this KEBN support tool, the expert gained some understanding of the dependencies
captured in the seemingly non-intuitive structure. Overall, however, the lack of an
adequate explanation for the learnt structures, together with the unacceptable unde-
sirable re-classifications, meant that none of the learnt structures were considered for
inclusion in the implemented system.
11.3.5 Field trial evaluation
All components of the complete system were field-tested. The games were tri-
aled with individual students holding known misconceptions and their responses and
learning have been tracked [187]. This has refined the design of the games and of
the visual scaffolding and led to the decision to provide the feedback and visual
scaffolding automatically.
The complete system has also been field tested with 25 students in Grades 5 and
6, who had persistent misconceptions after normal school instruction [84, 105]. Stu-
dents worked with a partner (almost always with the same misconception) for up to
30 minutes, without adult intervention. The observer recorded their conversations,
which were linked to computer results and analyzed to see where students learned or
missed learning opportunities and how cognitive conflict was involved. Long term
conceptual change was measured by re-administering the DCT about three weeks
© 2004 by Chapman & Hall/CRC Press LLC

later. Students played in pairs so that the observer could, without intervention, mon-
itor their thinking as revealed by their conversations as they played the games.
Ten students tested as experts on the delayed post-test, indicating significant pro-
gress. Seven students demonstrated improvement while eight retained their original
misconception. There were some instances where students learned from the visual
scaffolding of the help screens, but active teacher intervention seems required for
most students to benefit fully from these. Very frequently, students learned by ob-
serving and discussing with their partners, but they did not always learn the same
things at the same time. This means that the computer diagnosis was not necessarily
meaningful for both students so that the item type selection may not perform as de-
signed for either student. This disadvantage needs to be weighed against the benefits
of working with a partner.
Feedback provided by the games provoked learning in two ways. In some in-
stances students added new information to their conceptual field, without addressing
misconceptions (e.g., learned that 0 in the tenths column makes a number small,
without really changing basic whole number thinking). In other instances the feed-
back provoked cognitive conflict and sometimes this was resolved within the session,
resulting in a significant change from a misconception to expertise, maintained at the
delayed post-test. The item type selection was set to alternate between “easy” and
“hard” items for these field trials but this experiment indicated that it gave too many
easy items. The real-time updated diagnosis by the system of the student’s thinking
patterns was (generally) consistent with the observer’s opinion. Discrepancies be-
tween classifications and the delayed post-test were tracked to known limitations of
the DCT, which could not diagnose an unusual misconception prevalent in that class.
On balance, our experts consider the ITS to be a useful supplement to class in-
struction.
11.3.6 KEBN aspects
The combination of elicitation and automated methods used in this case study was
only possible because we had both the involvement of experts with a detailed under-
standing of the basis of the misconceptions and how they relate to domain specific
activities and an extensive data set of student behavior on test items in the domain.
Building the student model from misconceptions (cf. [258, 98]), rather than in
terms of gaps in correct pieces of domain knowledge (cf. [50]), is a little unusual
and is only viable because of the nature of the domain and the extensive research on
student understanding in the domain discussed in
11.3.1.
This application is relatively complex in that the BN is used in several ways,
namely for diagnosis, prediction and value of information.
The automated techniques were able to yield networks which gave quantitative
results comparable to the results from the BN elicited from the experts. However,
the experts preferred to use the elicited BN in the implemented system, based on
their qualitative evaluation of the undesirable re-classifications.
The quantitative results do provide a form of ‘validation’ of the learning tech-
niques and suggests that automated methods can reduce the input required from do-
© 2004 by Chapman & Hall/CRC Press LLC

main experts. In any case, these results build confidence in the elicited BNs. It
also supports the reciprocal conclusion regarding the validity of manual construction
when there is enough expert knowledge but no available data set.
In addition, we have seen that the use of automated techniques can provide oppor-
tunities to explore the implications of modeling choices and to get a feel for design
tradeoffs — some examples of this were reported above in both the initial elicitation
stage and the discovery stage (e.g., 0-N vs. H/M/L).
The actual process of undertaking a quantitative evaluation was tedious, requiring
programming in the BN software API to run sets of experiments and collecting and
collating results. Much data massaging was required, with all the automated methods
requiring different input data formats and producing different output.
While the evaluation consisted of the standard set of case-based, comparative and
predictive evaluations, domain specific criteria (such as the division into desirable
and undesirable classification changes) were developed during the investigation pro-
cess and the experts refined their requirements.
The implemented system contains a mechanism for fully recording sessions (with
both user inputs and the BNs outputs), which could be invaluable for ongoing eval-
uation and maintenance of the system. However the system will be deployed via
the distribution of CD-ROM to interested math teachers, and there is no incentive or
mechanism for them to send this data back to us, the system developers.
11.4 Seabreeze prediction
In this case study we prototyped the use of Bayesian networks (BNs) for improved
weather prediction, applying them to the prediction of seabreezes [142]. This com-
paratively simple domain problem was chosen as a “proof of concept” for mete-
orological applications and taking advantage of weather monitoring set up for the
Sydney 2002 Olympics. In the study we compared an existing Bureau of Meteorol-
ogy (BOM) rule-based system developed by our domain experts to an expert elicited
BN and others learned by two data mining programs, TETRAD II [264] (
6.3.2) and
CaMML [294] (see
8.5). All of the Bayesian networks significantly outperformed
the rule-based system.
11.4.1 The seabreeze prediction problem
Seabreezes occur because of the unequal heating and cooling of neighboring sea
and land areas. From August through December cooler sea water temperatures are
predominant off the New South Wales coast, while solar radiation increases to its
maximum level. The contrast between sea and land surface temperatures peaks in
Adapted from [142]. With permission.
© 2004 by Chapman & Hall/CRC Press LLC
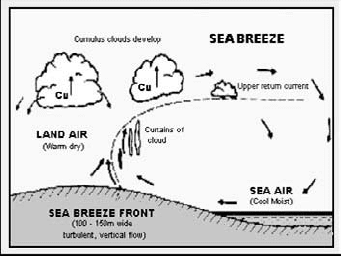
mid-afternoon. As warmed air rises over the land, a local circulation current be-
gins, drawing cool air in from the sea. The ascending warm air returns seaward (see
Figure 11.5), increasing the momentum of the cycle and spreading the effect over a
greater area.
FIGURE 11.5
Seabreeze development cycle.
If the wind currents are weak, a seabreeze will usually commence soon after the
land temperature exceeds that of the sea. The seabreeze will increase in strength and
reach farther inland as the temperature differential increases. Maximum wind speed
(14 to 16 knots) is usually reached several hours after the temperature has peaked.
A moderate to strong prevailing offshore wind will delay or, if greater than about
20 knots, prevent a sea breeze from developing [15]. A light to moderate prevailing
offshore wind at 900 metres (known as the gradient level) will reinforce seabreezes,
which can cause them to reach 30 knots around Sydney. The seabreeze process is
also affected by time of day, prevailing weather, seasonal changes and geography
[15, 114].
The pre-existing BOM seabreeze forecasting system was the simple rule-based
system of Figure 11.6. Its predictions are generated from wind forecasts produced
from large-scale weather pattern models. According to BOM, this rule-based system
correctly predicts a seabreeze approximately two-thirds of the time.
11.4.2 The data
The BOM provided us with 30MB of data from October 1997 to October 1999, with
about 7% of cases having missing attribute values. The data came from three types of
sensor sites in the Sydney area. Automatic Weather Stations (AWS) provided ground
level wind speed (ws) and direction (wd) at 30 minute intervals. Olympic sites pro-
vided ground level wind speed (ws), direction (wd), gust strength, temperature, dew
temperature and rainfall. Weather balloon data from Sydney airport (collected at
© 2004 by Chapman & Hall/CRC Press LLC

If wind component of forecast timeslice is offshore
and wind component is less than 23 knots
and part of the forecast timeslice falls in the afternoon,
then a seabreeze is likely to occur
FIGURE 11.6
Existing rule-based system pseudo code.
5am and 11pm daily) provided vertical readings for gradient-level wind speed (gws),
direction (gwd), temperature and rainfall. The variables of predictive interest are:
ground level wind speed and direction (ws, wd) and gradient level wind speed and
direction (gws, gwd), since a seabreeze is defined as occurring when and only when
the gradient wind direction is offshore and the ground level wind onshore.
11.4.3 Bayesian network modeling
Regardless of how the Bayesian models of seabreezes were constructed, whether
with causal discovery programs or by expert elicitation, we used Netica to param-
eterize them and to condition them for predictive testing. Netica learns parameters
by counting combinations of variable occurrences in the data, using Algorithm 7.1.
The number of cases available for the AWS and Olympic sites was large enough to
obtain precise parameter estimates, but the airport site data was fairly sparse, leading
to weaker predictive results.
11.4.3.1 Expert elicitation
The first technique we used for network construction was elicitation, using meteorol-
ogists at the BOM, leading to the causal model of Figure 11.7 (d). The links report
causal relationships between the wind to be predicted and the current wind, the time
of day and the month of the year.
11.4.3.2 Causal discovery
We applied both TETRAD II and CaMML (introduced, respectively, in Chapters 6
and 8) to the learning of seabreeze models, using all three data sets to find causal
structures before parameterizing them with Netica.
As a constraint-based learner, using the PC Algorithm 6.2, TETRAD II does not
always specify the direction of a link between nodes. However, it is possible to spec-
ify a temporal ordering of variables. Therefore, we generated two networks with
TETRAD II for each data set: the first directly from the data and the second includ-
ing the partial temporal ordering suggested by the expert elicited models. For the
AWS data, this resulted in the models of Figure 11.7 (b) and (c). Since CaMML
applies a Bayesian metric which aims at finding the highest posterior probability
causal model, with all arcs directed, we opted to supply no prior domain knowl-
© 2004 by Chapman & Hall/CRC Press LLC
edge to CaMML. For that reason we also decided to run TETRAD II without any
prior domain knowledge, so that we could obtain a legitimate experimental compari-
son of TETRAD II’s performance with that of CaMML. Comparison using identical
data sets was somewhat hampered by TETRAD II’s inability to accept raw data sets
greater than 32,000 cases. This limit was circumvented by generating the correlation
matrix from data sets and passing this to TETRAD II (which can operate either from
the raw data or from such a correlation matrix).
11.4.3.3 Comparison of TETRAD II and CaMML networks
Without the prior temporal information, TETRAD II produced networks which im-
plied some directed cycles. Whether or not using prior information, TETRAD II
networks left many arcs undirected. Therefore, we manually selected directions to
resolve the ambiguities and inconsistencies based on knowledge gained during the
expert elicitation stage. CaMML networks were often identical those discovered by
TETRAD II models (after manual repair), but also they often differed by having
more arcs than those of TETRAD II.
The Bayesian networks generated for the airport variables are shown in Figure 11.7.
The machine learned networks are fairly similar, although MML tends to find more
causal connections than TETRAD II (a result consistent with [65]). The expert net-
work is notably different, discounting any influence of current wind speed and direc-
tion measurements.
11.4.4 Experimental evaluation
Here we consider the performance of the different tools in the sea breeze prediction
task. First, we compare the BNs with the existing rule-based predictor provided by
BOM, and then we compare the different BNs against each other in a variety of
ways. The basic result is that the Bayesian networks as a class clearly outperform
the rule-based system, while they were effectively indistinguishable from each other,
whether they were generated by elicitation or by either causal discovery program.
These results held whether the performance metric used was predictive accuracy or
information reward. Here we report the results for predictive accuracy only; further
details can be found in [143].
11.4.4.1 Test methods
Most of the results reported here used repeated 80-20 splits of data from 1997 and
1998, with 80% of the data applied for training and 20% for testing. The data splits
were done randomly 15 times and confidence intervals computed; in general, differ-
ences in accuracy of more than 10% were found to be statistically significant at the
0.05 level, which is some indication that the differences are real.
© 2004 by Chapman & Hall/CRC Press LLC