Korb K.B., Nicholson A.E. Bayesian Artificial Intelligence
Подождите немного. Документ загружается.

S
R
S
T
M
O
O
t−1
R
T
t t+2t+1
UUU
U
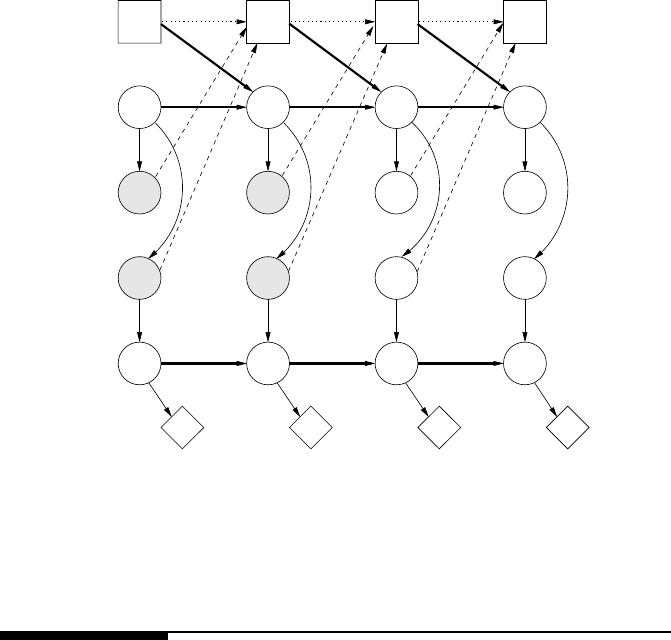
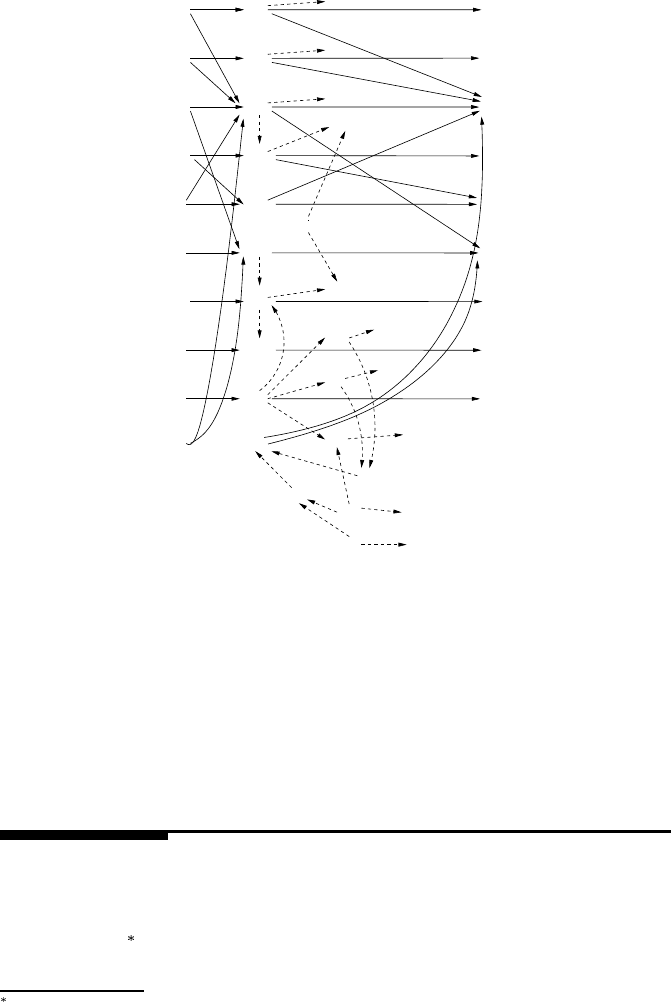
FIGURE 4.16
A dynamic decision network for the mobile robot example. (From Dean, T. and
Wellman, M.P. Planning and Control. Morgan Kauffman Publishers, San Mateo,
CA. 1991. With permission.)
4.8 Bibliographic notes
Influence diagrams were originally developed as a compact representation of deci-
sion trees for decision analysis. The basic concepts were developed by a group at
SRI [191], and were formally introduced by Howard and Matheson [115].
Jensen in his recent text [128] gives a detailed presentation of one method for
evaluation decision network, and summarizes other approaches. The term “DBN”
was first coined by Dean and Kanazawa [69]; other early DBN research in the AI
community was undertaken by Nicholson [206] and Kjærulff [147].
The chapter by Kevin Murphy on DBNs for Michael Jordan’s forthcoming text
book, An Introduction to Probabilistic Graphical Models, gives a very comprehen-
sive survey of DBNs, their connections to hidden Markov models (HMMs) and state
space models, and exact and approximate inference algorithms (including filtering
approaches). Kjaerulff [149] describes the dHugin computation scheme for DBN
inference, which includes window expansion and reduction, forward and back inter-
junction tree propagation and forward sampling for probabilistic projection.
© 2004 by CRC Press, LLC
© 2004 by Chapman & Hall/CRC Press LLC

4.9 Problems
Utility
Problem 1
You have 20 pounds of cheese. We offer to make a gamble with you: tossing a fair
coin, if it comes up heads, we’ll give you 130 more pounds of cheese; if it comes up
tails, we’ll take your 20 pounds of cheese. What is the expected value of the gamble?
Assuming that you maximize your expected utility and that you refuse this gamble,
what can you infer about your utility function — that is, how many utiles (basic units
of your utility) is a pound of cheese worth?
Problem 2
You have 20 utiles worth of chocolate. We offer to make a gamble with you: tossing
some coin, if it comes up heads, we’ll give you 130 more utiles worth of chocolate;
if it comes up tails, we’ll take your 20 utiles worth of chocolate. Assuming that you
maximize your expected utility and that you refuse this gamble, what can you infer
about the probability you give to the coin landing heads?
Modeling
Problem 3
Robert is trying to decide whether to study hard for the Bayesian Artificial Intelli-
gence exam. He would be happy with a good mark (e.g., a High Distinction) for the
subject, but he knows that his mark will depend not only on how hard he studies but
also on how hard the exam is and how well he did in the Introduction to Artificial
Intelligence subject (which indicates how well prepared he is for the subject).
Build a decision network to model this problem, using the following steps.
Decide what chance nodes are required and what values they should take.
This problem should only require a single decision node; what will it repre-
sent?
Decide what the casual relationships are between the chance nodes and add
directed arcs to reflect them.
Decide what chance nodes Robert’s decision may effect and add arcs to reflect
that.
What is Robert’s utility function? What chance nodes (if any) will it depend
on? Does it depend on the decision node? Will a single utility node be suffi-
cient? Update the decision network to reflect these modeling decisions.
Quantify the relationships in the network through adding numbers for the
CPTs (of chance nodes) and the utility table for the utility node. Does the
number of parameters required seem particularly large? If so, consider how
you might reduce the number of parameters.
© 2004 by CRC Press, LLC
© 2004 by Chapman & Hall/CRC Press LLC

Once you have built your model, show the beliefs for the chance nodes and the
expected utilities for the decisions before any evidence is added.
Add evidence and see how the beliefs and the decision change, if at all.
If you had an information link between the evidence node and the decision
node, view the decision table.
Perform your own decision tree evaluation for this problem and confirm the
numbers you have obtained from the software.
Problem 4
Think of your own decision making problem involving reasoning with evidence and
uncertainty. Write down a text description of the problem, then model it with a
decision network using similar steps to the previous problem. Make the problem
sufficiently complex that your network has at least 3 chance nodes (though a single
decision node and a single utility node will be enough for a first modeling effort,
unless you feel particularly adventurous).
Problem 5
Julia’s manufacturing company has to decide whether to go ahead with the produc-
tion of a new product. Her analysis indicates that the future profit will depend on
a combination of the quality of the product and the market demand for it. Before
the final decision is made, she has two other possible courses of action. One is to
undertake further product development, to make the product quality better before it
goes into production. The other is to do more market research to determine the likely
demand. She could also choose to do both. Of course both product development and
market research will cost money. And she has to be careful about delaying too long,
as she knows that the first product of this kind that becomes available will corner the
market.
Build a decision network to model this sequential decision problem.
1. Decide what chance nodes, decision nodes (hint: there should be three) and
utility node(s) you need.
2. Add the main network links, then the information and precedence links. Note
that you need to investigate two possible orderings for the pre-production de-
cisions.
3. The problem description does not provide much in the way of quantitative
information for parameterizing your model; so choose initial parameters that
seem reasonable.
4. What is the expected benefit of additional marketing? And of further product
development?
© 2004 by Chapman & Hall/CRC Press LLC
Dynamic Bayesian networks (DBNs)
Problem 6
Peter wants to do simple monitoring of his local weather. Suppose that the main
weather types are: sunny, cloudy, showers, rain and snow. He knows that the weather
changes from one day to the next in certain patterns, depending on the season. He
also has access to the local weather forecast for the following day, and he has been
monitoring this for long enough to know that the local forecasters get it right about
70% of the time (though slightly worse for cloudy and showery days).
Build a DBN to model this problem. You should use a BN software package that
specifically supports DBNs (e.g., Netica, Hugin; see Appendix B).
Dynamic decision networks (DDNs)
Problem 7
Cate brought some shares for
$
1000. Each day, she has to decide whether to sell, or
keep them. Her profit will depend on the price she gets for them. Each morning, she
gets the previous day’s closing price, and she rings her sister Megan and gets her
opinion as to whether the price will go up or down today. She also knows that most
of the time, the price of these shares only move within a certain range from one day
to the next.
Build a dynamic decision network to model this problem.
© 2004 by Chapman & Hall/CRC Press LLC

5
Applications of Bayesian Networks
5.1 Introduction
In the previous three chapters, we have seen in detail how Bayesian and decision
networks can be used to represent and reason with uncertainty. We have used simple
illustrative examples throughout, which, together with some of the modeling prob-
lems set as exercises, give some indication of the type and scope of the problems to
which Bayesian networks may be applied. In this chapter we provide more detailed
examples of some BN applications which we have personally developed. By moving
beyond elementary examples we can provide a better insight into what is involved
in designing and implementing Bayesian models and the range of applications for
which they can be useful.
We begin with a very brief survey of BN applications developed by others, es-
pecially medical applications, in order to show some of the variety of uses and BN
models which are to be found in the literature. We then describe three of our own
applications:
1. The first is a game playing application, specifically poker, a domain that is
rich in uncertainty from a number of sources: physical randomization through
shuffling, incomplete information through the opponent’s hidden cards and
limited knowledge about the opponent’s strategies. In this application, the
BN is used to compute the probability of winning, with a decision network
combined with randomization strategies in a hybrid system to make betting
decisions.
2. The second application is ambulation monitoring and fall detection, which
illustrates the use of DBNs in medical monitoring and also includes typical
sensor modeling within a Bayesian network.
3. Finally, we look at an argument generation application, where BNs for both
normative domain modeling and user modeling are embedded in a wider archi-
tecture integrating the BNs with semantic networks and an attention focusing
mechanism.
© 2004 by Chapman & Hall/CRC Press LLC

5.2 A brief survey of BN applications
5.2.1 Types of reasoning
As we discussed in Chapter 2, a key reasoning task using BNs is that of updating the
posterior distribution of one or more variables, given evidence. Depending on what
evidence is available, the probabilistic belief updating can be performing one of a
number of tasks.
1. Diagnosis.Example:Which illness do these symptoms indicate?
2. Monitoring/control.Example:Is the patient’s glucose level stable, or does
extra insulin need to be given?
3. Forward prediction.
Such predictions may be factual (that is, based on evidence) or hypothetical
(such as predicting the effect of an intervention). For example, when consid-
ering the question Will the patient survive the proposed operation? a factual
prediction might be
Based on the results of the X-ray, MRI and blood tests, will the
patient survive the proposed operation?
An example hypothetical prediction might be
If the patient is given anticoagulant X, will the patient’s chances of
survival be improved?
As we saw in the previous chapter, once we extend the network with decision
and utility nodes, we can use it for decision making and planning. Examples include
Which treatment plan carries the least risk of failure? and Which sequence of actions
will maximize the patient’s quality of life?
5.2.2 BN structures for medical problems
Medicine has undoubtedly been the most popular application area to date for Bayes-
ian networks. As a complex domain where much knowledge is implicitly held by
experienced medical practitioners, it has long been a target of expert systems. A
connection between BN research and medical applications was established in the
1980s by researchers such as David Heckerman and Eric Horvitz who were in the
Stanford Ph.D./M.D. program. The appeal of BNs for this application area lies in
their ability to explicitly model causal interventions, to reason both diagnostically
and predictively and the visual nature of the representation, which facilitates their
use in explanation.
We have already looked at some simple medical reasoning examples in the pre-
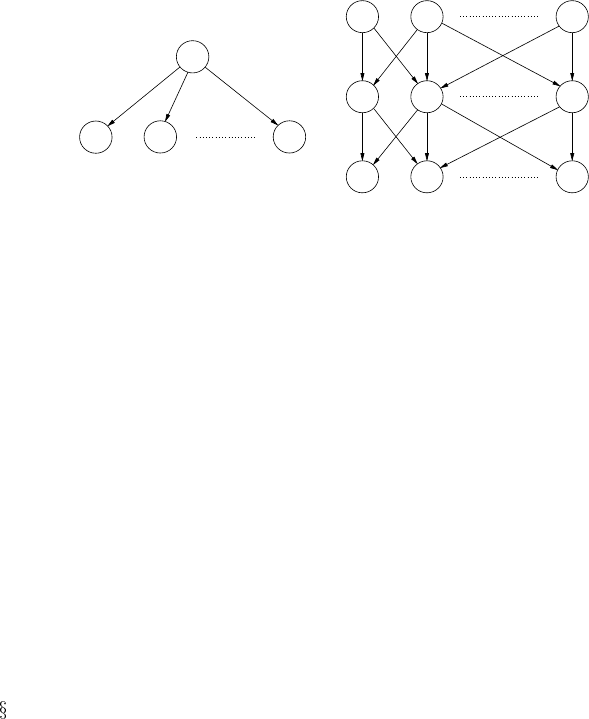
ceding chapters. The simplest tree-structured network for diagnostic reasoning is the
so-called naive Bayes model, as shown in Figure 5.1(a), where Disease (D) node
© 2004 by Chapman & Hall/CRC Press LLC
(b)
(a)
(a)
F1 F2
F3
D
F1 F2
D2
D1
B1 B2 Bk
Dm
Fn
FIGURE 5.1
Generic BN structures for medical diagnosis: (a) naive Bayes model; (b) multiply-
connected network.
has values for each of the diseases under consideration, while the F nodes represent
“findings,” which encompass both symptoms and test results. This network reflects
two unrealistic assumptions: that the patient can have only a single disease and that
the symptoms are independent of each other given the disease.
A more realistic, but more complex, model is the multiply-connected network of
Figure 5.1(b). Here there is a Boolean node for each disease under consideration,
while the B nodes represent background information such as the age and sex of the
patient, whether they are a smoker, or have been exposed to pollution. However, in
practice, this structure is likely to be too complex, requiring us to specify probabilis-
tically the combined effect of every disease on each finding.
The network structure in Figure 5.1(b) is essentially that developed in the QMR-
DT project [256, 190], a probabilistic version of the frame-based CPCS knowledge
base for internal medicine. The QMR-DT network had this two-level structure. The
problem of complexity was ameliorated by making it a binary noisy-or model (see
7.4.2). This was done by assuming the effect of a disease on its symptoms and
test results is independent of other diseases and independent of other findings. One
version of the QMR-DT network (described in [222]) had 448 nodes and 908 arcs,
including 74 background nodes (which they called “predisposing factors”) needing
prior probabilities, while the remaining nodes required probabilities to be assessed
for each of their values. In total more than 600 probabilities were estimated, a large
but not an unreasonable number given the scope of the application. Performing ex-
act inference on networks of this size is generally not feasible. Initial work on the
application of likelihood weighting to this medical diagnosis problem is described in
[255], while other approximate methods for QMR-DT are presented in [121].
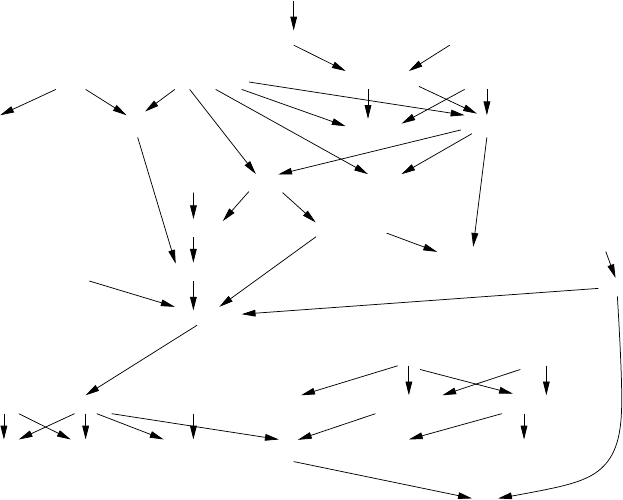
The ALARM network for monitoring patients in intensive care [17], shown in
Figure 5.2, is a sparsely connected BN consisting of 37 nodes and 42 arcs (the num-
ber of values for each node is shown next to the node name). This network is often
used as a benchmark in the BN literature. Clearly, it does not map neatly into the
generic medical diagnosis structure given above, and it does not provide a template
for building other medical monitoring or diagnostic BNs.
© 2004 by Chapman & Hall/CRC Press LLC
Ventmach (4)
VentTube (4)
Disconnect (2)
Press (4) VentLung (4)
Intubation (3)PulmEmbolus(2)
PAP (3) Shunt (2)
MinVol (4)VentAlv (4)FiO2 (2)
PVSat (3)
SaO2 (3)
ArtCO2 (3)
ExpCO2 (4)
Catechol (2)
StrokeVolume (3) LVEDVolume (3)
PCPW (3)CVP (3)CO (3)HRBP (3)
BP
(3)
InsuffAnesth (2)
TPR (3)
Anaphylaxis (2)
KinkedTube (4)
MinVolSet (3)
LVFailure (2) Hypovolemia (2)
ErrCauter (2) HR (3) ErrLowOutput (2) History (2)
HRSat (3)
HREKG (3)
FIGURE 5.2
The ALARM BN for ICU monitoring.
5.2.3 Other medical applications
PATHFINDER is a diagnostic expert system for lymph-node diseases, with PATH-
FINDER IV containing a BN component [102]; it has been converted into a commer-
cially available decision support system for surgical pathologists, INTELLIPATH.
The ODIN research group at Aalborg University, Denmark, has been involved with
the development of several medical applications. MUNIN [9] is a multiply connected
BN of about 1000 nodes for diagnosing neuromuscular disorders. Dynamic BN med-
ical applications include one for glucose prediction and insulin dose adjustment [8]
and one for sleep apnea [64]. Van der Gaag and her group have worked on a BN for
diagnosing oesophageal cancer [281]. BNs have also been used for mammography
[37] and diagnosing liver disorder [212]. Finally, the PROMEDAS medical decision
support tool [223] uses Bayesian networks, automatically compiling both the net-
work and an interface from the underlying medical database (which currently covers
the areas of endocrinology and lymphoma diagnostics).
© 2004 by Chapman & Hall/CRC Press LLC
AMCINInScen
CapInScen
PlainsFcst
LowLapse
RHRatio
WindAloft
MeanRH
CurPropConv
WindFieldPln
ScenRel3_4
h 234StarFcst
(3)
(3)
(2)
(4)
(3)
CompPlFcst
CapChange
(4)
WndHodograph
CombClouds
VISCloudCov
CombMoisture
(4)
(4)
(3)
(3)
(3)
MorningBound
(3)
RaoContMoist
SubjVertMo
CombVerMo
(4)
IRCCloudCov
(3)
(4)
AMInstabMt
CldShadeOth
(3)
InsInMt
MountainFcst
LowLevMoistAd
InsChange
CldShadeConv
InsSclInScen
(3)
OutflowFrMt
Scenario
(3)
(4)
(5)
ScnRelPlFcst
(11)
(4)
TempDis
(6)
Dewpoints
(7)
ScenRelAMIns
AmDewptCalPl
LIfr12ZDENSd
(4)
(4)
LatestCIN
(4)
LLIW
(4)
AMInsWliScen
(3)
(3)
SynopticForcing
(5)
(7)
SfcWndShfDis
(6)
ScenRelAMCIN
(4)
MidLLapse
MorningCIN
(3)
(2)
WindFieldMts
MvmtFeatures
(4)
h_10_7muVerM
(3)
AreaMoDryAir
(4)
(4)
SatContMoist
(4)
QGVertMotion
(4)
AreaMeso_ALS
(3)
(4)
(3)
Boundaries
(3)
(3)
(4)
(3)
R5Fcst
(3)
(3)
(3)
(6)
Date
(11)
(3)
(3)
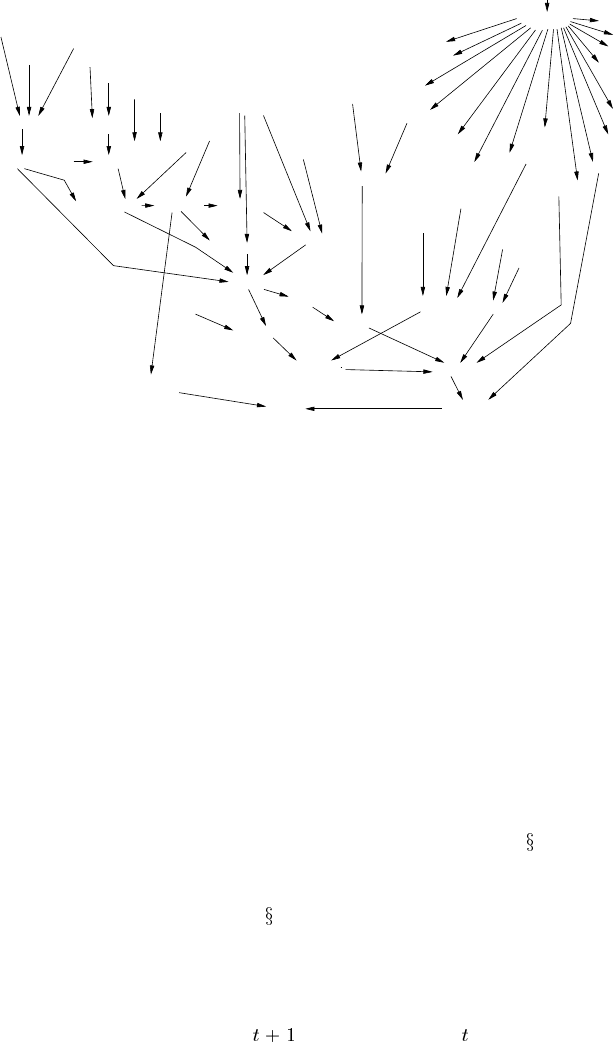
FIGURE 5.3
The Hailfinder BN.
5.2.4 Non-medical applications
Hailfinder is a well-known system for forecasting severe summer hail in northeastern
Colorado [2]. The BN is shown in Figure 5.3. Again, the number of values for each
node is shown next to the node name in parentheses. The GEMS (Generator Expert
Monitoring System) [195] project is an example of a system where BNs succeeded
when a rule-based system did not [162].
Vista [111] is a decision-theoretic system used at NASA Mission Control Center
in Houston. It uses Bayesian networks to interpret live telemetry and provide advice
on possible failures of the space shuttle’s propulsion systems. Vista recommends
actions of the highest expected utility, taking into account time criticality.
BNs have been used in a number of user modeling applications: software users
in the Lumiere system [112], players in an adventure game [4] and various student
models in intelligent tutoring systems [50, 49, 108, ?, ?](seealso
11.3).
Oil price forecasting is an application that has been modeled with an ordinary BN
[3] and with a DBN [63]. Other early DBN applications included robot navigation
and map learning [70] (see also
4.6.1), monitoring robot vehicles [207, 208] and
traffic monitoring in both [225] and the BATmobile project for monitoring an au-
tomated vehicle traveling on a freeway [85]. A fragment of the BATmobile DBN
is shown in Figure 5.4. The number of values for each node is shown in parenthe-
ses, the inter-slice arcs are shown in thicker solid lines, while the intra-slice arcs are
thinner. The intraslice arcs for
are the same as for and hence omitted. The
observation nodes are shaded.
© 2004 by Chapman & Hall/CRC Press LLC
LC
RC
LA
XD
IL
FA
YD
ST
ES
FB
LC
RC
LA
XD
IL
FA
YD
ST
ES
FB
lcs
rcs
ts
yds
sv
fyd
fcs
xds
fcl
bxs
fcs
fys
byd
bcl
bcf
bcs
bys
LC
RC
LA
XD
IL
FA
YD
ST
ES
FB
(2)
(2)
(3)
(2)
(3)
(7)
(3)
(11)
(2)
(2)
(2)
(2)
(3)
(7)
(2)
(11)
(3)
(4)
(8)
(20)
(2)
(8)
(8)
(4)
(3)
(2)
(20)
(
8
)
TS2TS1TS0
bxd
FIGURE 5.4
The BATmobile BN.
BNs have been used for biological applications such as modeling the biological
processes of a water purification plant [131] and for deciding on the amount of fungi-
cides to be used against attack of mildew in wheat [126]. More recently there has
been much interest in using BNs for ecological applications [80, 163, 26, 183, 13].
5.3 Bayesian poker
We will now describe the application of Bayesian networks to a card game, five-
card stud poker
. Poker is an ideal vehicle for testing automated reasoning under
We have worked on this application occasionally since 1993. The version described here is an improved
version of that presented in [160], with some structural changes and the use of utilities to make the betting
decision. Details of the system evolution and evaluation are in Chapter 9, as an example of the knowledge
engineering process.
© 2004 by Chapman & Hall/CRC Press LLC