Jones D.S.J., Pujado P.R. Handbook of Petroleum Processing
Подождите немного. Документ загружается.

160 CHAPTER 3
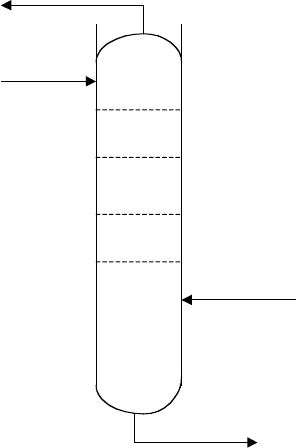
Strip out & Steam to Main Tower
Un stripped HGO
From MainTower
Four Stripping Trays
Steam
Stripped HGO Product
Heat In:
HGO Tray Draw off (Un Stripped HGO)
Steam
Heat Out:-
HGO Product
Strip Out
Steam.
Figure 3.20. Heat balance diagram over HGO stripper.
Temperature of LGO leaving its stripper = 488
◦
F.
Temperature of Kero leaving its stripper = 359
◦
F.
Overall tower heat balance
Tower overhead heat balances
Balance included by envelop 1 determines the overhead condenser duty. See Ta-
ble 3.1.9.
The overhead condenser is 71.360, therefore the heat removed by intermediate refluxes
(pumparound) is 115.717 − 71.360 = 44.357 mmBtu/hr.
THE ATMOSPHERIC AND VACUUM CRUDE DISTILLATION UNITS 161
Steam
HGO
28980
Residuum
LGO
1838
3150
3413
KERO
Naphtha
&
Water
Crude Feed
Figure 3.21. Overall tower heat balance diagram.
The heat balance included in envelope 2 determines the internal reflux from the top
tray.
This is as follows:
Let x be the lbs/hr of overflow from the top tray. Then the heat balance is as follows
(see also Table 3.10):
Solving for x =
12,879,000
121
= 106,438 lbs/hr
= 821 moles/hr or 16,736 GPH.
162 CHAPTER 3
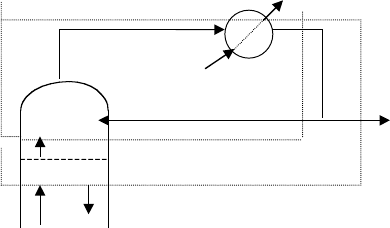
Condenser Duty
1
Reflux Product
R + P +S +Water
11
X + P
Heat In
Reflux + Product Vapor
Steam
Heat Out
Reflux Liquid
Product Liquid
Water
Condenser Duty
Envelope
11:-
Envelope
1:-
Heat In
Internal Reflux X Vapor
Product Vapor
Steam
Heat Out
Internal Reflux X Liquid
Product Liquid
Water
Condenser Duty.
X
Figure 3.22. Tower overhead heat balance diagram.
Check for fractionation: (using Figure 1.A.2 in the appendix)
Overflow @ 60
◦
F = 16,736 GPH
Overflow @ 255
◦
= 19,029 GPH
Prod vapor to top tray = 13,125 GPH
Reflux ratio = 1.45
Number of trays = 12
Factor is 12 × 1.45 = 17.4
50% TBP difference between Naphtha and Kero is 420 − 265 = 155
◦
F.
ASTM Gap is 30
◦
F which is within Spec.

THE ATMOSPHERIC AND VACUUM CRUDE DISTILLATION UNITS 163
Table 3.9a.
Stream V/L
◦
API K
◦
F lbs/hr Btu/lb mmBtu/hr
IN
Crude V + L – 11.7 720 379,575 175.939
Steam V 37,381 1,290 48.221
Total in 416,956 224.160
OUT
Residue L 13 11.5 704 197,085 378 74.498
HGO L 30 11.5 615 26,754 336 8.989
LGO L 36.3 11.5 488 44,226 255 11.278
Kero L 45.5 12 359 34,860 184 6.414
Naphtha L 70.0 12 100 37,381 100 3.738
Refluxes 115.717
Total out 416,956 224.160
Table 3.9b.
Stream V/L
◦
API K
◦
F lbs/hr Btu/lb mmBtu/hr
IN
Naphtha V 70 12 246 76,650 266 20.389
Reflux V 70 12 246 61,230 266 16.311
Steam V 246 37,381 1,197 44.745
Total in 175,351 81.445
OUT
Naphtha L 70 12 100 76,650 46 3.526
Reflux L 70 12 100 61,320 46 2.821
Water L 100 37,381 100 3.738
Cond duty 71.360
Total Out 175,351 81.445
Table 3.10.
Stream V/L
◦
API K
◦
F lbs/hr Btu/lb mmBtu/hr
IN
Naphtha V 70 12 262 76,650 273 20.925
O/Flow V 53 12 262 x 249 249x
Steam V 262 37,381 1,199 44.82
Total In 114, 031 + x 65.745 + 249x
OUT
Naphtha L 70 12 100 76,650 46 3.526
O/Flow L 53 12 255 x 128 128x
Water L 100 37,381 100 3.738
Cond duty 71.360
Total Out 114.031 + x 78.624 + 128x
164 CHAPTER 3
1
I
4
5
45
34
24
22
12
II
III
10
Steam
Residue
KERO
LGO
HGO
x
1
x
2
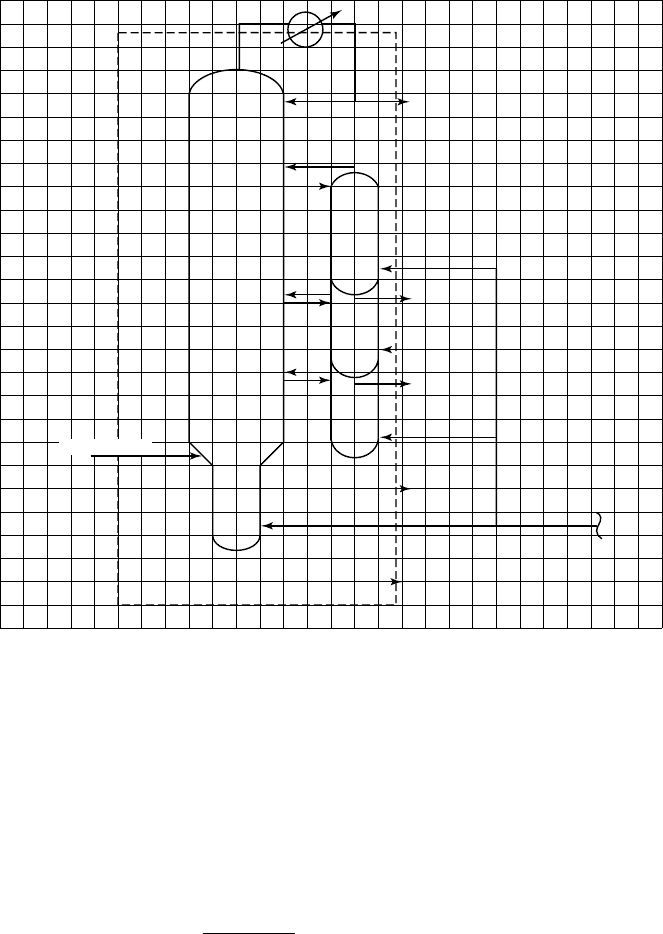
Figure 3.23. Remaining heat balance diagram for tower loading.

THE ATMOSPHERIC AND VACUUM CRUDE DISTILLATION UNITS 165
Calculating the remaining tower loadings
The tower loadings at the remaining critical sections of the tower are provided by heat
balances over the envelopes given in the heat balance diagram (Figure 3.23). These
critical sections are:
r
Below bottom pumparound draw off (envelop 1)
r
Below top pumparound draw off (envelop 2)
r
Below Kero draw off (envelop 3)
Only the heat balance over envelop 3 is given in Table 3.11. The others follow in
a similar fashion but the summaries of the calculated loads are given for all three
sections (see Table 3.12).
Solving for x
3
=
2,391,000
111
= 21,540 lbs/hr.
Checking fractionation:
Between HGO and LGO
Reflux ratio =
22,809
24,675
= 0.92
Number of trays = 11 (2 PA trays = 1 Frac tray).
Factor = 10.2
50% TBP = 300
◦
F
ASTM gap is +31
◦
F which is well within the requirement for these two cuts.
Between LGO and Kero
Reflux ratio = 0.21
Number of trays = 11 (includes credit for PA trays.)
Factor = 2.3
50%TBP = 185
◦
F
ASTM gap =−10
◦
F
This is poor but as the kero cut is to be used as a blend stock it will be accepted . In
the final design, however, provision will be made to increase the overhead reflux at
the expense of the bottom pumparound to improve this separation.

166 CHAPTER 3
Table 3.11. Heat balance over envelop 3
Stream V/L
◦
API K
◦
F lbs/hr Btu/lb mmBtu/hr
ENV 3
IN
Heat in crude V+L − 379,575 175.939
Steam V 450 33,968 1,290 43.819
Tray34 o/flow L 46.3 12 367 x3 191 191x3
Total in 413,543 + x 3 219,758 + x3
OUT
O/flow to tray34 V 46.3 12 370 x3 302 302x3
Vapor to tray 34 V 62.5 12 370 111,510 320 35.683
Steam to tray 34 V 370 33,968 1,253* 42.562
LGO prod L 36.3 11.5 488 44,226 255 11.278
HGO prod L 30 11.5 615 26,754 336 8.989
Residue L 13 11.5 704 197,085 378 74.498
Top PA 26.614
Bot PA 17.743
Total out 413,543 + x3 217.367 + 302x3
∗
Steam at the partial pressure of 18.3 psia.
Table 3.12. Summary of the main tower loading
Liquid – From tray Vapor – To Tray
Draw-off tray Lbs/hr GPH Hot GPH Lbs/hr Moles wt Moles/hr
Tray 10 * @627
◦
F @ 632
◦
F
Hydrocarbons 174,648 23,990 32,760 357,138 181 1,976.9
Steam – – – 28,980 18 1,610.0
Total 174,648 23,990 32,760 386,118 107.6 3,586.9
Tray 22 * @ 498
◦
F @500
◦
F
Hydrocarbons 122,412 17,487 22,809 278,148 154 1,802.9
Steam – 30,818 18 1,027.3
Total 122,412 17,487 22,809 308,966 109 2,830.2
Tray 34 @367
◦
F @370
◦
F
Hydrocarbons 21,540 3,254 3,925 133,050 115 1,157.8
Steam 33,968 18 1,887.1
Total 21,540 3,254 3,925 167,018 55 3,044.9
Tray 45 @ 255
◦
F @ 262
◦
F
Hydrocarbons 106,438 16,735 19,029 183,089 112.6 1,626.1
Steam 37,381 18 2,076.7
Total 106,438 16,735 19,029 220,469 59.5 3,702.8
∗
Does not include pumparound liquid stream.

THE ATMOSPHERIC AND VACUUM CRUDE DISTILLATION UNITS 167
Tower diameter calculations
The calculation for tower vapor flood capacity is given by the expression
G
f
= K
r
√
ρ
v
× (ρ
l
− ρ
v
)
G
f
= Mass velocity of vapor at flood in lbs/hr · sqft of bubble area.
K
r
= 1,100 for a 24
tray spacing
The largest diameter will always be below the bottom pumparound in terms of the
vapor load. For a quick estimate let the bubble area be 80% of the total tower dia-
meter.
Below bottom pumparound loading
Assume bottom pumparound returns to tower at 300
◦
F.
Total PA duty = 17,740,000 Btu/hr
Enthalpy at 627
◦
F = 347 Btu/lb
Enthalpy at 300
◦
F = 140 Btu/lb
The lbs/hr of the PA stream is
17,740,000
207
= 85,715lbs/hr or 11,774 GPH
GPH of unstripped HGO product = 3,668
GPH of overflow = 23,990
Total liquid flow on the tray = 39,632 GPH @ 60
◦
F
The loading data on this tray is as follows:
Vapor Liquid
Temperature
◦
F 632 627
Pressure psig 23.8 –
Moles /hr 3,586.9 GPH hot 54,120
lbs/hr 386,118 lbs/hr 288,522
ACFS 302 2.0
ρ
v
lbs/cuft 0.355 lbs/cuft 39.9
Gf = 1,100
√
0.355 × (39.9 − 0.355)
= 4,121 lbs/hr · sqft.
Ga = 4,121 × 0.8 = 3,297 lbs/hr sqft
Tray area required to handle vapor =
386,118
3,297
= 117 sqft
this may be considered as the bubble area.
168 CHAPTER 3
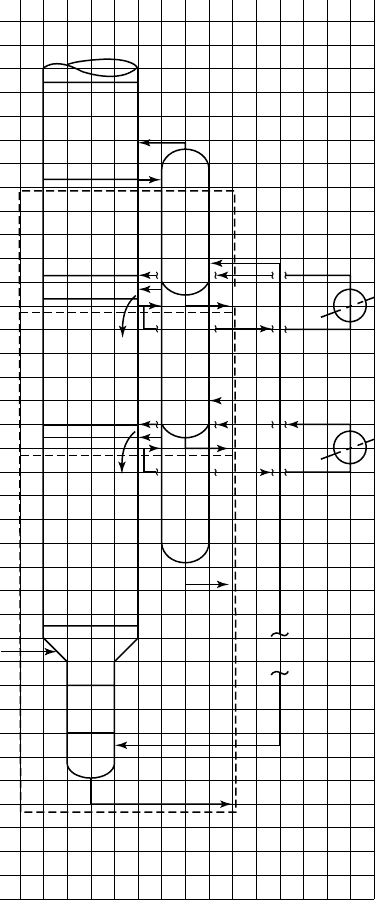
20
5
5
20
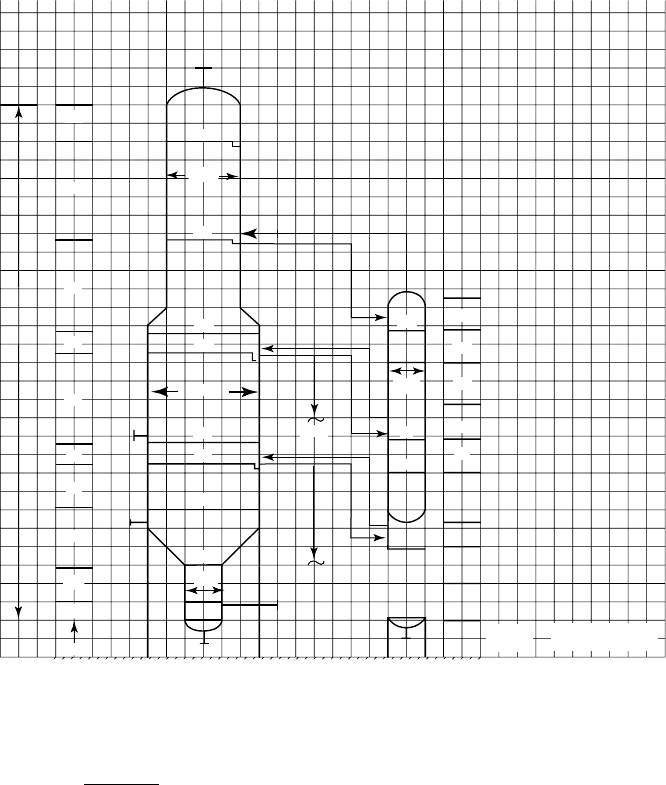
10′
12′
8′0
14′0 *
15′0
7′′/D
4
5
10
12
TPA
22
24
122′
7 to 9
13′′/D
B PA
4
1
1
4
4
4′′/D
1
6
8
10
6
8
10
6
8
10
15′
To
Grade
* 5 Min Surge
to NLL.
6′
22
45
10′′/D
34
Figure 3.24. Main tower and side stream tower diagram.
Let d’comer area be such that liquid flow is 0.6 ft/sec. Area required is
2.0ACFS
0.6
= 3 sqft
For two (inlet + outlet)A
dc
= 6 sqft.
Waste area is taken as 20% of A
b
= 117 × .2 = 23.4 sqft.
Then A
s
= 117 + 23.4 + 6 = 146 sqft.
Tower diameter at this location is 13.6 ft.i/d.
Other sections of the tower
THE ATMOSPHERIC AND VACUUM CRUDE DISTILLATION UNITS 169
The other sections of the tower where there may be changes in diameter are below
the top pumparound draw off, and of course the bottoms stripper top tray. The tower
top tray should also be checked for loading.
The same calculation is followed for these other sections but it is not proposed to
show them here. The results of the calculations though gave the following:
Top section of the main tower above tray 24 diameter is 10 ft i/d
Bottoms stripper section below tray 4 diameter will be 7 ft i/d.
A diagram of the main tower and the associated stripper tower is shown in Fig-
ure 3.1.24.
3.2 The vacuum crude distillation unit
As an introduction to this part of the chapter, it will be of interest to outline briefly an
important development that occurred in this process during the early 1960s. Originally
vacuum units followed closely on design to the atmospheric unit except of course it
operated under a vacuum condition. The vacuum was obtained by a two or three stage
steam ejectors and the internals of the tower were traditional trays, mostly bubble
cap type. Under these conditions the vacuum obtained in the flash zone required
the injection of steam to provide the required hydrocarbon partial pressure for adequate
vaporization of the fuel oil feed. With the molecular weight of steam low at 18 the
tower vapor traffic was extremely high in velocity requiring a large tower diameter to
accommodate it.
The break-through to provide vacuum towers of much lower diameters came in the ’60s
with the use of high capacity steam injectors producing very low vacuum condition in
the tower overhead. This coupled with the development of highly efficient expanded
grid internals with very low pressure drop allowed the desired flash zone conditions
to be met with out the injection of steam. This process became known as the ‘Dry
Vac’ process and is the accepted process now for vacuum crude distillation. Such a
process is describes below.
Process description
This process is often integrated with the Atmospheric Crude Distillation unit as far as
heat transfer is concerned. Generally the atmospheric residue from the CDU is routed
hot to the fired heater of the vacuum unit (Figure 3.25).
The atmospheric residue is further distilled to provide the heavy distillate streams used
for producing lube oil or as feed to conversion units. This distillation however has to