Jacques I. Mathematics for Economics and Business
Подождите немного. Документ загружается.


original (which can be thought of as 100% of the $78) plus the increase (which is 9% of $78).
The final price is therefore
100% + 9% = 109% (of the $78)
which is the same as
= 1.09
In other words, in order to calculate the final price all we have to do is to multiply by the scale
factor, 1.09. Hence the new price is
1.09 × 78 = $85.02
One advantage of this approach is that it is then just as easy to go backwards and work out
the original price from the new price. To go backwards in time we simply divide by the scale
factor. For example, if the final price of a good is $1068.20 then before a 9% increase the price
would have been
1068.20 ÷ 1.09 = $980
In general, if the percentage rise is r% then the final value consists of the original (100%)
together with the increase (r%), giving a total of
+=1 +
To go forwards in time we multiply by this scale factor, whereas to go backwards we divide.
r
100
r
100
100
100
109
100
Mathematics of Finance
180
Example
(a) If the annual rate of inflation is 4%, find the price of a good at the end of a year if its price at the
beginning of the year is $25.
(b) The cost of a good is $799 including 17.5% VAT (value added tax). What is the cost excluding VAT?
(c) Express the rise from 950 to 1007 as a percentage.
Solution
(a) The scale factor is
1 +=1.04
We are trying to find the price after the increase, so we multiply to get
25 × 1.04 = $26
(b) The scale factor is
1 += 1.175
This time we are trying to find the price before the increase, so we divide by the scale factor to get
799 ÷ 1.175 = $680
17.5
100
4
100
MFE_C03a.qxd 16/12/2005 11:02 Page 180

(c) The scale factor is
==1.06
which can be thought of as
1 +
so the rise is 6%.
6
100
1007
950
new value
old value
3.1 • Percentages
181
Example
(a) The value of a car depreciates by 25% in a year. What will a car, currently priced at $43 000, be worth
in a year’s time?
(b) After a 15% reduction in a sale, the price of a good is $39.95. What was the price before the sale began?
(c) The number of passengers using a rail link fell from 190 205 to 174 989. Find the percentage decrease.
Solution
(a) The scale factor is
1 −=0.75
25
100
It is possible to use scale factors to solve problems involving percentage decreases. To be
specific, suppose that an investment of $76 falls by 20%. The new value is the original (100%)
less the decrease (20%), so is 80% of the original. The scale factor is therefore 0.8, giving a new
value of
0.8 × 76 = $60.80
In general, the scale factor for an r% decrease is
−=1 −
Once again, you multiply by this scale factor when going forwards in time and divide when
going backwards.
r
100
r
100
100
100
Practice Problem
3 (a) The value of a good rises by 13% in a year. If it was worth $6.5 million at the beginning of the
year, find its value at the end of the year.
(b) The GNP of a country has increased by 63% over the past 5 years and is now $124 billion. What
was the GNP 5 years ago?
(c) Sales rise from 115 000 to 123 050 in a year. Find the annual percentage rise.
MFE_C03a.qxd 16/12/2005 11:02 Page 181
so the new price is
43 000 × 0.75 = $32 250
(b) The scale factor is
1 −=0.85
so the original price was
39.95 ÷ 0.85 = $47
(c) The scale factor is
==0.92
which can be thought of as
1 −
so the fall is 8%.
8
100
174 989
190 205
new value
old value
15
100
Mathematics of Finance
182
Practice Problem
4
(a) Current monthly output from a factory is 25 000. In a recession, this is expected to fall by 65%.
Estimate the new level of output.
(b) As a result of a modernization programme, a firm is able to reduce the size of its workforce by
24%. If it now employs 570 workers, how many people did it employ before restructuring?
(c) Shares originally worth $10.50 fall in a stock market crash to $2.10. Find the percentage decrease.
The final application of scale factors that we consider is to the calculation of overall
percentage changes. It is often the case that over various periods of time the price of a good is
subject to several individual percentage changes. It is useful to be able to replace these by an
equivalent single percentage change spanning the entire period. This can be done by simply
multiplying together successive scale factors.
Example
(a) Share prices rise by 32% during the first half of the year and rise by a further 10% during the second
half. What is the overall percentage change?
(b) Find the overall percentage change in the price of a good if it rises by 5% in a year but is then reduced
by 30% in a sale.
MFE_C03a.qxd 16/12/2005 11:02 Page 182
Solution
(a) To find the value of shares at the end of the first 6 months we would multiply by
1 +=1.32
and at the end of the year we would multiply again by the scale factor
1 +=1.1
The net effect is to multiply by their product
1.32 × 1.1 = 1.452
which can be thought of as
1 +
so the overall change is 45.2%.
Notice that this is not the same as
32% + 10% = 42%
This is because during the second half of the year we not only get a 10% rise in the original value, but
we also get a 10% rise on the gain accrued during the first 6 months.
(b) The individual scale factors are 1.05 and 0.7, so the overall scale factor is
1.05 × 0.7 = 0.735
The fact that this is less than 1 indicates that the overall change is a decrease. Writing
0.735 = 1 − 0.265 = 1 −
we see that this scale factor represents a 26.5% decrease.
26.5
100
45.2
100
10
100
32
100
3.1 • Percentages
183
Practice Problem
5 Find the single percentage increase or decrease equivalent to
(a) an increase of 30% followed by an increase of 40%
(b) a decrease of 30% followed by a decrease of 40%
(c) an increase of 10% followed by a decrease of 50%.
We conclude this section by describing two applications of percentages in macroeconomics:
index numbers
inflation.
We consider each of these in turn.
MFE_C03a.qxd 16/12/2005 11:02 Page 183

3.1.1 Index numbers
Economic data often take the form of a time series; values of economic indicators are available
on an annual, quarterly or monthly basis, and we are interested in analysing the rise and fall of
these numbers over time. Index numbers enable us to identify trends and relationships in the data.
The following example shows you how to calculate index numbers and how to interpret them.
Mathematics of Finance
184
Example
Table 3.1 shows the values of household spending (in billions of dollars) during a 5-year period. Calculate
the index numbers when 2000 is taken as the base year and give a brief interpretation.
Solution
When finding index numbers, a base year is chosen and the value of 100 is allocated to that year. In this
example, we are told to take 2000 as the base year, so the index number of 2000 is 100. To find the index
number of the year 2001 we work out the scale factor associated with the change in household spending
from the base year, 2000 to 2001, and then multiply the answer by 100.
In this case, we get
× 100 = 103.8
This shows that the value of household spending in 2001 was 103.8% of its value in 2000. In other words,
household spending increased by 3.8% during 2001.
For the year 2002, the value of household spending was 716.6, giving an index number
× 100 = 102.8
This shows that the value of household spending in 2002 was 102.8% of its value in 2000. In other words,
household spending increased by 2.8% between 2000 and 2002. Notice that this is less than that calculated
for 2001, reflecting the fact that spending actually fell slightly during 2002. The remaining two index num-
bers are calculated in a similar way and are shown in Table 3.2.
716.6
697.2
723.7
697.2
index number = scale factor from base year × 100
Table 3.1
Year
1999 2000 2001 2002 2003
Household spending 686.9 697.2 723.7 716.6 734.5
Table 3.2
Year
1999 2000 2001 2002 2003
Household spending 686.9 697.2 723.7 716.6 734.5
Index number 98.5 100 103.8 102.8 105.3
MFE_C03a.qxd 16/12/2005 11:02 Page 184

Index numbers themselves have no units. They merely express the value of some quantity as
a percentage of a base number. This is particularly useful, since it enables us to compare how
values of quantities, of varying magnitudes, change in relation to each other. The following
example shows the rise and fall of two share prices during an 8-month period. The prices (in
dollars) listed for each share are taken on the last day of each month. Share A is exceptionally
cheap. Investors often include this type of share in their portfolio, since they can occasionally
make spectacular gains. This was the case with many dot.com shares at the end of the 1990s.
The second share is more expensive and corresponds to a larger, more established firm.
3.1 • Percentages
185
Practice Problem
6 Calculate the index numbers for the data shown in Table 3.1, this time taking 1999 as the base year.
Example
Find the index numbers of each share price shown in Table 3.3, taking April as the base month. Hence
compare the performances of these two share prices during this period.
Table 3.3
Month Jan Feb Mar Apr May Jun Jul Aug
Share A 0.31 0.28 0.31 0.34 0.40 0.39 0.45 0.52
Share B 6.34 6.40 6.45 6.52 6.57 6.43 6.65 7.00
Table 3.4
Month Jan Feb Mar Apr May Jun Jul Aug
Index of share price A (April
==
100) 91.2 82.3 91.2 100 117.6 114.7 132.4 152.9
Index of share price B (April
==
100) 97.2 98.2 98.9 100 100.8 98.6 102.0 107.4
Solution
The index numbers have been listed in Table 3.4. Notice that both shares are given the same index number
of 100 in April, which is the base month. This is despite the fact that the values of the two shares are very
different. This creates ‘a level playing-field’, enabling us to monitor the relative performance of the two
shares. The index numbers show quite clearly that share A has outperformed share B during this period.
Indeed, if an investor had spent $1000 on shares of type A in January, they could have bought 3225 of them,
which would be worth $1677 in August, making a profit of $677. The corresponding profit for share B is
only $99.
MFE_C03a.qxd 16/12/2005 11:02 Page 185

The table shows that the base quarter is the first quarter of 2005 because the index number is
100 in 05Q1. It is, of course, easy to find the percentage change from this quarter to any sub-
sequent quarter. For example, the index number associated with the third quarter of 2005 is
110.2, so we know immediately that the percentage change in output from 05Q1 to 05Q3 is
10.2%. However, it is not immediately obvious what the percentage change is from, say, 04Q2
to 05Q2. To work this out, notice that the index number has increased by
106.3 − 98.1 = 8.2
so the percentage increase is
× 100 = 8.4%
Alternatively, note that the scale factor of this change is
= 1.084
which corresponds to an 8.4% increase.
Similarly, the scale factor of the change from 04Q3 to 05Q1 is
= 0.952
This is less than 1, reflecting the fact that output has fallen. To find the percentage change we
write the scale factor as
1 − 0.048
which shows that the percentage decrease is 4.8%.
100
105
106.3
98.1
8.2
98.1
Mathematics of Finance
186
Incidentally, if the only information you have about the time series is the set of index
numbers, then it is possible to work out the percentage changes between any pair of values.
Table 3.5 shows the index numbers of the output of a particular firm for the years 2004
and 2005.
Table 3.5
Output
04Q1 04Q2 04Q3 04Q4 05Q1 05Q2 05Q3 05Q4
Index 89.3 98.1 105.0 99.3 100 106.3 110.2 105.7
Practice Problem
7 Use the index numbers listed in Table 3.5 to find the percentage change in output from
(a) 05Q1 to 05Q4
(b) 04Q1 to 05Q4
(c) 04Q1 to 05Q1
MFE_C03a.qxd 16/12/2005 11:02 Page 186

3.1 • Percentages
187
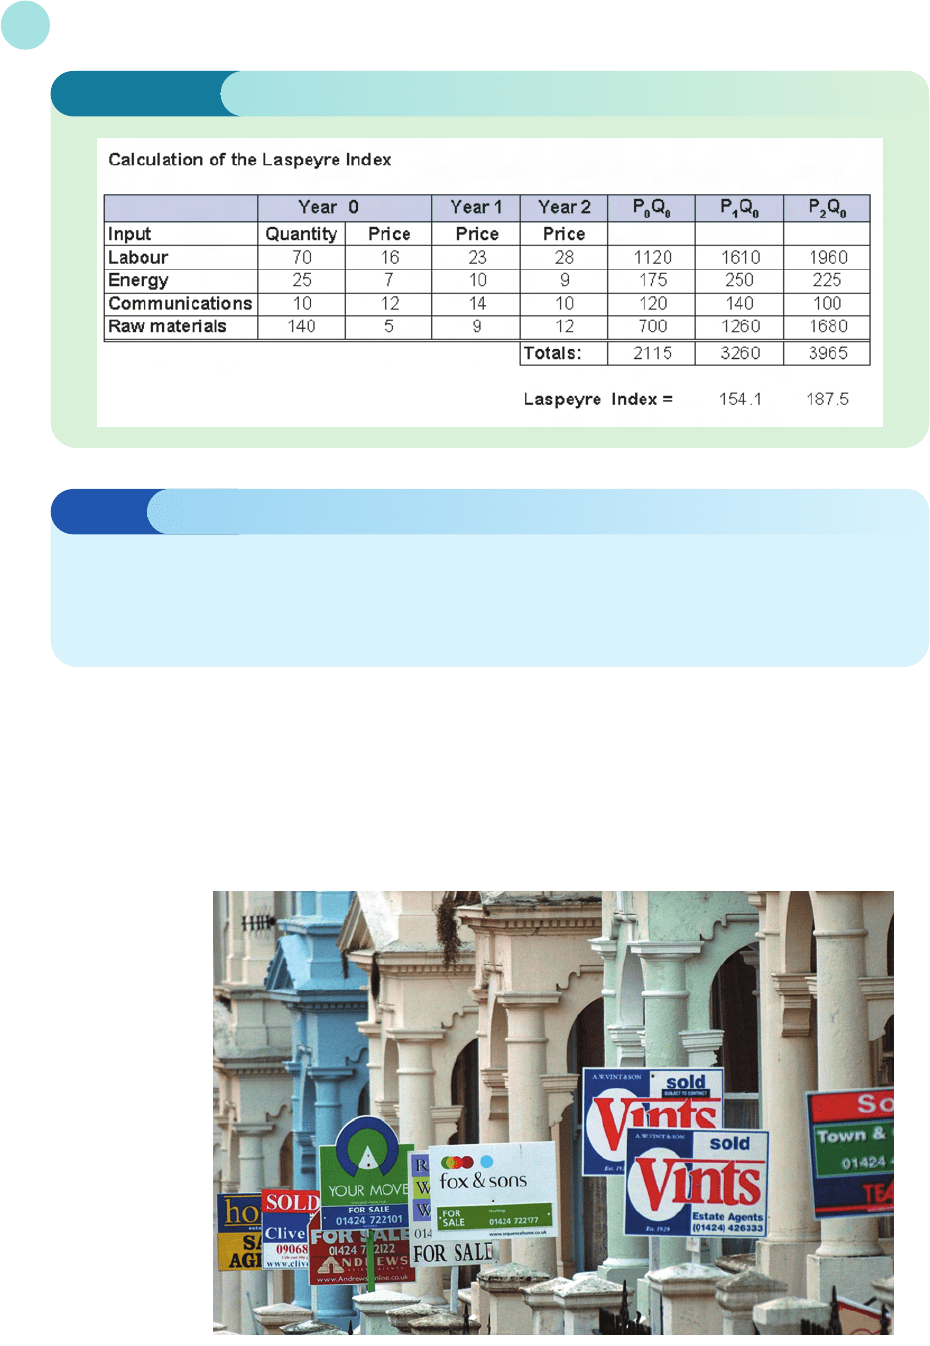
Example
Table 3.6 shows the unit costs of labour, energy, communications and raw materials during a 3-year
period. In year 0, a firm used 70 units of labour, 25 units of energy, 10 units of communication and 140
units of raw materials. Taking year 0 as the base year, calculate an appropriate index number for years 1
and 2.
EXCEL
Table 3.6
Year 0 Year 1 Year 2
Labour 16 23 28
Energy 710 9
Communications 12 14 10
Raw materials 5912
Solution
We are told to take year 0 as the base year, so the index number for year 0 is 100. One way of calculating
the index number for subsequent years would be to work out the totals of each column in Table 3.6
and find the associated scale factors of these. On this basis, the index number for year 1 would be cal-
culated as
× 100 = 140
However, this fails to take into account the fact, for example, that we use twice as many units of raw
materals than labour. It is important that each item is weighted according to how many units of each type
are used. To do this, all we have to do is to multiply each of the unit costs by the associated quantities. The
appropriate index number is then worked out as
× 100 = 154.1
The fact that this number is greater than before is to be expected because the unit price of raw materials has
nearly doubled, and the firm uses a greater proportion of these in its total costs. Index numbers that are
weighted according to the quantity consumed in the base year are called Laspeyre indices. Spreadsheets
provide an easy way of presenting the calculations. For each year, we simply include an extra column in the
table, for the products P
n
Q
0
where Q
0
denotes the quantities used in the base year, and P
n
denotes the unit
prices in year n. The Laspeyre index for year n is then worked out as
× 100
Figure 3.1 (overleaf) shows the completed spreadsheet. The Laspeyre indices for years 1 and 2 are seen to
be 154.1 and 187.5, respectively. Notice that this index has increased rapidly over this period, in spite of the
fact that communication and energy costs have hardly changed. This is because expenditure is dominated
by labour and raw material costs, which have both increased substantially during this time.
total of column P
n
Q
0
total of column P
0
Q
0
23 × 70 + 10 × 25 + 14 × 10 + 9 × 140
16 × 70 + 7 × 25 + 12 × 10 + 5 × 140
23 + 10 + 14 + 9
16 + 7 + 12 + 5
MFE_C03a.qxd 16/12/2005 11:02 Page 187
3.1.2 Inflation
Over a period of time, the prices of many goods and services usually increase. The annual rate
of inflation is the average percentage change in a given selection of these goods and services,
over the previous year. Seasonal variations are taken into account, and the particular basket
of goods and services is changed periodically to reflect changing patterns of household
Mathematics of Finance
188
Advice
There are other methods for assessing the variation of a ‘basket’ of values over time. Index
numbers that are weighted according to the quantity consumed in the current year
(instead of the base year) are called
Paasche indices. An example of this is given in Practice
Problem 22 at the end of this section.
Figure 3.1
MFE_C03a.qxd 16/12/2005 11:02 Page 188

Solution
The raw figures shown in Table 3.7 give the impression that houses increased steadily in value throughout
this period, with a quite substantial gain during the first year. However, if inflation had been very high then
the gain in real terms would have been quite small. Indeed, if the rate of inflation were to exceed the per-
centage rise of this nominal data, then the price of a house would actually fall in real terms. To analyse this
situation we will use Table 3.8, which shows the rates of inflation during this period. Notice that since the
house prices listed in Table 3.8 are quoted at the end of each year, we are not interested in the rate of
inflation during 1990.
We are told in the question to choose 1991 as the base year and calculate the value of the house at ‘1991
prices’. The value of the house at the end of 1991 is obviously $89 000, since no adjustment need be made.
At the end of 1992, the house is worth $93 000. However, during that year inflation was 7.1%. To adjust this
price to ‘1991 prices’ we simply divide by the scale factor 1.071, since we are going backwards in time. We get
= 86 835
93 000
1.071
3.1 • Percentages
189
Example
Table 3.7 shows the price (in thousands of dollars) of an average house in a certain town during a 5-year
period. The price quoted is the value of the house at the end of each year. Use the annual rates of inflation
given in Table 3.8 to adjust the prices to those prevailing at the end of 1991. Compare the rise in both the
nominal and real values of house prices during this period.
Table 3.7
Year
1990 1991 1992 1993 1994
Average house price 72 89 93 100 106
Table 3.8
Year
1991 1992 1993 1994
Annual rate of inflation 10.7% 7.1% 3.5% 2.3%
expenditure. The presence of inflation is particularly irritating when trying to interpret a time
series that involves a monetary value. It is inevitable that this will be influenced by inflation
during any year, and what is of interest is the fluctuation of a time series ‘over and above’ inflation.
Economists deal with this by distinguishing between nominal and real data. Nominal data are
the original, raw data such as those listed in tables in the previous sub-section. These are based
on the prices that prevailed at the time. Real data are the values that have been adjusted to take
inflation into account. The standard way of doing this is to pick a year and then convert the
values for all other years to the level that they would have had in this base year. This may sound
rather complicated, but the idea and calculations involved are really quite simple as the fol-
lowing example demonstrates.
MFE_C03a.qxd 16/12/2005 11:02 Page 189