Jacques I. Mathematics for Economics and Business
Подождите немного. Документ загружается.

Non-linear Equations
170
Advice
The following example shows how to find such a formula from data points. This is an
important skill. However, it is not crucial to your understanding of subsequent material in
this book. You may wish to miss this out on first reading and move straight on to the
Practice Problems at the end of this chapter.
Example
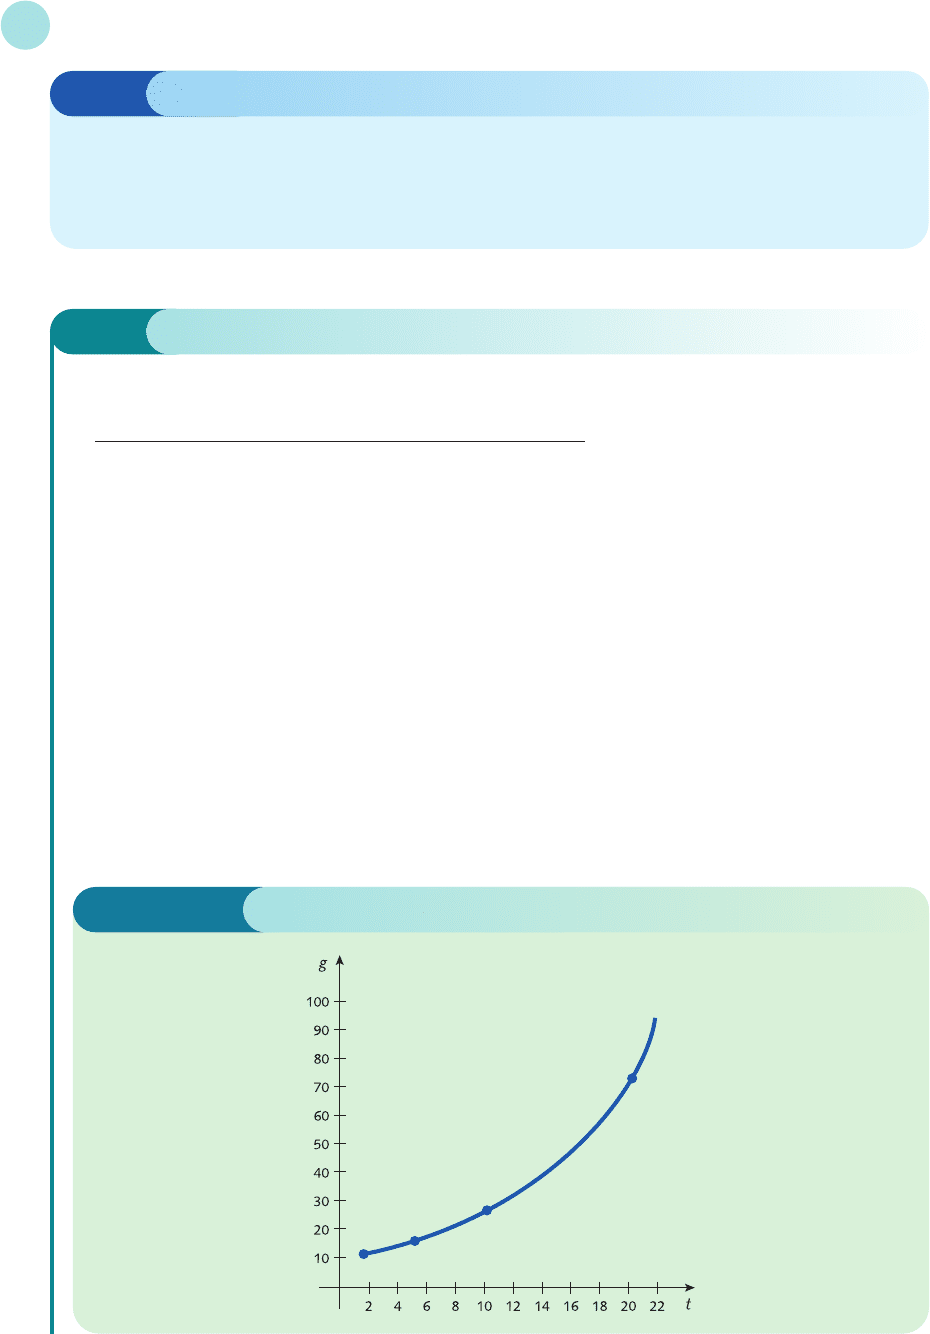
The values of GNP, g, measured in billions of dollars, over a period of t years was observed to be
t (years) 2 5 10 20
g (billions of dollars) 12 16 27 74
Model the growth of GNP using a formula of the form
g = Be
At
for appropriate values of A and B. Hence estimate the value of GNP after 15 years.
Solution
Figure 2.17 shows the four points plotted with g on the vertical axis and t on the horizontal axis. The basic
shape of the curve joining these points certainly suggests that an exponential function is likely to provide a
reasonable model, but it gives no information about what values to use for the parameters A and B.
However, since one of the unknown parameters, A, occurs as a power in the relation
g = Be
At
it is a good idea to take natural logs of both sides to get
ln g = ln(Be
At
)
Figure 2.17
MFE_C02d.qxd 16/12/2005 11:01 Page 170
The rules of logs enable us to expand the right-hand side to get
ln (Be
At
) = ln B + ln(e
At
) (rule 1)
= ln B + At (definition of a log to base e)
Hence
ln g = At + ln B
Although this does not look like it at first sight, this relation is actually the equation of a straight line! To see
this recall that the usual equation of a line is y = ax + b. The log equation is indeed of this form if we put
y = ln g and x = t
The equation then becomes
y = Ax + ln B
so a graph of ln g plotted on the vertical axis with t plotted on the horizontal axis should produce a straight
line with slope A and with an intercept on the vertical axis of ln B.
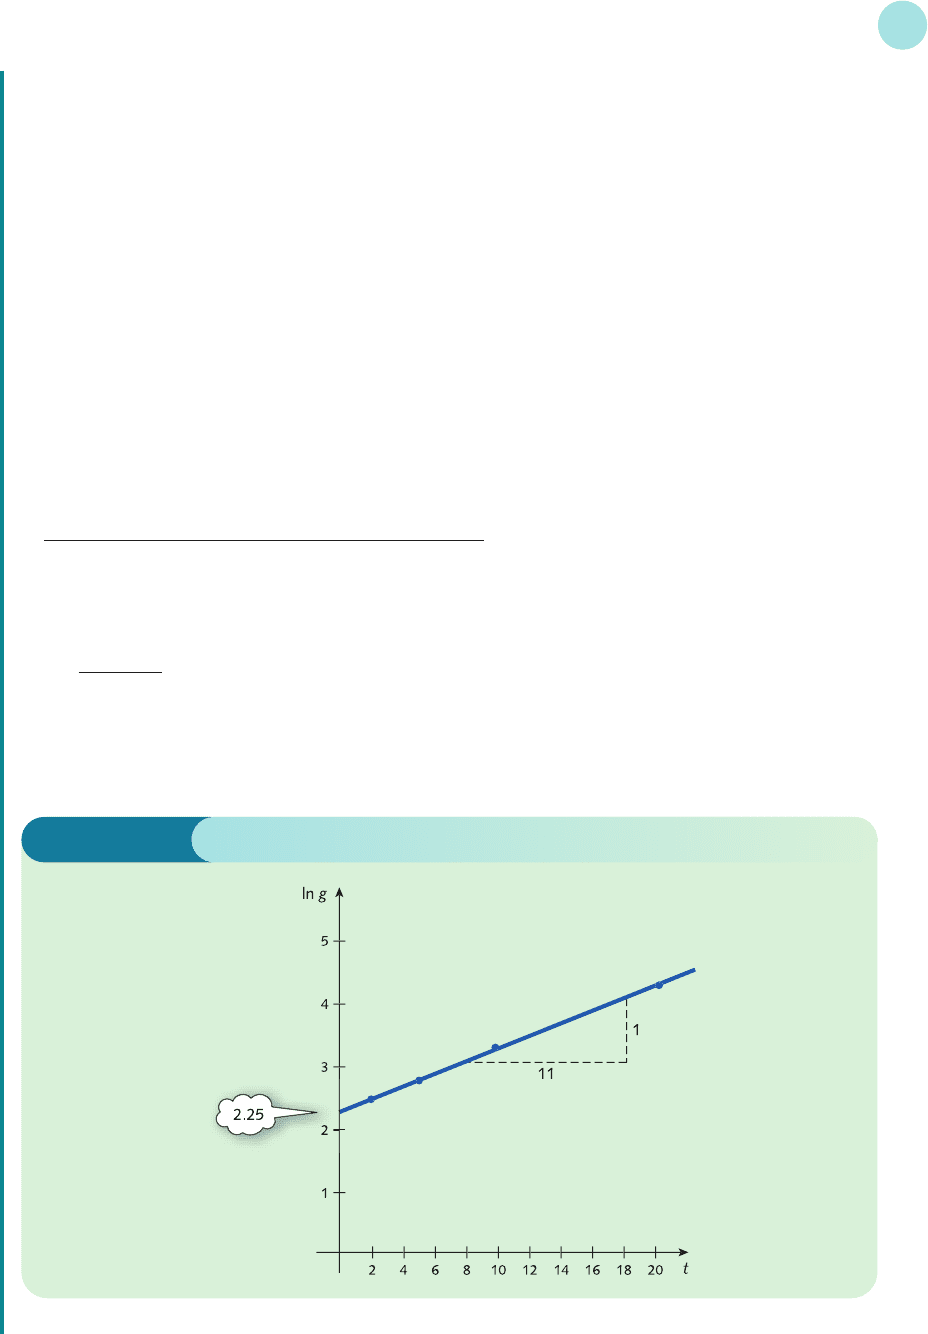
Figure 2.18 shows this graph based on the table of values
x = t 251020
y = ln g 2.48 2.77 3.30 4.30
As one might expect, the points do not exactly lie on a straight line, since the formula is only a model.
However, the line sketched in Figure 2.18 is a remarkably good fit. The slope can be calculated as
A ==0.09
and the vertical intercept can be read off the graph as 2.25. This is ln B and so
B = e
2.25
= 9.49
4 − 3
18.6 − 7.6
2.4 • The exponential and natural logarithm functions
171
Figure 2.18
MFE_C02d.qxd 16/12/2005 11:01 Page 171

Hence the formula for the approximate relation between g and t is
g = 9.49e
0.09t
Finally, an estimate of the GNP after 15 years can be obtained by substituting t
=
15 into this formula to get
g = 36.6 (billion dollars)
Non-linear Equations
172
Practice Problem
6 Immediately after the launch of a new product, the monthly sales figures (in thousands) are as follows:
t (months) 13612
s (sales) 1.8 2.7 5.0 16.5
(1) Complete the following table of values of ln s
t 13612
ln s 0.59 1.61
(2) Plot these points on graph paper with the values of ln s on the vertical axis and t on the horizontal
axis. Draw a straight line passing close to these points. Write down the value of the vertical inter-
cept and calculate the slope.
(3) Use your answers to part (2) to estimate the values of A and B in the relation s = Be
At
.
(4) Use the exponential model derived in part (3) to estimate the sales when
(a) t = 9 (b) t = 60
Which of these estimates would you expect to be the more reliable? Give a reason for your answer.
The exponential function The function, f(x) = e
x
; an exponential function in which the
base is number, e = 2.718 28...
Natural logarithm A logarithm to base, e; if M = e
n
then n is the natural logarithm of M
and we write, n = ln M
Key Terms
Practice Problems
7 The number of items, N, produced each day by an assembly-line worker, t days after an initial train-
ing period, is modelled by
N = 100 − 100e
−0.4t
(1) Calculate the number of items produced daily
(a) 1 day after the training period
(b) 2 days after the training period
(c) 10 days after the training period
MFE_C02d.qxd 16/12/2005 11:01 Page 172

(2) What is the worker’s daily production in the long run?
(3) Sketch a graph of N against t and explain why the general shape might have been expected.
8 Use the rules of logs to expand each of the following:
(a)
ln xy (b) ln xy
4
(c) ln(xy)
2
(d) ln (e) ln (f) ln
9 Use the rules of logs to express each of the following as a single logarithm:
(a)
ln x + 2 ln x (b) 4 ln x − 3 ln y + 5 ln z
10 Solve each of the following equations. (Round your answer to 2 decimal places.)
(a)
e
x
= 5.9 (b) e
x
= 0.45 (c) e
x
=−2
(d) e
3x
= 13.68 (e) e
−5x
= 0.34 (f) 4e
2x
= 7.98
11 The value of a second-hand car reduces exponentially with age, so that its value $y after t years can
be modelled by the formula
y = Ae
−ax
If the car was $50 000 when new and was worth $38 000 after 2 years, find the values of A and a,
correct to 3 decimal places.
Use this model to predict the value of the car
(a) when the car is 5 years old
(b) in the long run
12 A team of financial advisers guiding the launch of a national newspaper has modelled the future
circulation of the newspaper by the equation
N = c(1 − e
−kt
)
where N is the daily circulation after t days of publication, and c and k are positive constants.
Transpose this formula to show that
t = ln
When the paper is launched, audits show that
c = 700 000 and k = ln 2
(a) Calculate the daily circulation after 30 days of publication.
(b) After how many days will the daily circulation first reach 525 000?
(c) What advice can you give the newspaper proprietor if it is known that the paper will break even
only if the daily circulation exceeds 750 000?
13 A Cobb–Douglas production function is given by
Q = 3L
1/2
K
1/3
By taking logs of both sides of this equation, show that
ln Q = ln 3 + ln L + ln K
If a graph were to be sketched of ln Q against ln K (for varying values of Q and K but with L fixed),
explain briefly why the graph will be a straight line and state its slope and vertical intercept.
1
3
1
2
1
30
D
F
c
c − N
A
C
1
k
xy
3
z
x
y
x
5
y
7
2.4 • The exponential and natural logarithm functions
173
MFE_C02d.qxd 16/12/2005 11:01 Page 173

14 The following table gives data relating a firm’s output, Q and labour, L.
L 12345
Q 0.50 0.63 0.72 0.80 0.85
The firm’s short-run production function is believed to be of the form
Q = AL
n
(a) Show that
ln Q = n ln L + ln A
(b) Using the data supplied, copy and complete the following table:
ln L 0.69 1.39
ln Q −0.69 −0.33 −0.16
Plot these points with ln L on the horizontal axis and ln Q on the vertical axis. Draw a straight
line passing as close as possible to all five points.
(c) By finding the slope and vertical intercept of the line sketched in part (b), estimate the values of
the parameters n and A.
15 (Excel) Tabulate values of the following functions for x = 0, 0.2, 0.4, ..., 2. Hence sketch graphs of
these functions, on the same diagram, over the range 0 ≤ x ≤ 2. Discuss, in qualitative terms, any dif-
ferences or similarities between these functions.
(a)
y = x (b) y = x
2
(c) y = x
3
(d) y =√x (e) y = e
x
[In Excel, e
x
is typed EXP(x)]
16
(Excel) Tabulate values of the functions ln x, log
10
x and log
6
x for x = 0.2, 0.4, 0.6, 0.8, 1.0, 2, 3, 4,
..., 8. Hence sketch graphs of these functions on the same diagram, over the range 0.2 ≤ x ≤ 8.
Briefly comment on any similarities and differences between them.
[In Excel, natural logs and logs to base 10 are typed as LN(x) and LOG(x) respectively. In general,
to find the logarithm of a number x to base n, type LOG(x, n)]
17
(Excel) The demand function of a good can be modelled approximately by
P = 100 − Q
n
(a) Show that if this relation is exact then a graph of ln(150 − 1.5P) against ln Q will be a straight
line passing through the origin with slope n.
(b) For the data given below, tabulate the values of ln(150 − 1.5P) and ln Q. Find the line of best fit
and hence estimate the value of n correct to 1 decimal place.
Q 10 50 60 100 200 400
P 95 85 80 70 50 20
2
3
Non-linear Equations
174
MFE_C02d.qxd 16/12/2005 11:01 Page 174

chapter 3
Mathematics of Finance
This chapter provides an understanding of the way in which financial calculations are
worked out. There are four sections, which should be read in the order that they
appear.
Section 3.1 revises work on percentages. In particular, a quick method of dealing
with percentage increase and decrease calculations is described. This enables an
overall percentage change to be deduced easily from a sequence of individual
changes. Percentages are used to calculate and interpret index numbers, and to
adjust value data for inflation.
Section 3.2 shows how to calculate the future value of a lump sum which is invested
to earn interest. This interest can be added to the investment annually, semi-annu-
ally, quarterly or even more frequently. The exponential function is used to solve
problems in which interest is compounded continuously.
A wide variety of applications are considered in Sections 3.3 and 3.4. In Section 3.3
a mathematical device known as a geometric progression, which is used to calculate
the future value of a savings plan and the monthly repayments of a loan, is intro-
duced. Section 3.4 describes the opposite problem of calculating the present value
given a future value. The process of working backwards is called discounting. It can
be used to decide how much money to invest today in order to achieve a specific
target sum in a few years’ time. Discounting can be used to appraise different invest-
ment projects. On the macroeconomic level, the relationship between interest rates
and speculative demand for money is investigated.
The material in this chapter will be of greatest benefit to students on business stud-
ies and accountancy courses. This chapter could be omitted without affecting your
understanding of the rest of this book.
MFE_C03a.qxd 16/12/2005 11:02 Page 175

MFE_C03a.qxd 16/12/2005 11:02 Page 176

section 3.1
Percentages
In order to be able to handle financial calculations, it is necessary to use percentages profici-
ently. The word ‘percentage’ literally means ‘per cent’, i.e. per hundredth, so that whenever we
speak of r% of something, we simply mean the fraction (r/100)ths of it.
Objectives
At the end of this section you should be able to:
Understand what a percentage is.
Solve problems involving a percentage increase or decrease.
Write down scale factors associated with percentage changes.
Work out overall percentage changes.
Calculate and interpret index numbers.
Adjust value data for inflation.
Advice
The first part of this section provides a leisurely revision of the idea of a percentage as
well as reminding you about how to use scale factors to cope with percentage changes.
These ideas are crucial to any understanding of financial mathematics. However, if you are
already confident in using percentages, you may wish to miss this out and move straight
on to the applications covered in sub-sections 3.1.1 and 3.1.2.
MFE_C03a.qxd 16/12/2005 11:02 Page 177

For example,
25% is the same as =
30% is the same as =
50% is the same as =
1
2
50
100
3
10
30
100
1
4
25
100
Mathematics of Finance
178
Example
Calculate
(a) 15% of 12 (b) 98% of 17 (c) 150% of 290
Solution
(a) 15% of 12 is the same as
× 12 = 0.15 × 12 = 1.8
(b) 98% of 17 is the same as
× 17 = 0.98 × 17 = 16.66
(c) 150% of 290 is the same as
× 290 = 1.5 × 290 = 435
150
100
98
100
15
100
Practice Problem
1 Calculate
(a) 10% of $2.90 (b) 75% of $1250 (c) 24% of $580
Whenever any numerical quantity increases or decreases, it is customary to refer to this
change in percentage terms. The following example serves to remind you how to perform cal-
culations involving percentage changes.
Example
(a) An investment rises from $2500 to $3375. Express the increase as a percentage of the original.
(b) At the beginning of a year, the population of a small village is 8400. If the annual rise in population is
12%, find the population at the end of the year.
(c) In a sale, all prices are reduced by 20%. Find the sale price of a good originally costing $580.
MFE_C03a.qxd 16/12/2005 11:02 Page 178

Solution
(a) The rise in the value of the investment is
3375 − 2500 = 875
As a fraction of the original this is
= 0.35
This is the same as 35 hundredths, so the percentage rise is 35%.
(b) As a fraction
12% is the same as = 0.12
so the rise in population is
0.12 × 8400 = 1008
Hence the final population is
8400 + 1008 = 9408
(c) As a fraction
20% is the same as = 0.2
so the fall in price is
0.2 × 580 = 116
Hence the final price is
580 − 116 = $464
20
100
12
100
875
2500
3.1 • Percentages
179
Practice Problem
2 (a) A firm’s annual sales rise from 50 000 to 55 000 from one year to the next. Express the rise as a
percentage of the original.
(b) The government imposes a 15% tax on the price of a good. How much does the consumer pay
for a good priced by a firm at $1360?
(c) Investments fall during the course of a year by 7%. Find the value of an investment at the end of
the year if it was worth $9500 at the beginning of the year.
In the previous example and in Practice Problem 2, the calculations were performed in two
separate stages. The actual rise or fall was first worked out, and these changes were then applied to
the original value to obtain the final answer. It is possible to obtain this answer in a single calcula-
tion, and we now describe how this can be done. Not only is this new approach quicker, but it
also enables us to tackle more difficult problems. To be specific, let us suppose that the price
of good is set to rise by 9%, and that its current price is $78. The new price consists of the
MFE_C03a.qxd 16/12/2005 11:02 Page 179