Hull J.C. Risk management and Financial institutions
Подождите немного. Документ загружается.

Volatility 119
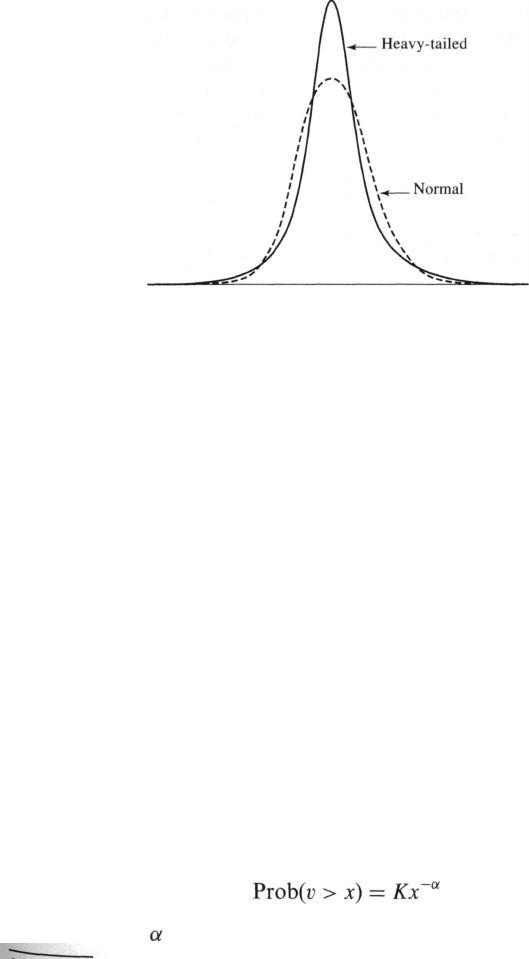
Figure 5.1 Comparison of normal distribution with a
heavy-tailed distribution. The two distributions have the
same mean and standard deviation.
Figure 5.1 compares a typical heavy-tailed distribution (such as the one
for foreign exchange) with a normal distribution that has the same mean
and standard deviation.
4
The heavy-tailed distribution is more peaked
than the normal distribution. In Figure 5.1, we can distinguish three parts
of the distribution: the middle, the tails, the intermediate parts (between
the middle and the tails). When we move from the normal distribution to
the heavy-tailed distribution, probability mass shifts from the intermediate
parts of the distribution to both the tails and the middle. If we are
considering the percentage change in a market variable, the heavy-tailed
distribution has the property that small and large changes in the variable
are more likely than they would be if a normal distribution were assumed.
Intermediate changes are less likely.
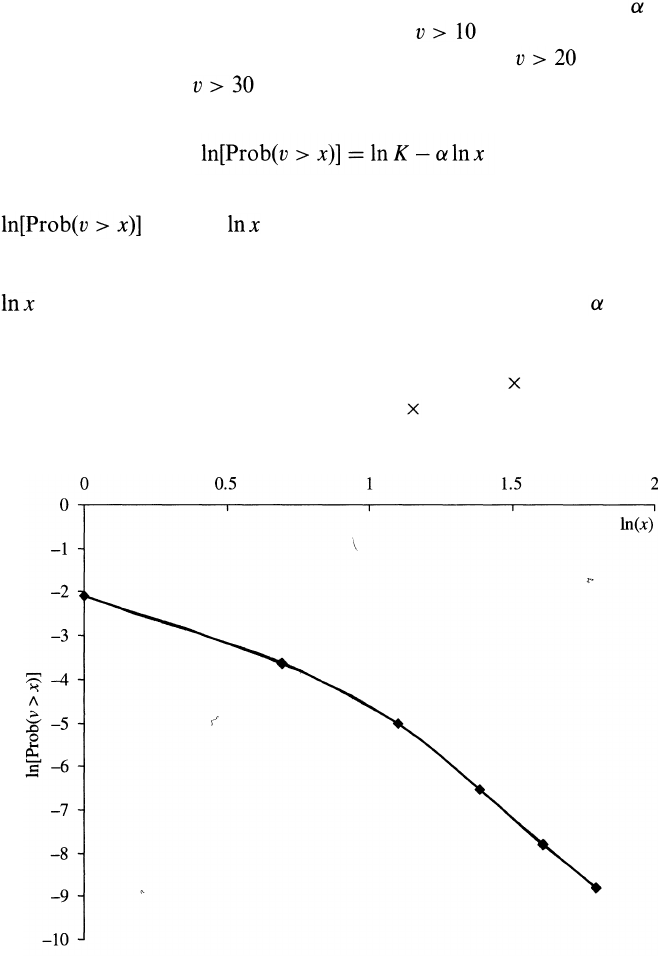
An Alternative to Normal Distributions: The Power Law
The power law asserts that, for many variables that are encountered in
practice, it is approximately true that the value v of the variable has the
Property that, when x is large,
(5.1)
where K and are constants. This equation has been found to be
4
Kurtosis measures the size of a distribution's tails. A leptokurtic distribution has heavier
tails than the normal distribution. A Platykurtic distribution has less heavy tails than the
normal distribution. A distribution with tails of the same size as the normal distribution is
termed mesokurtic.
120
Chapter 5
approximately true for variables as diverse as the income of individuals,
the size of cities, and the number of visits to a website. Suppose that = 3
and we observe that the probability that is 0.05. In this case
K = 50 and we can estimate that the probability that is 0.00625;
the probability that is 0.0019; and so on.
Equation (5.1) implies that
We can therefore do a quick test of whether it holds by plotting
against . We do this for our exchange rate data in
Figure 5.2. The logarithm of the probability of the exchange rate increasing
by more than x standard deviations is approximately linearly dependent on
for x > 3 showing that the power law holds. The parameter is about
5.5. When producing Figure 5.2, we assume that the distribution of
exchange rate changes in Table 5.2 is symmetrical, so that the probability
of a change greater than one standard deviation is 0.5 25.04 = 12.52%,
greater than two standard deviations is 0.5 5.27 = 2.635%, and so on.
We will examine the power law more formally and explain better
Figure 5.2 Log-log plot for exchange rate increases: x is number of
standard deviations; v is the exchange rate increase.
Volatility 121
procedures for estimating the parameters when we consider extreme value
theory in Chapter 9. We will also explain how it can be used in the
assessment of operational risk in Chapter 14.
5.5 MONITORING DAILY VOLATILITY
Risk managers cannot assume that asset prices are well behaved with a
constant volatility. It is important for them to monitor volatility daily.
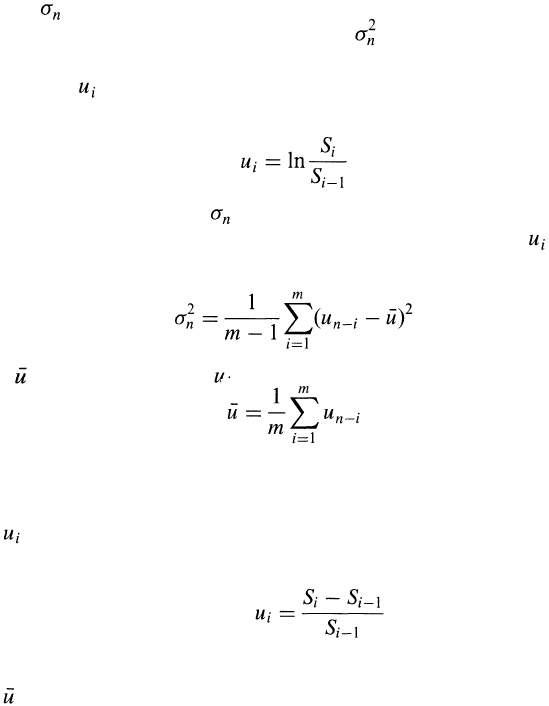
Define as the volatility of a market variable on day n, as estimated at
the end of day n — 1. The variance rate is . Suppose that the value of
the market variable at the end of day i is S
i
. As in Section 5.3, we define
the variable as the continuously compounded return during day i
(between the end of day i — 1 and the end of day i), so that
One approach to estimating is to set it equal to the historical volatility as
calculated in Section 5.3. When m days of observations on the are used,
this approach gives
(5.2)
where is the mean of the :
For risk management purposes, the formula in equation (5.2) is usually
changed in a number of ways:
1. is defined as the percentage change in the market variable
between the end of day i — 1 and the end of day i so that
(5.3)
This makes very little difference to the values of u
i
that are computed.
2. is assumed to be zero. The justification for this is that the expected
change in a variable in one day is very small when compared with
the standard deviation of changes.
3. m — 1 is replaced by m. This moves us from an unbiased estimate of
volatility to a maximum-likelihood estimate (see Section 5.9).
122 Chapter 5
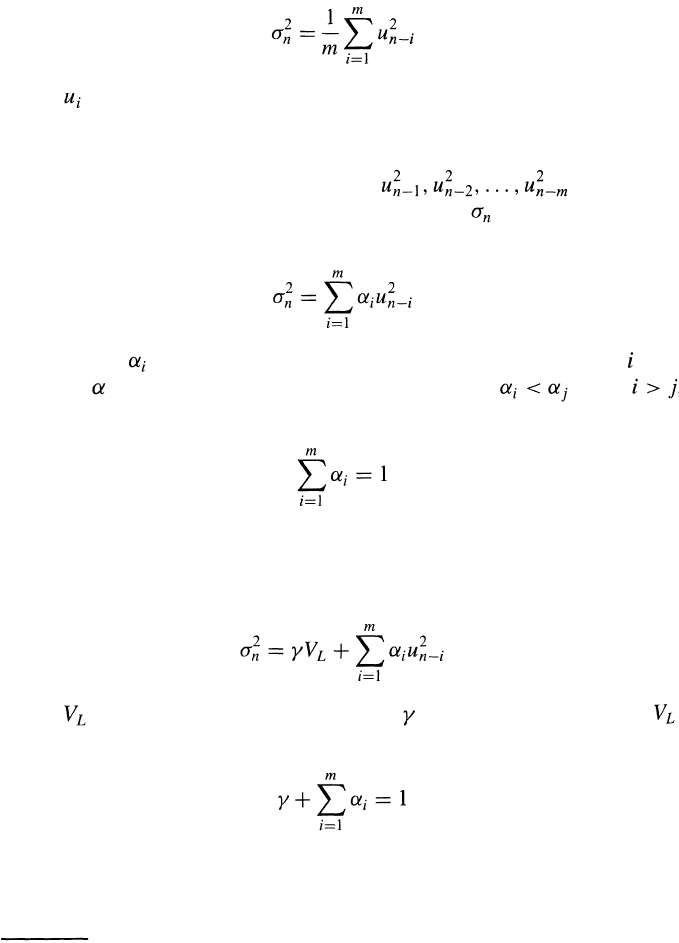
These three changes allow the formula for the variance rate to be
simplified to
(5.4)
where is given by equation (5.3).
Weighting Schemes
Equation (5.4) gives equal weight to all . Our objec-
tive is to estimate the current level of volatility, . It therefore makes
sense to give more weight to recent data. A model that does this is
(5.5)
The variable is the amount of weight given to the observation days
ago. The 's are positive. If we choose them so that when
less weight is given to older observations. The weights must sum to unity,
so that
An extension of the idea in equation (5.5) is to assume that there is a
long-run average variance rate and that this should be given some weight.
This leads to the model that takes the form
(5.6)
where is the long-run variance rate and is the weight assigned to
Since the weights must sum to unity, we have
This is known as an ARCH(m) model. It was first suggested by Engle.
The estimate of the variance is based on a long-run average variance
and m observations. The older an observation, the less weight it is given.
5
See R. Engle, "Autoregressive Conditional Heteroscedasticity with Estimates of the
Variance of UK Inflation," Econometrica, 50 (1982), 987-1008. Robert Engle won the
Nobel prize for economics in 2003 for his work on ARCH models.
Volatility
123
Defining , we can write the model in equation (5.6) as
In the next two sections we discuss two important approaches to mon-
itoring volatility using the ideas in equations (5.5) and (5.6).
5.6 THE EXPONENTIALLY WEIGHTED MOVING
AVERAGE MODEL
The exponentially weighted moving average (EWMA) model is a parti-
cular case of the model in equation (5.5) where the weights decrease
exponentially as we move back through time. Specifically, ,
where is a constant between 0 and 1.
It turns out that this weighting scheme leads to a particularly simple
formula for updating volatility estimates. The formula is
The estimate of the volatility for day n (made at the end of day n — 1)
is calculated from (the estimate of the volatility for day n — 1 that
was made at the end of day n — 2) and (the most recent daily
percentage change).
To understand why equation (5.8) corresponds to weights that decrease
exponentially, we substitute for to get
or
Substituting in a similar way for gives
Continuing in this way, we see that
For a large m, the term is sufficiently small to be ignored, so that
124 Chapter 5
equation (5.8) is the same as equation (5.5) with . The
weights for the u's decline at rate as we move back through time. Each
weight is times the previous weight.
Example 5.2
Suppose that is 0.90, the volatility estimated for a market variable for day
n — 1 is 1 % per day, and during day n — 1 the market variable increased by
2%. This means that = 0.01
2
= 0.0001 and = 0.02
2
= 0.0004. Equa-
tion (5.8) gives
= 0.9 0.0001+0.1 0.0004 = 0.00013
The estimate of the volatility for day n is therefore , or 1.14%, per
day. Note that the expected value of is , or 0.0001. In this example,
the realized value of is greater than the expected value, and as a result
our volatility estimate increases. If the realized value of had been less
than its expected value, our estimate of the volatility would have decreased.
The EWMA approach has the attractive feature that relatively little data
need to be stored. At any given time, we need to remember only the
current estimate of the variance rate and the most recent observation on
the value of the market variable. When we get a new observation on the
value of the market variable, we calculate a new daily percentage change
and use equation (5.8) to update our estimate of the variance rate. The
old estimate of the variance rate and the old value of the market variable
can then be discarded.
The EWMA approach is designed to track changes in the volatility.
Suppose there is a big move in the market variable on day n — 1, so that
is large. From equation (5.8), this causes our estimate of the current
volatility to move upward. The value of governs how responsive the
estimate of the daily volatility is to the most recent daily percentage change.
A low value of leads to a great deal of weight being given to the when
is calculated. In this case, the estimates produced for the volatility on
successive days are themselves highly volatile. A high value of (i.e., a
value close to 1.0) produces estimates of the daily volatility that respond
relatively slowly to new information given by the daily percentage change.
The RiskMetrics database, which was originally created by J. P. Morgan
and made publicly available in 1994, uses the EWMA model with = 0.94
for updating daily volatility estimates. The company found that, across a
range of different market variables, this value of gives forecasts of the
variance rate that come closest to the realized variance rate.
6
The realized
6
See J. P. Morgan, RiskMetrics Monitor, Fourth Quarter, 1995. We will explain an
alternative (maximum-likelihood) approach to estimating parameters later in the chapter.
Volatility
125
variance rate on a particular day was calculated as an equally weighted
average of the on the subsequent 25 days (see Problem 5.20).
5.7 THE GARCH(1,1) MODEL
We now move on to discuss what is known as the GARCH(1,1) model,
proposed by Bollerslev in 1986.
7
The difference between the GARCH(1,1)
model and the EWMA model is analogous to the difference between
equation (5.5) and equation (5.6). In GARCH(1,1), is calculated from
a long-run average variance rate, , as well as from and . The
equation for GARCH(1,1) is
(5.9)
where is the weight assigned to , is the weight assigned to , and
is the weight assigned to . Since the weights must sum to one, we
have
The EWMA model is a particular case of GARCH(1,1) where ,
, and
The "(1,1)" in GARCH(1,1) indicates that is based on the most
recent observation of and the most recent estimate of the variance rate.
The more general GARCH(p,q) model calculates from the most recent
observations on and the most recent estimates of the variance rate.
8
GARCH(1, 1) is by far the most popular of the GARCH models.
Setting , we can also write the GARCH(1,1) model as
(5.10)
This is the form of the model that is usually used for the purposes of
7
See T. Bollerslev. "Generalized Autoregressive Conditional Heteroscedasticity,"
Journal of Econometrics, 31 (1986), 307-327.
8
Other GARCH models have been proposed that incorporate asymmetric news. These
models are designed so that depends on the sign of . Arguably, these models are
more appropriate than GARCH(1,1) for equities. This is because the volatility of an
equity's price tends to be inversely related to the price, so that a negative should
have a bigger effect on than the same positive . For a discussion of models for
handling asymmetric news, see D. Nelson, "Conditional Heteroscedasticity and Asset
Returns; A New Approach," Econometrica, 59 (1990), 347-370 and R. F. Engle and
V. Ng, "Measuring and Testing the Impact of News on Volatility," Journal of Finance, 48
(1993), 1749-1778.
126 Chapter 5
estimating the parameters. Once and have been estimated, we can
calculate as The long-term variance V
L
can then be calcu-
lated as For a stable GARCH(1,1) process, we require < 1.
Otherwise the weight applied to the long-term variance is negative.
Example 5.3
Suppose that a GARCH(1,1) model is estimated from daily data as
This corresponds to =0.13, =0.86, and =0.000002. Since =
1- it follows that = 0.01, and, since we have V
L
= 0.0002.
In other words, the long-run average variance per day implied by the model is
0.0002. This corresponds to a volatility of = 0.014, or 1.4%, per day.
Suppose that the estimate of the volatility on day n - 1 is 1.6% per day, so
that = 0.016
2
= 0.000256, and that on day n - 1 the market variable
decreased by 1%, so that = 0.01
2
= 0.0001. Then
= 0.000002 + 0.13 x 0.0001 + 0.86 x 0.000256 = 0.00023516
The new estimate of the volatility is therefore = 0.0153, or 1.53%,
per day.
The Weights
Substituting for in equation (5.10), we obtain
or
Substituting for we get
Continuing in this way, we see that the weight applied to is
The weights decline exponentially at rate The parameter can be
interpreted as a "decay rate". It is similar to in the EWMA model. It
defines the relative importance of the u's in determining the current
variance rate. For example, if = 0.9, then is only 90% as import-
ant as is 81% as important as and so on. The
GARCH(1,1) model is the same as the EWMA model except that, in
addition to assigning weights that decline exponentially to past it also
assigns some weight to the long-run average volatility.
Volatility 127
5.8 CHOOSING BETWEEN THE MODELS
In practice, variance rates do tend to be pulled back to a long-run average
level. This is known as mean reversion. The GARCH(1,1) model incorpor-
ates mean reversion whereas the EWMA model does not. GARCH(1,1) is
therefore theoretically more appealing than the EWMA model.
In the next section, we shall discuss how best-fit parameters and
in GARCH(1,1) can be estimated. When the parameter is zero, the
GARCH(1,1) reduces to EWMA. In circumstances where the best-fit
value of turns out to be negative, the GARCH(1,1) model is not stable
and it makes sense to switch to the EWMA model.
5.9 MAXIMUM-LIKELIHOOD METHODS
It is now appropriate to discuss how the parameters in the models we have
been considering are estimated from historical data. The approach used is
known as the maximum-likelihood method. It involves choosing values for
the parameters that maximize the chance (or likelihood) of the data
occurring.
To illustrate the method, we start with a very simple example. Suppose
that we sample ten stocks at random on a certain day and find that the
price of one of them declined on that day and the prices of the other nine
either remained the same or increased. What is our best estimate of the
probability of a price decline? The natural answer is 0.1. Let us see if this
is the result given by the maximum-likelihood method.
Suppose that the probability of a price decline is p. The probability
that one particular stock declines in price and the other nine do not is
p(l - p)
9
. (There is a probability p that it will decline and 1 — p that each
of the other nine will not.) Using the maximum-likelihood approach, the
best estimate of p is the one that maximizes p(1 — p)
9
. Differentiating this
expression with respect to p and setting the result equal to zero, we find
that p = 0.1 maximizes the expression. This shows that the maximum-
likelihood estimate of p is 0.1, as expected.
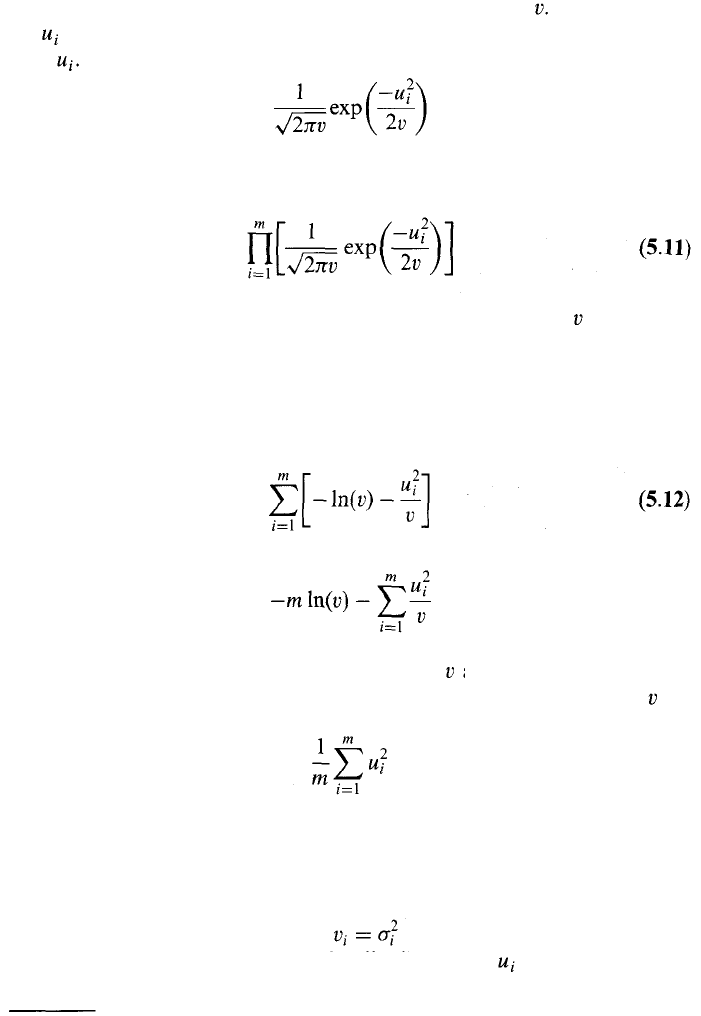
Estimating a Constant Variance
As our next example of maximum-likelihood methods, we consider the
problem of estimating the variance of a variable X from m observations
on X when the underlying distribution is normal with mean zero. We
assume that the observations are u
1
, u
2
, ..., u
m
and that the mean of the
128
Chapter 5
underlying distribution is zero. Denote the variance by The likelihood
of being observed is the probability density function for X when
X = This is
The likelihood of m observations occurring in the order in which they are
observed is
Using the maximum-likelihood method, the best estimate of is the value
that maximizes this expression.
Maximizing an expression is equivalent to maximizing the logarithm of
the expression. Taking logarithms of the expression in equation (5.11)
and ignoring constant multiplicative factors, it can be seen that we wish to
maximize
or
Estimating GARCH(1,1) Parameters
We now consider how the maximum-likelihood method can be used to
estimate the parameters when GARCH(1,1) or some other volatility
updating scheme is used. Define as the estimated variance for
day i. We assume that the probability distribution of conditional on the
variance is normal. A similar analysis to the one just given shows the best
The unbiased estimator has m replaced by m — 1.
Differentiating this expression with respect to and setting the resultant
equation to zero, we see that the maximum-likelihood estimator of is
9