Hillert M. Phase Equilibria, Phase Diagrams and Phase Transformations: Their Thermodynamic Basis
Подождите немного. Документ загружается.

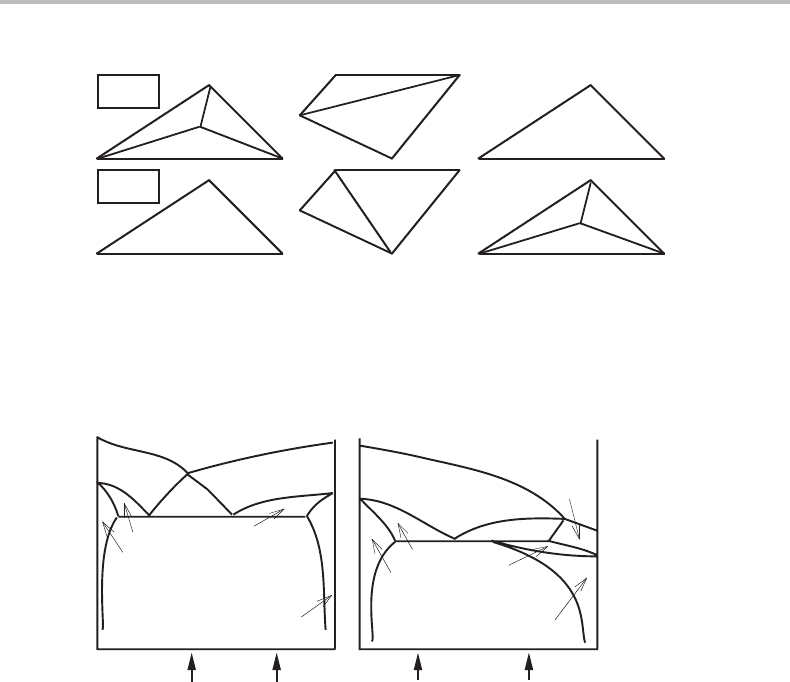
12.5 Classification of sharp phase transformations 265
class I class II
class III
T >T
O
T <T
O
Figure 12.9 Different types of four-phase reactions in a ternary system, represented in a
compositional coordinate system.
α+β+γ
α+β+γ
β+γ
α+γ
L+α+β
L+β+γ
L+β
L+α
L+α
L+β
L+α+β
β+γ
α+γ
L+β+γ
L+α+γ
L+α+γ
1
234
L
L
(a) (b)
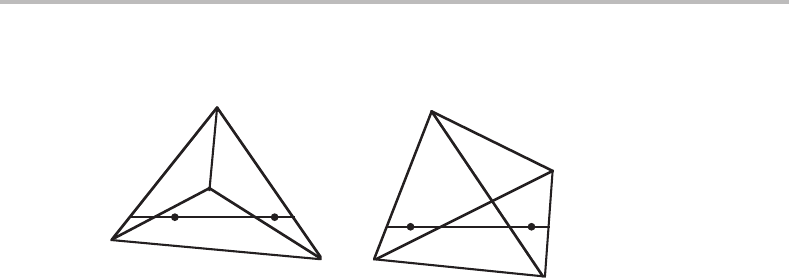
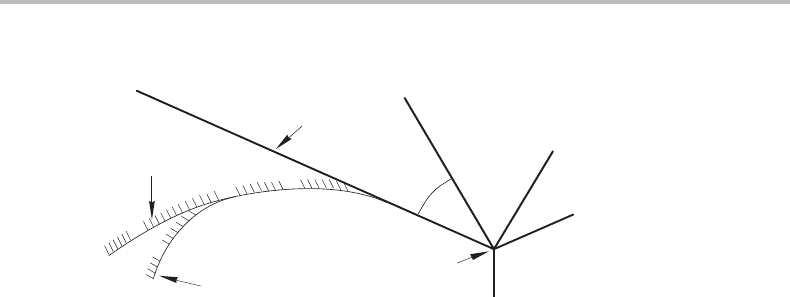
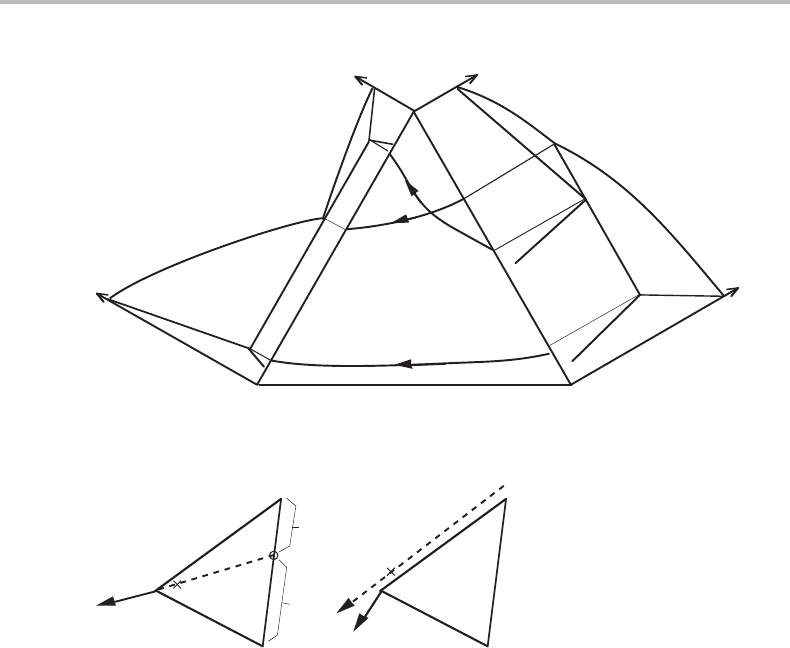
Figure 12.10 See Exercise 12.6.
four alloys, indicated by arrows, go through on cooling. Show projections of the four-
phase planes and draw lines representing the two sections.
Hint
In both diagrams all four three-phase fields connected to the invariant four-phase field are
shown in the section. It is thus possible to know the type of transformation. In diagram
(a), three of the four fall above the invariant one and these three all contain liquid. It is
evident that this is a four-phase eutectic transformation. Both the alloys, 1 and 2, give
L → α + β + γ and the parts of these alloys, already solidified, remain unchanged. In
diagram (b) there are two three-phase fields on each side of the four-phase horizontal.
This must be a class II transformation and both alloys, 3 and 4, give L + α → β + γ.
Solution
The solution is shown in Fig. 12.11.
266 Sharp and gradual phase transformations
1
2
3
4
α
α
β
β
γ
γ
L
L
(a) (b)
Figure 12.11 Solution to Exercise 12.6.
12.6 Applications of Schreinemakers’ projection
Schreinemakers’ T, P diagram, introduced in Section 10.1, can be very useful in a dis-
cussion of phase transformations, in particular for higher-order systems where all other
methods of reducing the number of axes to two would yield much more complicated
pictures. As an introduction, consider the diagram in Fig. 10.1(b).Itshows that there are
three two-phase surfaces covering the angle between the (α) and (β) lines. By keeping
P and T constant at values within that angle and varying µ
B
we could expect the trans-
formations α ↔ δ, γ ↔ δ and β ↔ γ.Ofcourse, they should occur one after the other
and only two reaction sequences are possible, β → γ → δ → α or the reverse. By this
consideration we can immediately conclude that the phases are arranged in this order
along the composition axis, z
B
. This is confirmed by Fig. 10.10. Similar considerations
based on the other angles will give less complete answers. Unfortunately, this very sim-
ple way of deciding the relative compositions of the phases taking part in an invariant
equilibrium gets much more complicated in higher-order systems. The method based on
coincidence, described in Section 10.4,may be more powerful.
Next, let us consider a transformation occurring by changing T or P and keeping
the other constant. If the composition is also constant, then the phase field rule from
Eq. (10.6)would yield
d = c + 2 − p − n
s
+ n
m
= c + 2 − p − c + c − 1 = c + 1 − p
because n
s
= 1 + c − 1 = c and n
m
= c − 1. A sharp transformation should be obtained
for d = 0, i.e. p = c + 1, and should thus occur if the system would cross a uni-
variant line (for which p = c + 1, see Section 10.1). This can be accomplished by
a suitable choice of composition. For illustration, see the arrow in Fig. 10.9. Then
the question is, what type of sharp transformation will it be. From the projection
in Fig. 10.1(b) we would only know that the (δ) line should give a transformation
between α, β and γ.However, the following method can be used to give more detailed
information.
Since δ does not exist along the (δ) line, it can only exist on the other side of the
invariant point. It will thus exist on the upper sides of the other univariant lines but
not on their lower sides (see Fig. 12.12(a)). Using the same kind of information from
12.6 Applications of Schreinemakers’ projection 267
δ
δ
δ
(δ)
(α)
(β)
(γ)
δ
δ
δ
(δ)
(α)
(β)
(γ)
α
α
α
β
β
β
γ
γ
γ
T
P
(a) (b)
Figure 12.12 Method to decide the type of transformation. For instance, the δ phase only exists
on the other side of the invariant point, counted from the δ-absent line, here denoted (δ). The
arrow in Fig. 10.9,which is an expansion of the lower part of the present figure in the z
B
direction, illustrates the γ → α + β transformation.
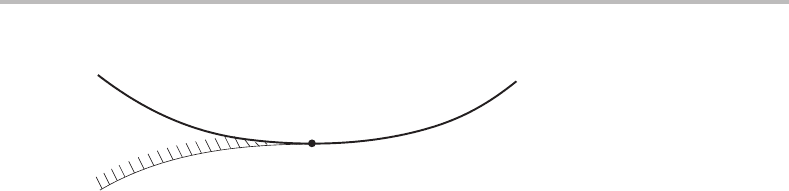
Figure 12.13 Detail of binary T, x phase diagram with a point of minimum for the β + L
equilibrium. There the transformation β → L will be congruent. Three sets of lines
representing equilibrium with α at different P are given.
the other lines we get the results shown in Fig. 12.12(b).Bycrossing the (δ) line from
left to right, i.e. by decreasing P, under a suitable constant value of z
B
,wethus get the
transformation α + β → γ.Itshould be emphasized that the transformations described
by the positions of the Greek letters in Fig. 12.12 only occur when a line is crossed in
the plane of the projected diagram. It gives no information on the transformations in any
other direction.
In Section 10.8 it was concluded that one can include in Schreinemakers’ projection
a curve showing where an equilibrium with p = c phases degenerates by the phases
falling on the same point for a binary system, on the same line for a ternary system,
etc. An example was shown in Fig. 10.27. Such a singular curve may originate from
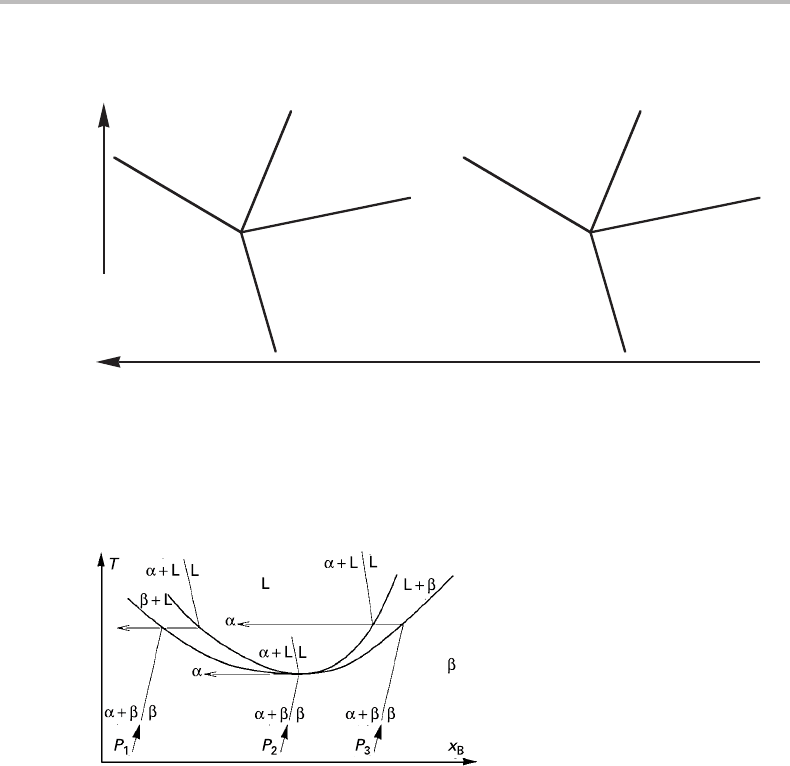
a univariant line, as demonstrated in Figs 12.13 and 12.14, using a binary system for
illustration.
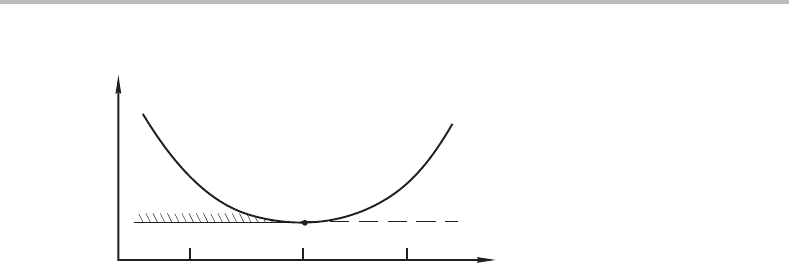
268 Sharp and gradual phase transformations
L
L +α L
β
β
β
α+β
L
T
P
1
P
2
P
3
P
Figure 12.14 Schreinemakers’ P, T diagram corresponding to Fig. 12.13. The univariant line
changes character at the black point. That is where the singular curve originates and there is a
compositional degeneracy in that point. The α phase does not take part in the reaction there.
In order to simplify the construction, it was here assumed that the β + L equilibrium is
not affected by P but an increased P will increase the stability of α. Lines for equilibrium
with α are presented for three P values. With the lowest P value, P
1
, the α + β + L
equilibrium is of the peritectic type. With the highest P value, P
3
,itisofthe eutectic
type and the intermediate P value, P
2
, shows the transition where α does not take part
in the transformation of L to β. That will give a singular point on the univariant line for
α + β + LinFig.12.14 and that is where the singular curve for β + L starts.
At lowP (to the left of the transition point in Fig.12.14)analloyof suitable composition
would transform by L +α → β on the univariant line if its composition is such that it
reaches the three-phase horizontal in Fig. 12.13 on cooling. Otherwise, it wouldtransform
by L → β at lower T. That would happen if the composition is to the right of the L point
for P
1
in Fig. 12.13.Inany case, the transformation L → β would be completed at or
before the point of minimum in Fig. 12.13, i.e. the singular curve in Fig. 12.14.Athigh
P (to the right of the transition point) an alloy of suitable composition would transform
by L → α + β on the univariant line. That would happen for compositions on both sides
of the L point for P
3
in Fig. 12.13,but usually after a proeutectic precipitation of α or
β.Ifthe liquid alloy can be undercooled by α not nucleating, it may solidify by L → β
according to the part of the L +β phase field below the eutectic temperature. The lowest
temperature of solidification by L → β according to the phase diagram is again the
minimum. However, this part of the L + β phase field is only metastable at P
3
. That is
why the singular curve in Fig. 12.14 has been drawn with a dashed line to the right of
the transition point.
Figure 10.3 illustrated a congruent point in a ternary system and it was concluded
that the position of such points could also be illustrated by a line in Schreinemakers’
projection. The name ‘doubly singular’ was proposed. Such a curve can originate from a
transition point on a singular curve, much in the same way as the singular curve originates
from a univariant line. This is illustrated in Fig. 12.15 where an invariant equilibrium
is also included. The L +β + γ surface covers the area between the (α) and (δ) lines.
However, to the left of the singular point L/(β + γ) that surface, when coming from the
(α) line, will overshoot the (δ) line, reach the singular curve and then bend back and
end up on the (δ) line. If the composition is suitable, then the alloy will not transform by
12.6 Applications of Schreinemakers’ projection 269
.
.
β+γ
α +β+ γ
β+γ
L+γ
L+α
L+β+γ
β
β
β
δ
γ
(α)
(β)
(γ)
(δ)
(L)
L
L
L
L
L
β+γ
L
β
singular curve
univariant
equilibrium
invariant equilibrium
+
+
doubly singular curve
Figure 12.15 Schematic Schreinemakers’ projection of a ternary system, illustrating a possible
arrangement of a univariant line, a singular curve and a doubly singular curve.
L + α → β + γ on the univariant line because there will be no α present. Such an alloy
will solidify by L → β + γ below the univariant line but in any case not later than on
the singular curve. However, if there is a transition point on the singular curve, to the left
of which the solidification reaction is L + γ → β, then the solidification can only occur
by L → β if there is no γ present. The alloy may then pass the singular curve on cooling
but in any case it should have solidified before passing the doubly singular curve.
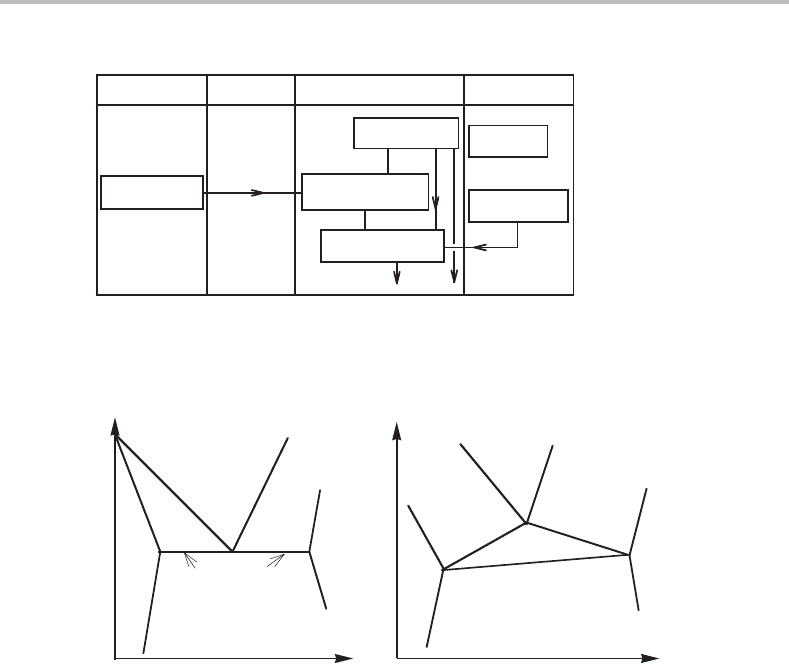
Exercise 12.7
What transformation would occur on crossing the (α) line in Fig. 10.14(b) by increasing
the value of Y
k
at constant values of Y
j
, X
m
m1
and X
n
m1
?
Hint
Use the method illustrated by Fig. 12.12.
Solution
β + γ → δ + ε.
Exercise 12.8
Use the three-phase reactions indicated by Fig. 12.12(b) to decide on the relative com-
positions of the four phases.
Hint
The reactions on decreasing T are δ → α + β, β + δ → γ, δ → α + γ and γ → α + β.
Solution
δ must fall between α and β, γ between β and δ, δ between α and γ and finally γ between
α and β. They must be arranged in the order β, γ, δ, α or in the opposite direction.
270 Sharp and gradual phase transformations
α +β+γ
δ+ε
Figure 12.16 See Exercise 12.9.
Exercise 12.9
Figure 12.16 gives a detail of Schreinemakers’ projection of a quinary system. It shows a
univariant line for the α + β + γ + δ + ε + φ equilibrium and a singular curve for the
α + β + γ + δ + ε singular equilibrium. What transformation can be expected when
the univariant line is crossed?
Hint
Use the fact that the singular curve is stable only on the indicated side of the singular
point.
Solution
To the left of the transition point one can avoid the univariant reaction and reach the
singular curve if φ is not present before the univariant line is reached. Thus, φ does not
form by the univariant reaction but would be consumed if it were present. The reaction
must be α + β + γ + φ → δ + ε.Tothe right of the transition point, the univariant
reaction cannot be suppressed, not even if φ is absent, and the reaction must be α + β +
γ → δ + ε + φ.
12.7 Scheil’s reaction diagram
In many types of systems, P has a negligible effect and without any loss of information
one can section at P = 1 bar. For a binary system one will thus get the usual T, x diagram.
Foraternary system there is one dimension more but one could project in the T direction
and use x
B
and x
C
as axes. Such diagrams are useful but tend to be overloaded with
phase boundaries if many phases are solutions because there will be lines showing the
compositional changes of all those phases. A simpler diagram would be obtained by
using µ
B
and µ
C
(or a
B
and a
C
)asaxes. However, much information would be missing.
Using the method illustrated in Fig. 12.12 one could easily find what transformation
would occur on crossing a univariant line but that would be of limited use. In order to
hit the line one must now work with a constant heat content because the projected axis
is T. Furthermore, one would have to vary µ
B
or µ
C
which is rarely very practical.
A rather useful method was proposed by Scheil [25] for ternary systems. His reaction
diagram shows how the lines representing three-phase equilibria are connected to form
12.7 Scheil’s reaction diagram 271
L→β+γ
L→α+β+γ
L→α+β
L→α+γ
B−CB−AB−A −CA−C
Figure 12.17 Scheil’s reaction scheme for a simple ternary system with eutectic reactions.
L+λ→κ
L→κ+(Al)
L→θ+(Al)
L+θ+κ→τ
L+θ→τ+(Al)
L→κ+τ+(Al)
Fe−AI Fe−Ni Fe−Ni−AI Ni−AI
Figure 12.18 See Exercise 12.10.
four-phase equilibria as a function of T but with no regard for composition. His diagram
also shows what three-phase equilibria originate from the binary sides. In addition, the
reactions occurring on cooling through the four-phase equilibria are given explicitly in
boxes. The diagram for a simple eutectic system is presented in Fig. 12.17.Ofcourse,
similar diagrams can be constructed for quaternary systems, showing four- and five-
phase equilibria.
Exercise 12.10
Part of Scheil’s diagram for the Al–Fe–Ni system is shown in Fig. 12.18, reproduced
from a publication. A mistake was made by joining the binary (L + λ → κ) with (L →
κ + τ
1
+ (Al) ). Try to correct it.
Hint
What phases are common for the four-phase equilibria? What one-dimensional equilibria
should connect them?
Solution
The solution is shown in Fig. 12.19.
272 Sharp and gradual phase transformations
L+λ→κ
L→κ+(Al)
L→θ+(Al)
L+θ+κ→τ
L+θ→τ+(Al)
L→κ+τ+(Al)
Fe−AI Fe−Ni Fe−Ni−AI Ni – AI
Figure 12.19 Solution to Exercise 12.10.
T
T
α
α
β
β
γ
γ
α+β
α+γ
γ+β
α+β+γ
α+β+γ
α+β
α+γ
γ+β
x
B
x
B
(a) (b)
Figure 12.20 A section at constant P and x
C
through a ternary phase diagram in (b), compared
with a binary diagram in (a).
12.8 Gradual phase transformations at fixed composition
If a new component is added to a system where a sharp transformation with p = c + 1
has been found at constant P (see Fig. 12.20(a)), then the value of c increases by one
unit and for the same transformation one will now have p = c. The dimensionality of
the corresponding phase field will thus increase by one unit. This case may be illustrated
by an x
C
section at a low value of x
C
(see Fig. 12.20(b)).
It is evident that the phase transformation between γ and α + β, occurring when T is
changed, can no longer be sharp but is somewhat gradual. However, if the addition of
the new component is small, its effect on the actual phase transformation should also be
small and one may still recognize its characteristic features, for instance in the resulting
eutectic microstructure illustrated in Fig. 12.5,inparticular if the temperature has been
changed enough to move the system from the γ phase field to the α + β phase field
before the transformation has started. The transformation may thus appear as sharp even
though it is classified as a gradual transformation on thermodynamic grounds. As an
example, we shall now examine a case involving three phases and three components.
Figure 12.21 shows the T projection of such a phase diagram under constant P.
12.8 Gradual phase transformations at fixed composition 273
T
L
L
B
A
C
L
T
T
T
α
α
α
β
β
β
Figure 12.21 Temperature projection of the isobaric A–B–C phase diagram.
α
β
L
L
α
β
a
b
(a) (b)
Figure 12.22 Conditions for (a) a eutectic transformation and (b) a peritectic transformation in a
ternary system under constant pressure and a gradual decrease of the temperature.
In this particular case the same three-phase equilibrium occurs in two of the binary
systems but it has different character, being eutectic on one side and peritectic on the
other. Evidently, there must be a transition between the two types somewhere inside the
ternary system. In order to decide where the transition is situated we must first examine
how we can recognize the two types when the compositions of the phases change during
the transformation. This is fairly easy if we consider a system which consists of an L
phase only and if it has the correct composition for equilibrium with the α and β phases.
As the temperature is lowered slightly, the three-phase triangle moves and covers the
composition of the system (see the cross in Fig. 12.22(a)). Evidently, we should expect
the reaction L → L +α + β. Here we have included the L phase on both sides because
it has different compositions and it would be impossible to satisfy the mass balance
condition if that is not taken into account.
The dashed line in Fig. 12.22(a) is the extrapolation of the direction in which the L
phase is moving. It goes through the L corner of the triangle and the average composition
of the system, and it intersects the opposite side, a and b being the intercepts. From
Fig. 4.5 it is easy to see that the α and β phases must form in the proportion b:a and this
will be the ratio between them in the microstructure. As far as α and β are concerned they
have formed from material corresponding to the circle. It may not be very important that
274 Sharp and gradual phase transformations
α
β
L
Figure 12.23 See Exercise 12.11.
this material has been drawn from a phase with a different composition. From this point
of view, the reaction is clearly of the eutectic type. The result will be quite different if the
extrapolation does not intersect the opposite side. An example is given in Fig. 12.22(b).
The composition of the system will then fall outside the new three-phase triangle and
inside a two-phase field, L + β. The reaction will simply be L → L + β and L will not
move in the direction of the L line in the phase diagram (solid arrow) but straight away
from the β phase (dashed arrow). L will no longer be in equilibrium with α.
The limiting case is found when the extrapolation, i.e. the solid arrow, is directed
away from the β corner. Using that criterion one could find the point of transition in the
phase diagram in Fig. 12.21 if it were equipped with a series of three-phase triangles for
slightly different temperatures. Even though the criterion was derived by considering an
alloy composed of an L phase only, it is more general because, in practice, it may often
be justified to neglect the diffusion inside the solidified material in comparison with the
rapid diffusion in the liquid phase. The progress of the reaction at each stage is thus
mainly determined by the momentary composition of the L phase and in which direction
it is moving. For a reaction, where three solid phases are involved, it may be necessary
to make a detailed analysis of the diffusion of all the elements in all the phases. In the
next section we shall consider a special case where one component diffuses much faster
than the others.
Exercise 12.11
The sketched detail of an isobarothermal section of a ternary phase diagram (Fig. 12.23)
shows how all the phases in a three-phase equilibrium change on cooling.
(a) Test how a melted specimen with the composition of the L corner will react on
cooling. Give a reaction formula.
(b) Test how a β phase specimen with the composition of the β corner will react on
cooling. Give a reaction formula.
(c) Compare the two results. Discuss anything that may seem surprising.